# Multifamily Rent Growth at the 2026 Halftime, Where Demand Is Holding
Section 01The midyear picture, growth returns but stays modest
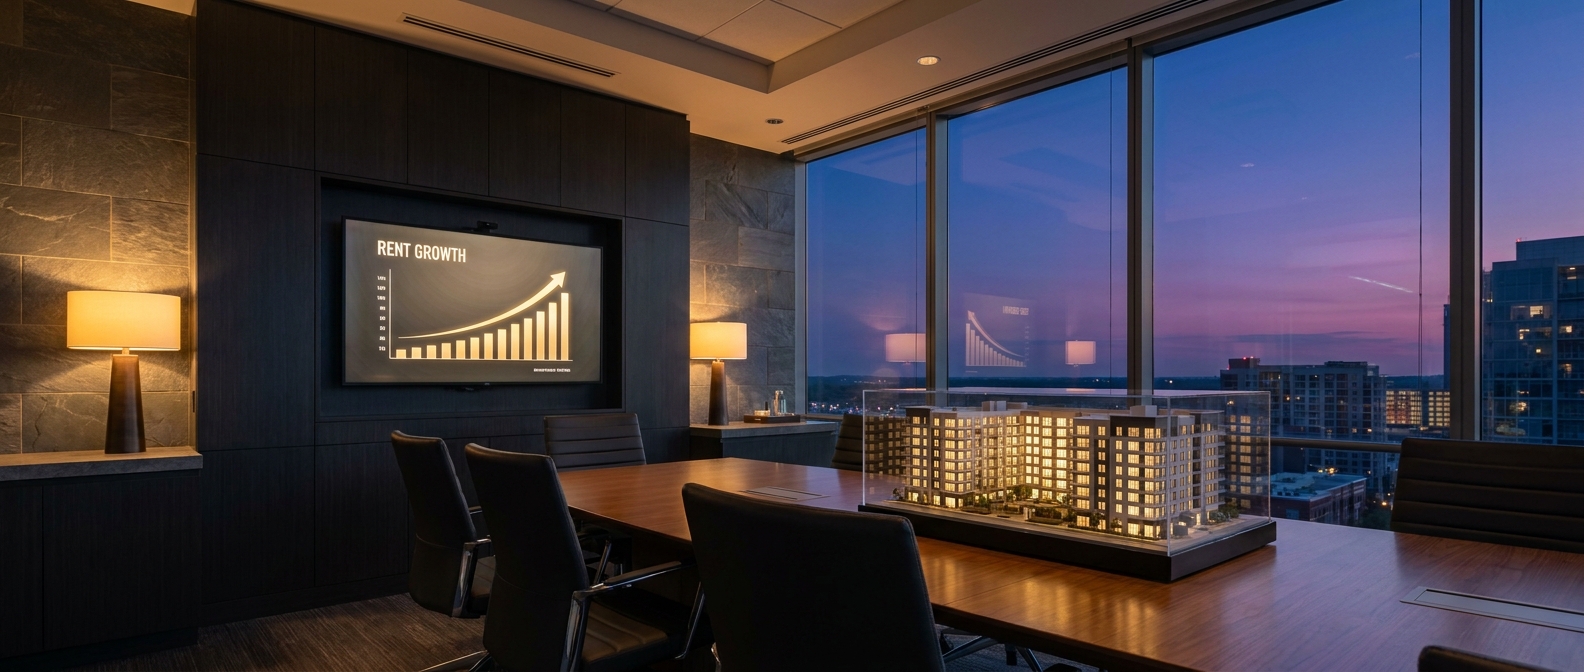
At the halfway mark of 2026, US apartment rent growth has turned positive again after a soft patch, though the pace remains restrained. RealPage Market Analytics reported that same store effective asking rents rose 0.4 percent year over year in July 2026, the first positive annual reading since July 2025, built on seven straight monthly gains ranging from 0.2 percent to 0.6 percent (RealPage, July 2026 US Data Update). Yardi Matrix, using an advertised asking rent series rather than a same store series, put the average national asking rent at 1,771 dollars in July, up 0.2 percent year over year and up 1.3 percent year to date, which it called the strongest July showing since 2015 outside the early post pandemic boom (Yardi Matrix, National Multifamily Market Report, July 2026). The two series differ in method, so the levels are not directly comparable, but both point the same direction: slow, consistent improvement.
Section 02Demand is holding, and supply is finally receding
The clearest signal of the year is that demand has held up while new construction recedes. CBRE reported net absorption of 167,500 units in the second quarter of 2026, nearly double the first quarter tally, which pulled the national multifamily vacancy rate down 50 basis points quarter over quarter to 4.3 percent, below its long run average of roughly 5.0 percent (CBRE, Q2 2026 US multifamily release). RealPage measured more than 187,000 units absorbed from April through June, one of the strongest spring leasing seasons in recent years, even as trailing annual demand of about 271,300 units still ran below the decade average near 340,000 units (RealPage, July 2026 US Data Update).
On the supply side, the wave is cresting. RealPage counted roughly 77,700 units completed in the second quarter, bringing annual deliveries to about 340,200 units, the sixth consecutive quarter of declining annual supply after a peak near 588,000 units in late 2024 (RealPage, July 2026 US Data Update). CBRE independently cited the same 77,700 unit quarter, a 14 percent decrease from a year earlier (CBRE, Q2 2026 US multifamily release). When absorption rises as deliveries fall, pricing power tends to return, which is the mechanism behind the modest rent gains above.
Section 03Household formation, the demand engine underneath
Rent demand ultimately rests on household formation. The Census Bureau Current Population Survey household estimate, as published by the Federal Reserve Bank of St. Louis, stood at 133,971 thousand households in June 2026 (US Census Current Population Survey via FRED, series TTLHHM156N, June 2026). That is a foundation of demand, but the pace of new household creation faces a headwind: the Harvard Joint Center for Housing Studies noted in August 2026 that the sharp drop in immigration that began in 2025 is expected to weigh increasingly on household growth (Harvard Joint Center for Housing Studies, August 2026). For owners, that frames the coming period as one where absorbing the recent supply matters more than counting on rapid demographic tailwinds.
Section 04Where demand is holding, and where it is not
The national averages mask a wide geographic split. Coastal and gateway markets with constrained pipelines are leading, while several heavy supply Sun Belt metros are still absorbing units and cutting rents. The table below draws each figure from a named public source.
| Market | Annual rent growth | Source |
|---|---|---|
| San Francisco | 13.5 percent (RealPage same store); 5.3 percent (Yardi advertised) | RealPage July 2026 US Data Update; Yardi Matrix July 2026 |
| San Jose | 8.0 percent | RealPage July 2026 US Data Update |
| Virginia Beach | 6.3 percent | RealPage July 2026 US Data Update |
| New York | roughly 4 percent (RealPage); 5.2 percent (Yardi) | RealPage July 2026; Yardi Matrix July 2026 |
| Milwaukee | 4.1 percent | RealPage July 2026 US Data Update |
| Chicago | 2.7 percent | RealPage July 2026 US Data Update |
| Austin | negative 3.7 percent | Yardi Matrix July 2026 |
| Denver | negative 2.7 percent | Yardi Matrix July 2026 |
| Phoenix | negative 2.1 percent | Yardi Matrix July 2026 |
RealPage described technology focused coastal markets, supported by constrained pipelines and expanding technology employment, as the national rent leaders, while the South remained the only region still posting annual rent cuts (RealPage, July 2026 US Data Update). Yardi likewise placed gateway and Midwest markets at the front, with San Francisco up 5.3 percent, New York up 5.2 percent, and Kansas City up 3.1 percent, and heavy supply Austin, Denver, and Phoenix in negative territory (Yardi Matrix, National Multifamily Market Report, July 2026).
Section 05Occupancy and the near term read
Occupancy tells a consistent story of gradual firming. RealPage put US apartment occupancy at 95.5 percent in July 2026, matching July 2025 and up 90 basis points since the end of 2025 despite a slight 10 basis point monthly dip (RealPage, July 2026 US Data Update). Yardi Matrix, on its separate measure, reported national occupancy of 94.1 percent in June 2026, down 60 basis points year over year, with the softest absolute readings in Houston at 91.6 percent, Austin at 91.9 percent, and Dallas at 92.2 percent (Yardi Matrix, National Multifamily Market Report, July 2026). The gap between the two occupancy levels again reflects differing samples and definitions, not a contradiction.
Section 06What it means for owners and investors
Read together, the midyear data describe a market where the supply overhang is easing, demand is proving durable, and rent growth is quietly returning while staying uneven across geographies. Coastal and Midwest markets with limited new construction are recovering first, while several Sun Belt metros continue to work through elevated deliveries. CBRE reported that multifamily remained the largest property sector for United States commercial real estate investment in the second quarter of 2026, underscoring continued institutional demand for the asset class even as overall transaction volumes stayed below their prior peaks (CBRE, Q2 2026). This article is educational commentary only. It is not investment, legal, or tax advice, and it is not an offer or solicitation. Every figure above is attributed to a named public source with its data date so that readers can weigh the evidence themselves.