New York City is the most liquid and most heavily regulated apartment market in the United States, and in 2026 it is clearly split in two. Free market buildings are in a real recovery, with strong rents, historically low vacancy, and rising values. Rent stabilized buildings remain repriced far below where they traded a decade ago. Understanding why means looking at three forces at once: thirty years of capitalization rates, the cost of capital, and a new City Hall under Mayor Zohran Mamdani. This is an educational study, based on third party data, and every figure is attributed to its named source.
Section 01Thirty years of cap rates, from 8 percent to a generational low and back
A capitalization rate is a property's net operating income divided by its price. When buyers are confident and money is cheap, they accept a lower yield, so cap rates fall and prices rise. When capital is expensive or risk is high, cap rates widen and prices fall. In the mid 1990s, Manhattan apartment buildings traded around 8 to 9 percent. Cheap debt then compressed yields to a generational low near 3 percent in 2006, and again to roughly 3.6 percent in the 2013 to 2018 era. When the Federal Reserve lifted rates above 5 percent in 2023 and 2024, cap rates reset upward. The table below shows key points across the thirty years. These are not one continuous index, so read the trend, not the decimal.
| Period | Core Manhattan cap rate | Source |
|---|---|---|
| 1995 | 8.75% elevator, 8.92% walk up | Massey Knakal |
| 2000 | 7.55% elevator | Massey Knakal |
| 2005 | 3.80% elevator | Massey Knakal |
| 2006 | 3.05% elevator, cycle low | Massey Knakal |
| 2009 | 4.50% elevator | Massey Knakal |
| 2013 | 3.72% | Ariel |
| 2017 | 3.61% | Ariel |
| 2019 | 3.98% | Ariel |
| 2022 | 4.36% | Ariel |
| 2024 | 6.23% | Ariel |
| H1 2025 | 6.62% | Ariel / GREA |
Section 02Cap rates year by year, 2020 to 2026
The recent repricing is the heart of the story. Figures for 2020 to 2025 are the Ariel Property Advisors Manhattan average for transactions with ten or more residential units. There is no closed full year 2026 Manhattan average yet, so it is shown as an interim reading.
| Year | Manhattan cap rate | Source and note |
|---|---|---|
| 2020 | 4.58% | Ariel, 10 plus units |
| 2021 | 4.56% | Ariel |
| 2022 | 4.36% | Ariel |
| 2023 | 5.24% | Ariel |
| 2024 | 6.23% | Ariel |
| 2025 | 6.62% (H1) | Ariel / GREA |
| 2026 | interim, no closed average. J.P. Morgan cites Moody's at 5.4% in Q1, Cushman 6.04% elevator, Matthews 6.09% | citywide readings |
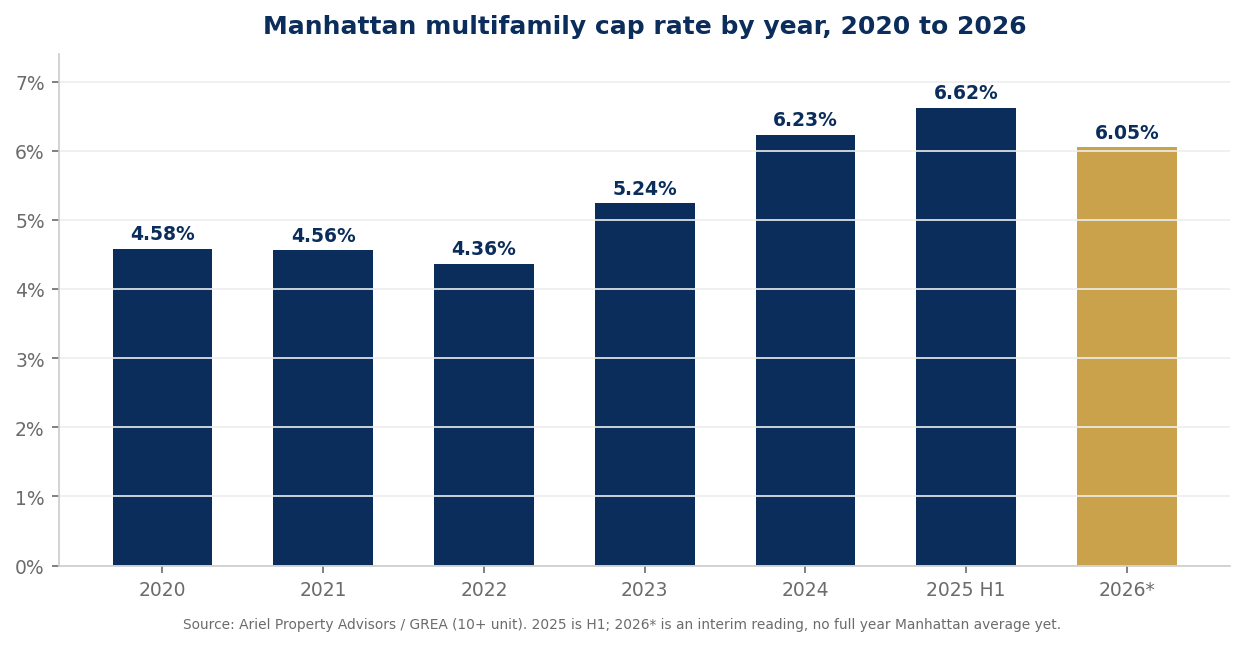
The turn is clear: yields held near 4.5 percent in 2020 and 2021, dipped in 2022, then climbed roughly 190 basis points across 2023 and 2024 as the Fed held rates above 5 percent, and edged higher into the first half of 2025. The 2026 readings suggest a plateau near the cyclical high rather than compression.
Section 03The central chart: cap rates versus interest rates
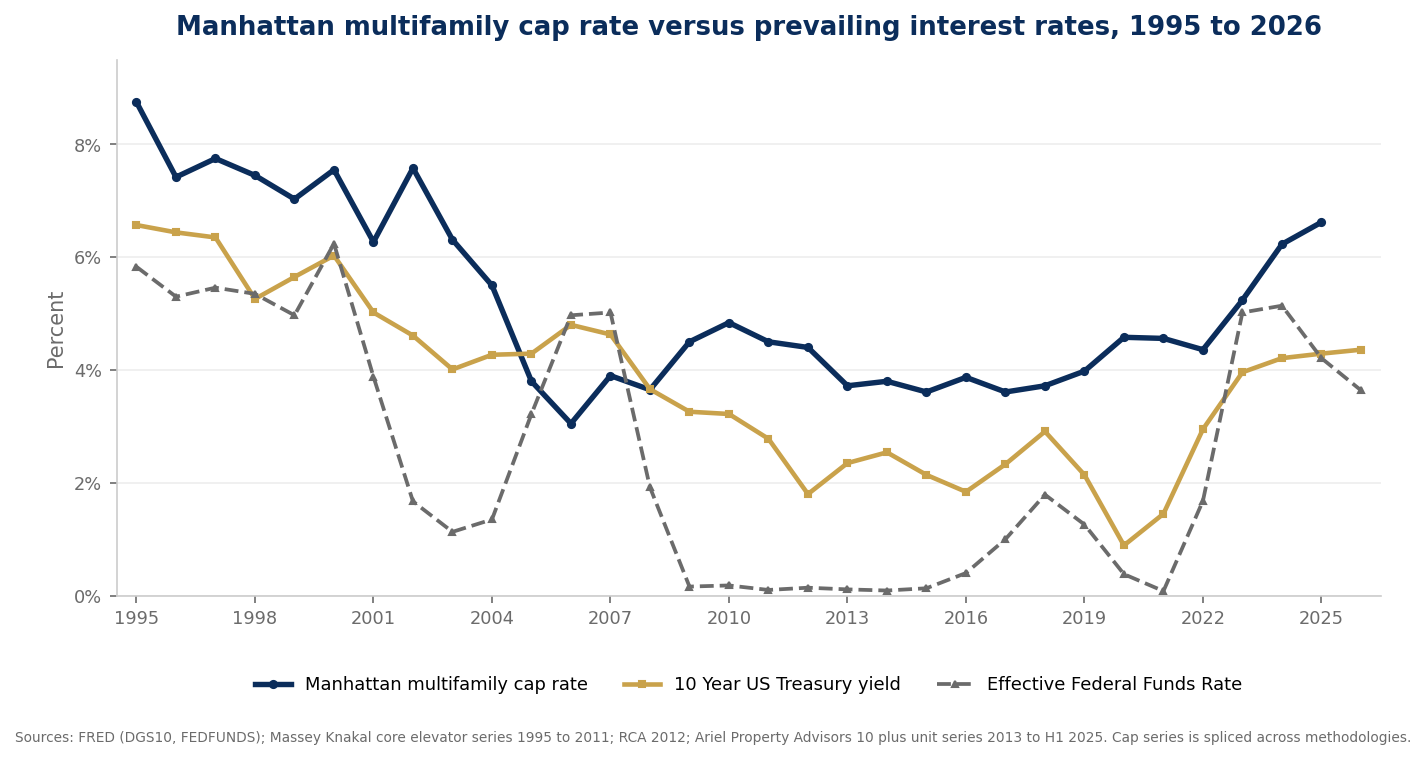
The relationship between rates and cap rates is not mechanical, but it is real. When the 10 Year Treasury and the Federal Funds Rate collapsed after 2008 and again in 2020, Manhattan cap rates ground toward 3.5 to 4.5 percent, because cheap debt let buyers accept thin going in yields. When the Fed pushed rates above 5 percent in 2023 and 2024, cap rates widened to 6 percent and beyond. Private real estate reprices with a lag, so the cap rate line follows the rate line, just more slowly.
| Year | 10 Year Treasury | Fed Funds | Manhattan cap rate |
|---|---|---|---|
| 2005 | 4.29% | 3.22% | 3.80% |
| 2009 | 3.26% | 0.16% | 4.50% |
| 2015 | 2.14% | 0.13% | 3.61% |
| 2019 | 2.14% | 1.26% | 3.98% |
| 2021 | 1.45% | 0.08% | 4.56% |
| 2023 | 3.96% | 5.02% | 5.24% |
| 2024 | 4.21% | 5.14% | 6.23% |
| 2025 | 4.29% | 4.21% | 6.62% (H1) |
One detail captures the moment. Ariel noted a recent Upper West Side transaction that kept assumable Fannie Mae financing at 2.6 percent through 2031. In a world where new debt costs around 6 percent, below market financing is an asset in itself, and negative leverage, where the mortgage rate sits above the cap rate, is a live risk on many acquisitions.
Section 04One city, two markets
The single most important fact in New York today is the gap between two kinds of buildings.
| Segment | Price per unit | Price per SF | Versus prior peak |
|---|---|---|---|
| Free market | $732,709 | $892 | 14% below 2017 peak |
| Rent stabilized (citywide) | ~$149,000 | ~$201 | 43% to 45% below 2019 |
What happened in 2019 matters. The Housing Stability and Tenant Protection Act capped the revenue that once justified premium pricing on stabilized buildings, and prolonged high rates compounded the problem. Owners who borrowed cheaply in 2021 now face loans maturing at roughly double the original rate, with banks lending less and refinancing scarce. In the retail apartment market the picture is different: the Manhattan median sale price has climbed over thirty years, per Douglas Elliman and Miller Samuel.
| Year | Manhattan median sale price | Note |
|---|---|---|
| 1995 | $207,500 | historical series |
| 2007 | $860,000 | pre crisis |
| 2008 | $955,000 | record at the time |
| 2024 Q4 | $1,100,000 | Elliman |
| 2025 Q3 | $1,180,000 | Elliman |
| 2025 Q4 | $1,125,000 | Elliman |
Section 05Why good buildings are losing value
Even quality buildings are repricing lower, and the reason is not that the asset got worse. Two outside forces press on it at once. First, prolonged high rates: when financing is expensive, a buyer pays less for the same income because more of the return is consumed by debt service. Second, regulation: when income is capped by law, even a prime building cannot raise rents to offset rising expenses, taxes, and insurance. Matthews reports the average price per unit citywide is still about 19 percent below the 2021 peak. For an owner who does not have to sell, that is a paper decline. For a leveraged owner whose debt is maturing, it can be a real source of distress.
Section 06Verified example transactions
Real, sourced deals, mostly on the Upper East Side, the core of Manhattan. Price per unit is calculated where the source did not publish it.
| Building | Year | Price | Units | Price per unit | Cap rate | Source |
|---|---|---|---|---|---|---|
| Manhattan House, 200 East 66 | 2005 | $625M | ~583 | $1.072M | n/r | NY Post |
| 420 East 80 | 2006 | $62M | 155 | $400,000 | n/r | M&M coverage |
| 161 East 96 | 2015 | $6.562M | 19 | $345,368 | 2.57% | Ariel |
| 420 East 80 | 2018 | over $85M | 155 | over $548,387 | 3.18% | Marcus and Millichap |
| 160 East 89 | 2018 | $55.1M | 51 | $1,080,392 | 5.33% | CBRE |
| 75 Wadsworth Terrace | 2023 | $9.25M | 81 | $114,197 | 6.38% | Ariel |
| 1760 Third Avenue | 2024 | $172.1M | 435 | $395,632 | 5.33% | Newmark |
| The Henley, 165 East 66 | 2024 | $128M | 150 | $853,333 | n/r | The Real Deal |
| 322 East 93 | 2025 | $10.5M | 20 | $525,000 | 5.75% | Alpha Realty |
Deals from 2015 to 2018 closed at exceptionally low going in yields, at times under 3 percent, when money was cheap and competition for quality was fierce. Deals in 2024 and 2025 close nearer 5 to 6 percent, a direct expression of the higher cost of capital. The same kind of building, on the same street, is priced at a much higher yield than it was seven years ago.
Section 07Is capital leaving the city
For parts of the market, yes. The data backs it up. IRS migration reporting shows large net losses of taxpayers from New York counties: Queens lost about 17,109 taxpayers, the Bronx about 16,319, and Suffolk about 10,434. Even Manhattan, which gained more interstate filers than any other county, lost close to one billion dollars in adjusted gross income, which means those leaving earned far more on average than those arriving. In finance the trend is visible in headquarters moves: Elliott Investment Management relocated to West Palm Beach in 2020, Citadel and Citadel Securities moved to Miami in 2022, and BlackRock opened a West Palm Beach office. Florida and Texas attract firms and capital with no state income tax and lighter regulation, while New York's tax burden and rules are repeatedly cited as push factors.
It is important to be precise. The data proves outmigration of affluent households and financial firms, but it does not prove that Mayor Mamdani's policies specifically are the main cause, since part of the trend predates him and reflects New York's general tax and regulatory burden. Alongside the outflow, opportunistic capital is stepping in now to buy quality at repriced levels, and total transaction volume actually rose, up about 31 percent citywide and close to 48 percent in Manhattan per Cushman and Wakefield. But the direction of affluent capital and of the sell side is clear: those who are regulated, leveraged, or heavily taxed are looking for the way out.
Section 08The Mamdani reset
| Item | Status | Detail |
|---|---|---|
| Affordable housing capital plan | enacted (budget) | five year 22 billion dollar commitment, 12,491 homes financed or preserved in H1 2026 |
| Pied a terre tax | enacted, messy launch | tax on high value non primary residences, about 17,000 letters, roll of ~960,000 owners, a court paused it temporarily |
| NYCHA preservation (PACT) | enacted, ongoing | 32 projects across 29 developments, about 900 apartments preserved |
| Rental Ripoff Report | proposed, needs Council | bar requiring both a credit check and proof of income, recognize tenant unions, AI listing disclosure |
| SPEED reforms | advanced | accelerate affordable housing approvals |
For a private market investor, two things matter most: the scope of the pied a terre tax at the top of the market, and the Rent Guidelines Board posture on stabilized increases at the bottom. The first weighs on luxury demand, the second sets cash flow on regulated buildings.
Section 09What the major firms expect
| Firm | Cap rate view | Rents and volume | Rates and pricing |
|---|---|---|---|
| CBRE | stabilized 5.0% to 5.5%, stable in 2026 then compression | rent growth ~1.4% national | 10 Year near 3.75% needed to lift volume |
| Cushman | H1 2026 ~6.04% elevator, 6.89% core | vacancy at historic lows | measured recovery, rate uncertainty |
| Marcus and Millichap | stabilized yields not seen in decades | rent ~2.1%, deliveries fall to ~15,000 units | agency debt in high 4 percent range |
| Ariel | sharp free market vs stabilized split | Manhattan rents up ~10% YoY, 2.44% vacancy | 2021 loans maturing at double, forced sales |
| J.P. Morgan | Moody's 5.4% in Q1 | rents rising, buyer's market | higher for longer, negative leverage risk |
| Matthews | ~6.09% | rent ~$3,290, vacancy 2.51% | price per unit still 19% below 2021 peak |
The consensus is a gradual normalization rather than a rapid return to 2021 pricing. Free market values should recover through rent growth and, eventually, modest yield compression, while regulated values may stay impaired as long as expenses rise and refinancing is difficult. The swing factor is the cost of capital. If long term rates fall meaningfully below their mid 2026 level near 4.4 to 4.6 percent, the recovery accelerates. If not, the plateau continues.
Section 10What it means for a disciplined investor
The repricing of the last three years restored something the market had not offered for most of the prior fifteen: yield. Free market New York now presents going in cap rates near 5 to 6 percent that did not exist during the era of cheap money. That does not make every building a good investment, and New York carries real regulatory, tax, and refinancing risk that must be underwritten with care. But for a patient, disciplined investor who can tell a distressed regulated building from a quality free market asset bought below replacement cost, a market in transition is often where the opportunity lives.
The most important lesson from this cycle is simple. In New York, the phrase New York cap rate is not one number. Prime, newer, unregulated buildings with assumable low cost debt can price near the low end of the range, while older, regulated, or over leveraged buildings can trade hundreds of basis points wider. The investor's job is to know which one is in front of them.