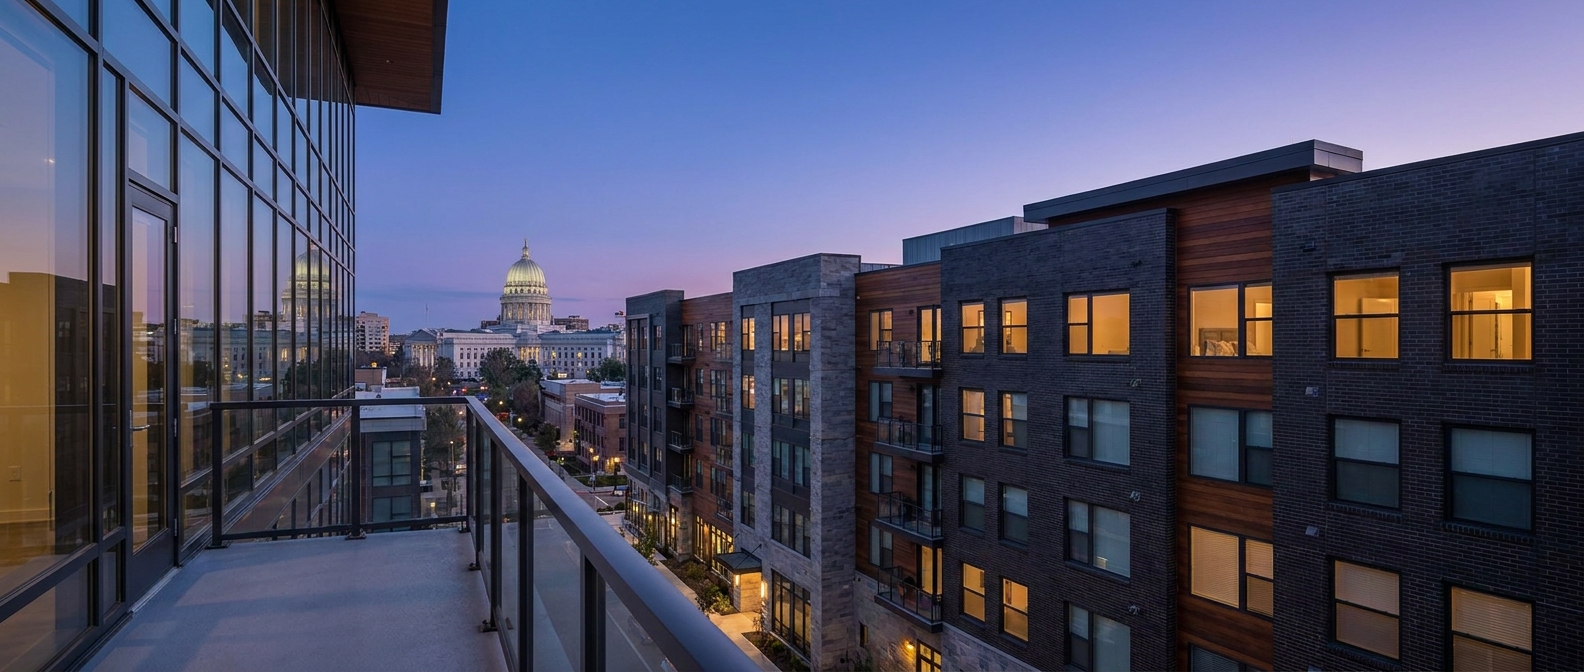
In brief · 200 word summary: Washington DC Multifamily
Washington DC is a high supply apartment market just past the softest part of its cycle. Average advertised rent rose from 2,191 dollars in December 2025 to 2,227 dollars in May 2026, and rent growth turned from negative 1.0 percent year over year to positive 0.3 percent on a trailing three month basis. The pipeline is still large, more than 15,500 units delivered in the prior year, about 21,000 under construction, and roughly 235,000 in planning, but the deliveries are being absorbed rather than overwhelming the market.
What makes DC distinctive is its tie to the federal government. Over the twelve months ending September 2025 the government sector lost about 16,700 jobs, a genuine headwind, partly offset by 14,300 jobs added in education and health services, a reminder the local economy is more diversified than the headline suggests. Any serious view on DC has to weigh federal employment directly.
The multi year path the data supports is stabilization first, then gradual improvement as the pace of new supply recedes and standing assets face less competition. DC also keeps real institutional depth, shown by more than 2.3 billion dollars of 2025 sales volume and a stream of office to residential conversions. Where DC specific vacancy and cap rate figures were not available, this note says so rather than inventing them.
The verified data points
- Average advertised asking rent rose from 2,191 dollars in December 2025 to 2,227 dollars in May 2026. Source: Yardi Matrix February and July 2026 reports.
- Rent growth turned from negative 1.0 percent year over year in late 2025 to positive 0.3 percent on a trailing three month basis by May 2026. Source: Yardi Matrix.
- The pipeline is large but the deliveries are being absorbed: more than 15,500 units delivered in the prior twelve months, about 21,000 units under construction, and roughly 235,000 units in planning and permitting as of July 2026. Source: Yardi Matrix.
- The DC metro produced more than 2.3 billion dollars in multifamily sales volume in full year 2025. Source: Yardi Matrix. CBRE expects national multifamily cap rates to stay stable in 2026 with only incremental compression later.
- The federal factor is real: the government sector lost about 16,700 jobs over the twelve months ending September 2025, partly offset by 14,300 jobs added in education and health services. Source: Yardi Matrix.
Section 01Where the market stands
Washington DC is a high supply market that is just past the softest part of its cycle. Late in 2025, a steadily expanding construction pipeline pushed advertised rent growth to about negative 1.0 percent year over year. By May 2026 that had turned positive again, up 0.3 percent on a trailing three month basis, with average advertised rent at 2,227 dollars. That is not a boom. It is stabilization, the first step before any acceleration.
The reason for caution and for optimism is the same: supply. DC still had about 21,000 units under construction and roughly 235,000 units in the longer planning and permitting pipeline as of July 2026. In the near term that weight keeps rent growth modest. Over time, as completions are absorbed and the pace of new starts slows, that same dynamic is what allows fundamentals to firm.
Section 02The federal factor, the thing that makes DC different
No other major US metro is as tied to a single employer base as Washington is to the federal government and the ecosystem around it. That cuts both ways. Over the twelve months ending September 2025, the government sector shed about 16,700 jobs, a genuine headwind for apartment demand. At the same time, education and health services added 14,300 jobs, which softened the blow and is a reminder that the DC economy is more diversified than the government headline suggests. Any serious view on DC multifamily has to weigh federal employment trends directly, not treat the metro as a generic apartment market.
Section 03What the outlook implies for the next few years
The path that the data supports is stabilization first, then gradual improvement, rather than a sharp rebound. Rent growth has already turned positive. CBRE's 2026 view is that effective rent growth stays constrained while the market digests supply, with better conditions more likely once the pipeline eases. As the wave of completions passes and starts slow, standing assets face less new competition, which supports occupancy and pricing power in the years that follow. DC also keeps a real depth of institutional capital, shown by more than 2.3 billion dollars of sales volume even in a softer 2025, plus a distinctive stream of office to residential conversions in submarkets such as NoMa.
Section 04Why it matters for a passive investor
- Supply timing is a central factor. As a general and historical matter, a metro whose supply pipeline peaks and then recedes tends to see less new competition over time, since the units pressuring rents today become scarcer tomorrow. This is an educational observation, not a recommendation to buy any specific market.
- Underwrite the federal exposure. DC demand is unusually sensitive to government employment. A disciplined underwriting weighs that risk directly rather than assuming steady absorption.
- Liquidity is a feature. A deep transaction market makes it easier to enter and, eventually, to exit. That matters for an illiquid asset class.
A note on discipline: the accessible reports did not provide a single DC specific current vacancy rate, net absorption, or cap rate figure, so this note does not state them. The figures above are the ones that are sourced and dated.
Sources
- Yardi Matrix, Washington DC multifamily market report: https://www.yardimatrix.com/blog/washington-dc-multifamily-market-report/
- Yardi Matrix, Washington DC report, July 2026: https://www.yardimatrix.com/Publications/Download/File/8969-MatrixMultifamilyWashingtonDCReport-July2026
- CBRE, US Real Estate Market Outlook 2026, Multifamily: https://www.cbre.com/insights/books/us-real-estate-market-outlook-2026/multifamily