Section 01Why this question is on the table
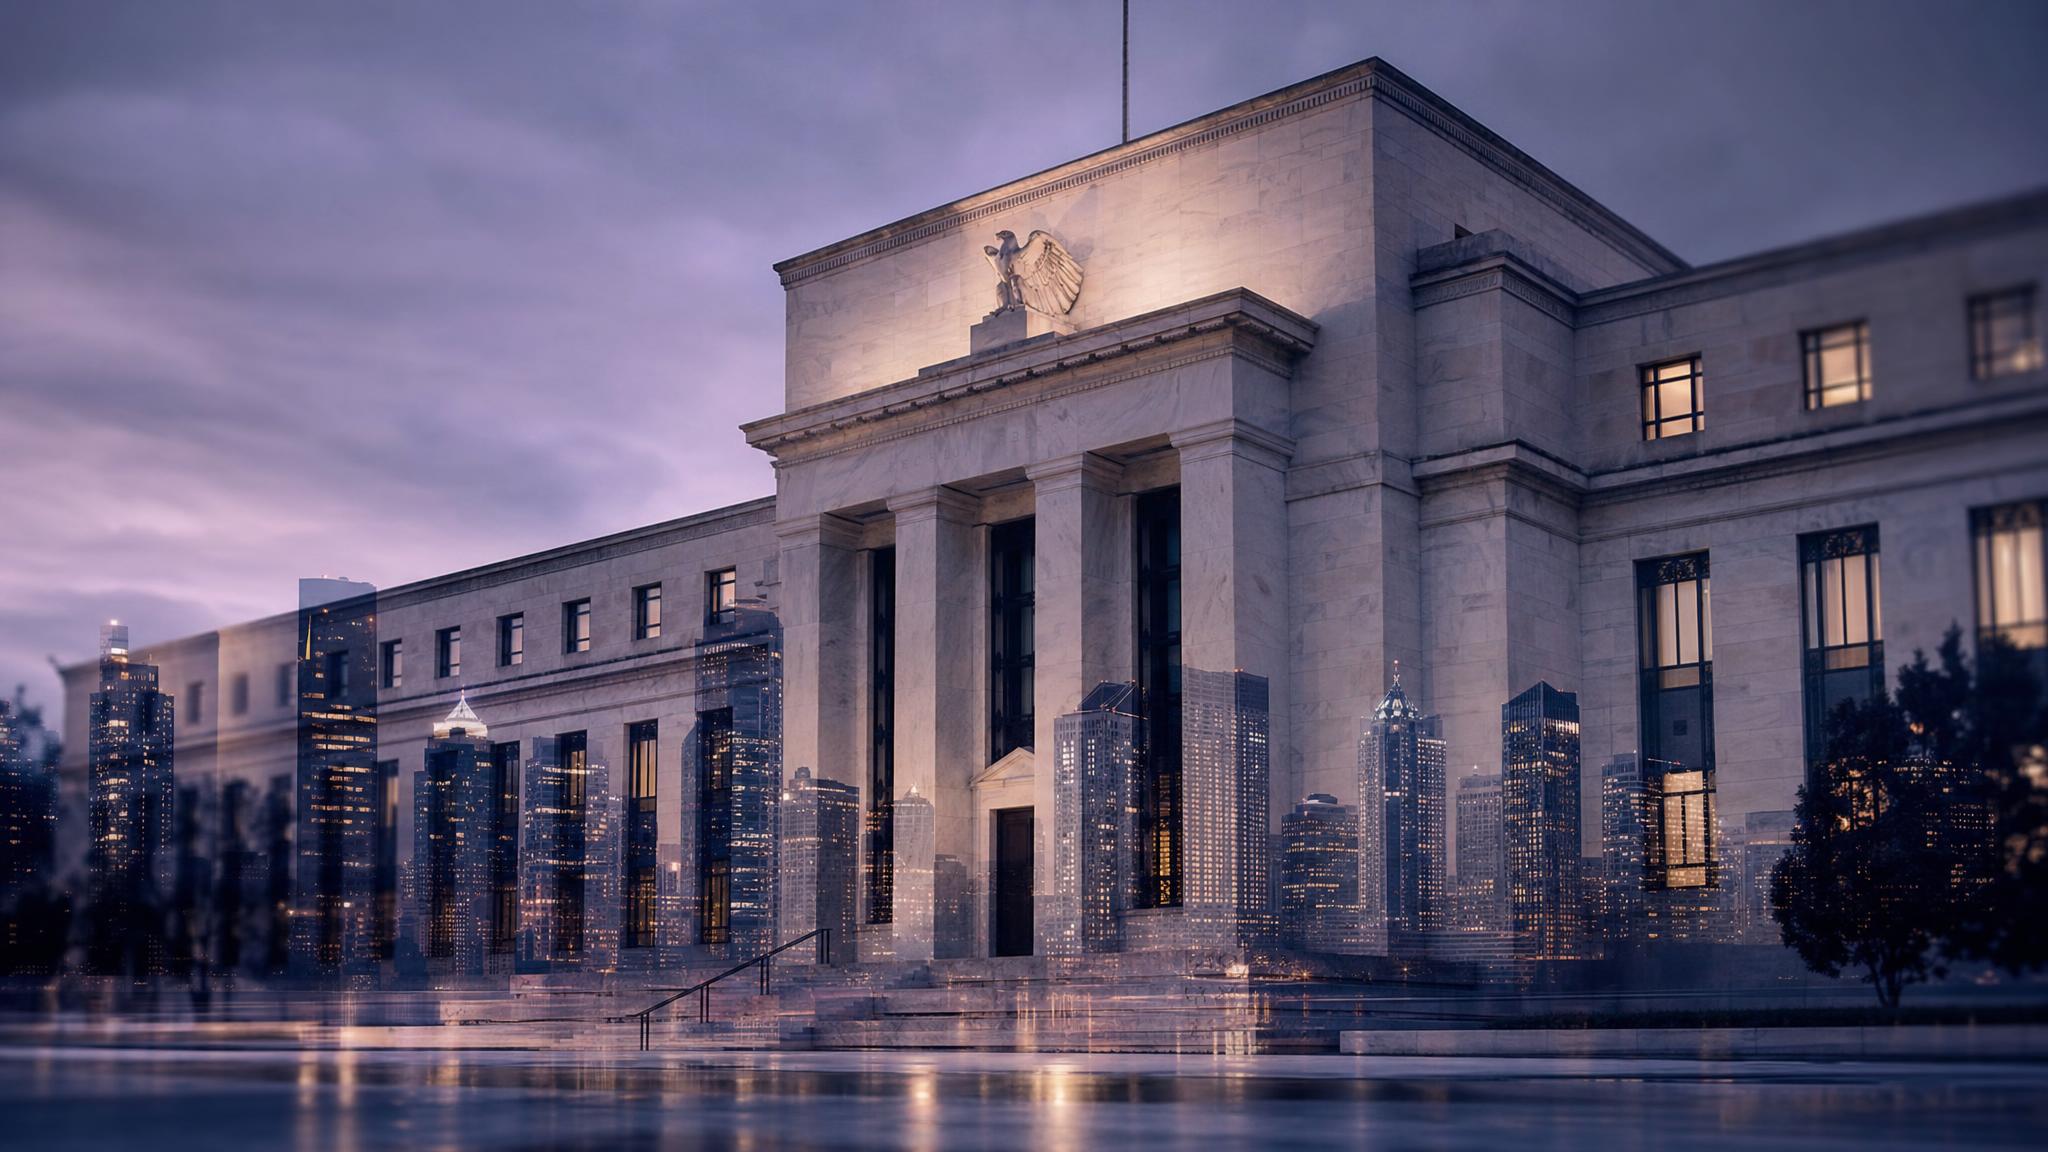
The Federal Open Market Committee held its target range at 3.50 percent to 3.75 percent at its July 28 to 29, 2026 meeting, a 9 to 3 vote in which the three dissenters, Cleveland Fed President Beth Hammack, Minneapolis Fed President Neel Kashkari, and Dallas Fed President Lorie Logan, all favored an immediate 25 basis point increase rather than a hold (source: Global Markets Review, "Fed Holds Rates at 3.50 to 3.75 Percent: What's Next Under Chair Warsh," August 19, 2026). The next meeting, scheduled for September 15 to 16, 2026, is one of the four meetings per year at which the Committee publishes an updated Summary of Economic Projections, including the so called dot plot of individual members' rate expectations for year end 2026 and 2027 (source: Federal Reserve, FOMC meeting calendar, cited in FedRateCalc, "FOMC Minutes Release Schedule 2026," September 2, 2026). A divided vote with three dissents pushing for a hike is enough, on its own, to make the "what if rates go up" question worth asking seriously rather than dismissing. This article is educational commentary for accredited investors, not investment, legal, or tax advice, and it makes no offer or solicitation.
Section 02The base case versus the scenario
It is important to be direct about what the leading forecasters actually expect, because it is not a hike. The Mortgage Bankers Association's August 2026 forecast projects the federal funds rate will remain within its current 3.50 percent to 3.75 percent range through the end of 2026, implying no further hikes at the September, October, or December meetings, while raising its 30 year fixed mortgage rate forecast to average 6.7 percent through the fourth quarter of 2026 and into 2027 (source: Mortgage Bankers Association, cited in Scotsman Guide, "MBA Raises Rate Forecast, Slashes Refinance Outlook," August 21, 2026). Separately, prediction market pricing referenced ahead of the September meeting put the odds of a hold at roughly 61 percent against 39 percent for a 25 basis point hike, with the median dot at the Committee's June 2026 projections showing officials expecting a 3.8 percent federal funds rate at year end, itself only one quarter point above the current midpoint (source: Toobit, "Fed September 2026 Decision: What to Expect," August 26, 2026). In short, a further hike is a live possibility discussed by policymakers and priced by markets, but it is not what most forecasters currently expect. What follows is deliberately framed as a scenario: if the federal funds rate and the 10 year Treasury yield were to move materially higher from here, which property markets and asset classes would likely absorb the shock, and which are more structurally positioned to weather it.
Section 03Most exposed: recent-vintage, leveraged multifamily
CBRE's H1 2026 US Cap Rate Survey, based on roughly 3,600 cap rate estimates collected from more than 200 CBRE professionals in late June 2026, found that infill multifamily was, in its own words, "overall the most bearish subtype," with sentiment split even as the 10 year Treasury yield peaked at 4.67 percent in May 2026 (source: CBRE, "US Cap Rate Survey H1 2026," August 12, 2026, as reported by Yahoo Finance, August 14, 2026). The same survey noted that stabilized multifamily cap rates in New York City widened from a 4.5 to 5.0 percent range in the second half of 2025 to 5.0 to 5.5 percent in the first half of 2026, evidence that even a strong gateway market is not immune to cap rate expansion when financing costs move against it. The exposure is concentrated geographically. Yardi Matrix's July 2026 report found multifamily rents still negative year over year in Austin, Denver, and Phoenix, a legacy of roughly 2.1 million new apartment units added nationally since 2021, with new supply concentrated in the Sun Belt, where inventory grew 17.9 percent compared with 7.8 percent elsewhere (source: Marcus & Millichap, "Multifamily Outlook," May 2026). Marcus & Millichap put Sun Belt vacancy at 6.3 percent in the first quarter of 2026 against 4.1 percent in non-Sun Belt metros. Properties financed with floating rate or short duration bridge debt at 2021 to 2022 vintage valuations, layered on top of markets still absorbing that supply wave, are the combination most directly exposed to a further move up in rates: refinancing costs rise at precisely the moment rent growth is weakest.
Section 04Office: a bifurcation story more than a rate story
Office is frequently grouped with rate-sensitive assets, but the current data describes a bifurcation by quality more than a uniform rate exposure. Cushman & Wakefield's Q1 2026 US Office MarketBeat put national vacancy at 20.2 percent, essentially flat year over year, while noting that Class A vacancy had declined both quarter over quarter and year over year, meaning the headline number is being driven by older, lower quality stock (source: Cushman & Wakefield, "US Office Market Stabilizes as Demand Concentrates in Leading Markets," April 20, 2026). CBRE's first quarter 2026 figures put overall vacancy at 18.6 percent but prime quality vacancy at only 12.7 percent, a spread of nearly 600 basis points between trophy and commodity space. The same CBRE cap rate survey that flagged infill multifamily also identified lower tier office as the other most bearish subtype, with suburban Class A cap rates in Midwest markets such as Chicago widening to a 10 to 12.5 percent range in H1 2026. If rates were to rise further, the office assets most exposed would be exactly the Class B and C buildings already carrying elevated vacancy and facing capital expenditure requirements to compete, while well-leased, well-located trophy assets, the same category drawing renewed institutional and foreign capital described below, would likely see far more modest repricing.
Section 05More insulated: gateway markets and global capital
Gateway markets with deep pools of international and institutional capital have shown more resilience through the current rate cycle than the Sun Belt growth markets that depended heavily on debt-fueled new construction. JLL reported that total US commercial real estate investment volume reached 113 billion dollars in the first quarter of 2026, up 25 percent year over year, with San Francisco investment volume up 150 percent, Chicago up 96 percent, and US office investment overall up 61 percent versus the first quarter of 2025, a rebound JLL attributed in part to unprecedented low levels of new office supply (source: JLL, "US Commercial Real Estate Investment Activity Expands," May 14, 2026). In New York City specifically, office investment volume rose to 11 billion dollars in 2025, up 30 percent, with JLL's Andrew Scandalios and Drew Isaacson both crediting the return of private capital, foreign investor groups, and institutional players re-engaging with well-leased assets in proven submarkets (source: Commercial Observer, "Investment in New York City Office Assets Grew to 11B in 2025," January 20, 2026). This pattern is consistent with the historical role of gateway cities as a store of value for global capital: liquidity and international demand can offset, though not eliminate, the effect of higher domestic financing costs, because a portion of the buyer pool is less dependent on US bank and agency debt in the first place.
Section 06Necessity-based retail as ballast
Grocery-anchored and necessity-based retail has behaved as one of the more rate-resilient categories through 2026, largely because of structural undersupply rather than any special immunity to financing costs. CBRE's H1 2026 Cap Rate Survey found retail cap rates broadly expected to compress 5 to 15 basis points, with grocery-anchored and other neighborhood centers showing the strongest pricing resilience within retail, a result CBRE attributed to consistent foot traffic, necessity-based tenants, and near-historic low vacancy rates that continue to limit new supply (source: CBRE, "US Cap Rate Survey H1 2026," reported via LinkedIn by Rudy Milian, August 16, 2026). JLL's Grocery Tracker 2026 put the vacancy rate for grocery-anchored centers at 4.0 percent versus 6.3 percent for non-anchored centers, with grocery-anchored transaction volume up 42 percent in 2025 to nearly 11 billion dollars and institutional buyers' share of acquisitions rising to 27 percent, the highest level in more than a decade (source: JLL, "Grocery Tracker 2026: Who's Winning the Aisle Wars," February 26, 2026). The mechanism is straightforward: grocery spending has structurally low e-commerce penetration, tenants sign leases that commonly run close to twenty years with credit-anchored rent rolls, and construction costs combined with tight financing have kept new retail deliveries near historic lows, all of which support valuations independent of the direction of the policy rate.
Section 07Short-lease assets that reprice fastest
A separate, and sometimes overlooked, form of insulation comes from lease duration rather than location: assets that can reset income to prevailing market rates quickly can, at least on the income side, offset rising capital costs faster than assets locked into long fixed leases. Heitman's April 2026 sponsor report on self storage describes the sector's short lease terms, typically month to month, and inflation-indexed escalations as key reasons storage delivered the second highest annualized total return of any property type from the first quarter of 2020 through the second quarter of 2025, behind only industrial (source: Heitman, "Self-Storage: A Resilient Sector at a Strategic Entry Point," April 2026). Hotels reset even faster, on a nightly basis, which analysis compiled by Baker 1031 characterizes as the fastest inflation pass-through mechanism among real estate sectors, though the same short duration also makes hotel revenue more directly exposed to demand cyclicality than storage or apartments (source: Baker 1031, "Which REIT Sectors Best Hedge Inflation," 2026). This dynamic matters specifically for a rate-hike scenario because rising rates are often, though not always, accompanied by the inflationary pressure that originally prompted the tightening; assets that can reprice income within a year, a quarter, or a night have more tools available to keep net operating income growing even while capitalization rates for the asset class as a whole are under pressure from higher financing costs.
Section 08Reading the map with discipline
None of this is a forecast that rates will rise, and the sources above are explicit that a hold, not a hike, remains the base case heading into the September 2026 FOMC meeting. What the data does support is a reasonably consistent pattern in how a further move higher in rates would likely be absorbed unevenly across US real estate: recent-vintage, high-leverage multifamily in oversupplied Sun Belt and Mountain markets, along with lower-tier office already carrying elevated vacancy, appear most exposed to further cap rate expansion and refinancing stress. Gateway markets with deep institutional and international capital pools, necessity-based retail supported by structural undersupply, and short-lease asset classes able to reprice income quickly all show characteristics of relative insulation, though none is rate-proof. The table below summarizes the attributes driving that divide, each tied to the named source above.
| Attribute | Detail | Named Source |
|---|---|---|
| Most rate-sensitive: Sun Belt multifamily | Negative year over year rent growth in Austin, Denver, and Phoenix; Sun Belt vacancy 6.3% vs 4.1% elsewhere (Q1 2026) | Marcus & Millichap, Multifamily Outlook, May 2026; Yardi Matrix, August 2026 |
| Most rate-sensitive: lower-tier office | National vacancy 18.6% to 20.2%; suburban Midwest Class A cap rates widened to 10% to 12.5% | Cushman & Wakefield, US Office MarketBeat, April 2026; CBRE, US Cap Rate Survey H1 2026, August 2026 |
| More insulated: gateway office and capital markets | US CRE investment volume up 25% YoY in Q1 2026; office investment up 61%; NYC office investment $11B in 2025 with foreign capital re-engaging | JLL, US Commercial Real Estate Investment Activity Expands, May 2026; Commercial Observer, January 2026 |
| More insulated: necessity-based retail | Grocery-anchored vacancy 4.0% vs 6.3% for non-anchored; institutional acquisition share at a decade high of 27% | JLL, Grocery Tracker 2026, February 2026; CBRE, US Cap Rate Survey H1 2026, August 2026 |
| More insulated: short-lease assets | Self-storage delivered the second highest annualized total return of any property type, 2020 to 2025, behind industrial; month-to-month and nightly leases allow faster repricing | Heitman, Self-Storage Sponsor Report, April 2026 |
| Policy backdrop | Fed funds held at 3.50% to 3.75% since December 2025; July 2026 vote 9-3 with three dissenters favoring a hike; base-case forecast is a hold through year end 2026 | Global Markets Review, August 2026; Mortgage Bankers Association forecast via Scotsman Guide, August 2026 |
Investors weighing exposure to any one of these categories should treat this as a starting framework for questions to ask, not a substitute for underwriting a specific asset, sponsor, and capital stack. Vintage, leverage, submarket supply pipeline, and lease structure all matter more than broad property type labels, and the same forecasters cited throughout this piece continue to revise their rate outlook as new inflation and employment data arrive.