In brief · summary: Albuquerque
Albuquerque is a high desert Southwestern market anchored by an unusually deep base of federal, laboratory, military, and university employment, and its real estate profile in 2026 is one of stability and affordability rather than rapid growth. The city proper is home to 556,588 residents as of July 1, 2025 according to the US Census Bureau, at the center of a metropolitan area whose economy is dominated by government, national laboratories, and health care.
This institutional base gives Albuquerque a defensive quality that few Sun Belt markets can match, but it also caps the market's growth potential. The investment picture is defined by supply discipline meeting soft demand.
On the multifamily side, Yardi Matrix reported average advertised asking rents of $1,365 as of February 2026, down 0.9% year over year, with stabilized occupancy of 94.3%, a tighter figure than the national market. Apartment fundamentals softened in 2025 as the market absorbed a decade high 2,155 units of new supply, but occupancy near 94% remains far healthier than the roughly 8.5% national vacancy CoStar reported. On the ownership side, homes remain affordable and appreciating, with Redfin reporting a median sale price of $360,000 for the three months ending June 2026, up 2.8% from a year earlier and well below the national …
Section 01Executive Summary
Albuquerque is a high desert Southwestern market anchored by an unusually deep base of federal, laboratory, military, and university employment, and its real estate profile in 2026 is one of stability and affordability rather than rapid growth. The city proper is home to 556,588 residents as of July 1, 2025 according to the US Census Bureau, at the center of a metropolitan area whose economy is dominated by government, national laboratories, and health care. This institutional base gives Albuquerque a defensive quality that few Sun Belt markets can match, but it also caps the market's growth potential.
The investment picture is defined by supply discipline meeting soft demand. On the multifamily side, Yardi Matrix reported average advertised asking rents of $1,365 as of February 2026, down 0.9% year over year, with stabilized occupancy of 94.3%, a tighter figure than the national market. Apartment fundamentals softened in 2025 as the market absorbed a decade high 2,155 units of new supply, but occupancy near 94% remains far healthier than the roughly 8.5% national vacancy CoStar reported. On the ownership side, homes remain affordable and appreciating, with Redfin reporting a median sale price of $360,000 for the three months ending June 2026, up 2.8% from a year earlier and well below the national median of $408,776.
The core educational takeaway for an accredited investor is that Albuquerque offers a defensive, affordable, institutionally anchored market with tight apartment occupancy and moderate property taxes, offset by weak population growth, a recent supply wave, and an economy heavily dependent on federal spending. What follows details each figure with its named source and scope.
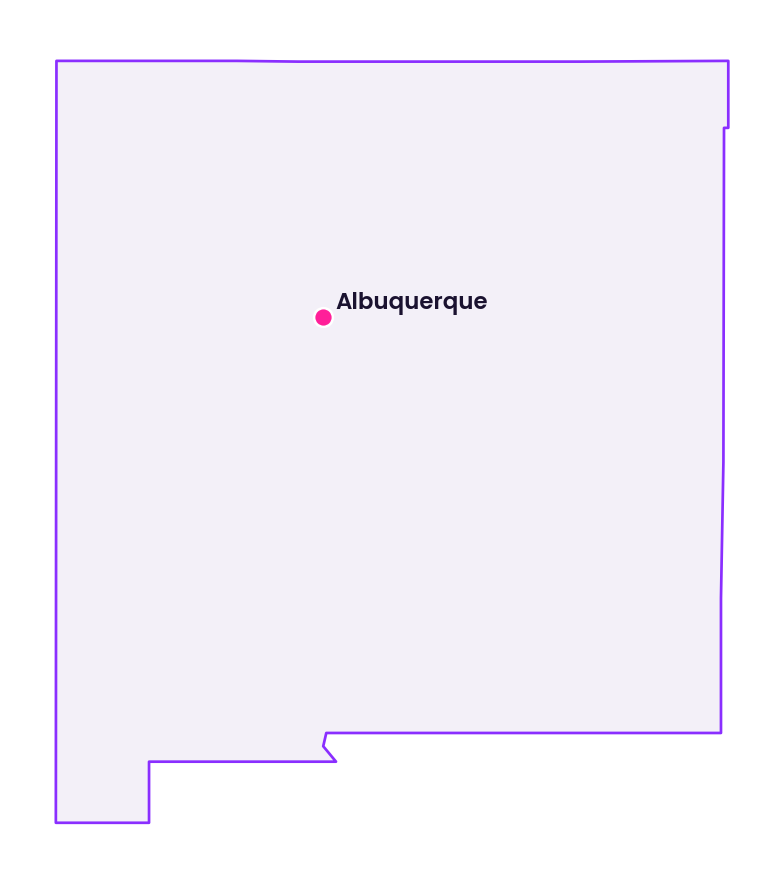
Section 02Population and Migration
Albuquerque's population is essentially flat, a structural characteristic that shapes the entire investment thesis. The Census Bureau estimated the city at 556,588 residents as of July 1, 2025, down 1.4% from the April 2020 base of 564,559, though the city had grown modestly from 545,852 in 2010. The metro anchors north central New Mexico and includes Rio Rancho, the state's fastest growing city, and Bernalillo, Sandoval, Valencia, and Torrance counties. The city has 243,733 households at 2.27 persons per household and an older age profile, with 17.7% of residents aged 65 and over.
| Measure | Value | Period and source |
|---|---|---|
| City population | 556,588 | July 1, 2025 estimate, US Census Bureau |
| City population, 2020 census | 564,559 | April 1, 2020, US Census Bureau |
| City population, 2010 census | 545,852 | April 1, 2010, US Census Bureau |
| City change, 2020 to 2025 | -1.4% | US Census Bureau |
| Households | 243,733 | 2020 to 2024 ACS, US Census Bureau |
| Persons per household | 2.27 | 2020 to 2024 ACS, US Census Bureau |
| Persons 65 years and over | 17.7% | 2020 to 2024 ACS, US Census Bureau |
Albuquerque is a majority minority city with a deep Hispanic heritage and a reasonably well educated adult population supported by the University of New Mexico and the national laboratories, as the following measures from the 2020 to 2024 American Community Survey show, and the composition reflects the region's Indigenous and Spanish colonial history.
| Demographic measure | Value | Period and source |
|---|---|---|
| Hispanic or Latino | 47.7% | 2020 to 2024 ACS, US Census Bureau |
| White alone, not Hispanic | 37.5% | 2020 to 2024 ACS, US Census Bureau |
| American Indian and Alaska Native | 5.0% | 2020 to 2024 ACS, US Census Bureau |
| Bachelor's degree or higher, age 25 and over | 39.2% | 2020 to 2024 ACS, US Census Bureau |
Migration into the metro has been modest, driven by relative affordability and the region's climate and cultural appeal, but it has not been strong enough to produce meaningful population growth. For an investor, the population data is the central caution: Albuquerque is a slow growth market where housing demand depends on holding existing residents and on the stability of its institutional employers rather than on the demographic expansion that drives Sun Belt appreciation.
Section 03Jobs and Economic Anchors
Albuquerque's economy is anchored to an exceptional degree by government, national laboratories, and defense, which gives it stability but also ties its fortunes to federal spending. The US Bureau of Labor Statistics reported total nonfarm employment for the Albuquerque metropolitan area at 416,000 in July 2026 on a preliminary basis, roughly flat year over year at up 0.1%, with an unemployment rate of 4.9% for June 2026, not seasonally adjusted, and a civilian labor force of roughly 450,800, data extracted August 28, 2026. Yardi Matrix noted stronger performance in 2025, with employment growth of 1.2% outpacing the national 0.6% and the metro adding 1,700 net jobs, before the softening evident in the 2026 data.
| Sector | Jobs (thousands) | Source and period |
|---|---|---|
| Government | 80.8 | BLS, June 2026 |
| Education and Health Services | 76.0 | BLS, June 2026 |
| Trade, Transportation and Utilities | 69.2 | BLS, June 2026 |
| Professional and Business Services | 62.4 | BLS, June 2026 |
| Leisure and Hospitality | 47.3 | BLS, June 2026 |
| Mining, Logging and Construction | 26.8 | BLS, June 2026 |
| Financial Activities | 20.1 | BLS, June 2026 |
| Manufacturing | 16.4 | BLS, June 2026 |
| Other Services | 14.0 | BLS, June 2026 |
| Information | 5.9 | BLS, June 2026 |
The defining feature is government at 80,800 jobs, the single largest sector and a far higher share than the national norm, encompassing Sandia National Laboratories, Kirtland Air Force Base, the University of New Mexico, Albuquerque Public Schools, and city, county, and state government. This concentration is the source of Albuquerque's stability, since laboratory, military, and university employment does not fluctuate with the business cycle the way private industry does. Education and health services, the second largest sector at 76,000, grew a strong 4.8% year over year, led by Presbyterian Healthcare Services, the largest private employer in New Mexico. The weak spot is professional and business services, down 6.7% year over year, a category that includes laboratory contractors and is sensitive to federal contract cycles, while information rose 7.3%, aided by the film and media sector including the Netflix production hub at ABQ Studios.
Manufacturing is small at 16,400 but strategically important, anchored by the Intel semiconductor fabrication complex in nearby Rio Rancho, which has undertaken major investment. Data center and logistics investment has grown, with a Meta data center in Los Lunas and Amazon and Walmart distribution operations driving industrial demand. For an investor, the employment base is a genuine strength in its stability and a genuine limitation in its dependence on federal spending, which introduces political and budgetary risk that private sector markets do not face.
Section 04Income
Incomes in Albuquerque are moderate, supported by the well paid laboratory and professional workforce but held down by a large lower wage service sector and a relatively high poverty rate. The Census Bureau reported a median household income for the city of $68,317 in 2024 dollars for the 2020 to 2024 period, with per capita income of $40,469 and a poverty rate of 15.5%.
| Measure | Value | Period and source |
|---|---|---|
| Median household income | $68,317 | 2020 to 2024 ACS, US Census Bureau |
| Per capita income | $40,469 | 2020 to 2024 ACS, US Census Bureau |
| Persons in poverty | 15.5% | 2020 to 2024 ACS, US Census Bureau |
| Median gross rent | $1,145 | 2020 to 2024 ACS, US Census Bureau |
The relationship between income and housing cost is favorable, which is central to Albuquerque's appeal. With a city median household income of $68,317 and a median gross rent of $1,145, annualized rent of roughly $13,740 represents about 20% of median household income, a comfortable ratio that supports rent stability and leaves room for measured rent growth. The metro's average apartment rent of $1,365 reported by Yardi Matrix, well below the national average of $1,740, reinforces that Albuquerque is a genuinely affordable market. For an investor, the income data supports a stable, workforce oriented rental thesis: incomes are sufficient to support current rents without the affordability stress seen in expensive coastal and Sun Belt markets, and the presence of a well paid laboratory and professional class supports demand for higher tier product.
Section 05Housing and Multifamily
The Albuquerque apartment market softened in 2025 and early 2026 as it absorbed an unusually large supply wave, but it remains fundamentally tight relative to the national market. Yardi Matrix reported average advertised asking rents of $1,365 as of February 2026, down 0.4% on a trailing three month basis and down 0.9% year over year, while stabilized occupancy slipped 30 basis points year over year to 94.3%. Colliers reported similar conditions, with occupancy of 94.9% in the first quarter of 2026 and same store effective asking rents for new leases down 2.3% year over year, well below the market's five year average of 6.3% growth.
| Metric | Value | Source and period |
|---|---|---|
| Average advertised asking rent | $1,365 | Yardi Matrix, February 2026 |
| Asking rent, year over year | -0.9% | Yardi Matrix, February 2026 |
| Stabilized occupancy | 94.3% | Yardi Matrix, February 2026 |
| Occupancy | 94.9% | Colliers, Q1 2026 |
| Units under construction | 2,581 | Yardi Matrix, February 2026 |
The essential point is that even at its softest, Albuquerque occupancy near 94% is far healthier than the roughly 8.5% national vacancy that CoStar reported, implying local vacancy near 5% to 6%. The softness is a temporary consequence of the supply wave rather than a demand failure, and the market's affordability and stable employment base provide a floor. CoStar noted that the market was gearing up for another wave of construction in 2026 that could push vacancy higher and keep rent growth muted in the near term. For an investor, Albuquerque offers a tight, defensive apartment market experiencing a temporary supply driven soft patch, a setup that can reward patient capital acquiring at a cyclical low point in rent growth.
Section 06Rents
Albuquerque rents are affordable and, after several years of strong gains, have paused. Average advertised asking rent stood at $1,365 as of February 2026 per Yardi Matrix, roughly 22% below the national average of $1,740, and rents declined modestly over the prior year after a period of rapid growth. Colliers noted that the market's five year average rent growth was a strong 6.3%, underscoring that the recent softness follows an unusually strong run rather than reflecting chronic weakness, and ranked Albuquerque's recent rent performance twentieth in the West region and eighty third nationally.
| Rent benchmark | Value | Source and period |
|---|---|---|
| Albuquerque average asking rent | $1,365 | Yardi Matrix, February 2026 |
| Albuquerque asking rent, year over year | -0.9% | Yardi Matrix, February 2026 |
| Albuquerque effective rent, new leases | -2.3% | Colliers, Q1 2026 |
| Albuquerque five year average rent growth | +6.3% | Colliers, Q1 2026 |
| National average asking rent | $1,740 | Yardi Matrix, February 2026 |
The comparison shows a market that is both affordable and cyclically paused. The modest rent declines of roughly 1% to 2% reflect the temporary supply surge rather than deteriorating demand, and the strong five year average of 6.3% demonstrates the market's underlying pricing power once supply normalizes. The 20% affordability gap to the national average gives Albuquerque renters substantial capacity to absorb future increases. For an investor, the rent data supports a recovery thesis: the current pause is a supply timing phenomenon, and a market with 6.3% five year average rent growth, tight occupancy, and strong affordability is positioned to resume rent growth once the pipeline clears, making the current soft patch a potential entry opportunity.
Section 07Vacancy
Vacancy in Albuquerque rose modestly through 2025 and early 2026 under the weight of new supply but remained low by national standards, a testament to the market's stable demand. Stabilized occupancy of 94.3% reported by Yardi Matrix for February 2026, and 94.9% reported by Colliers for the first quarter of 2026, imply vacancy in the range of roughly 5% to 6%, well below the national multifamily vacancy that CoStar reported near 8.5% at the end of 2025. The year over year decline in occupancy of 30 to 50 basis points reflects the supply wave rather than any collapse in demand.
The key insight is that Albuquerque did not overbuild to the degree that many Sun Belt markets did, so its vacancy never approached distress levels even at the peak of its supply cycle. The metro's tight occupancy is a function of its stable institutional employment base, its affordability, and historically constrained development. Looking forward, CoStar cautioned that another construction wave in 2026 could push vacancy somewhat higher in the near term, but the structural picture of low vacancy relative to the nation is likely to persist. For an investor, the vacancy data is among the market's most attractive features: Albuquerque offers occupancy stability that is rare among affordable markets, and the modest recent softening is a cyclical rather than structural phenomenon.
Section 08Supply Pipeline
Supply is the proximate cause of the current apartment softness, and the pipeline is elevated by Albuquerque's own historical standards even if modest in absolute terms. Deliveries reached a decade high of 2,155 units in 2025, and Yardi Matrix reported 2,581 units under construction as of February 2026, while Colliers recorded 683 units delivered in the first quarter of 2026 alone. For a market of Albuquerque's size and slow population growth, this represents a meaningful supply pulse that the market is working to absorb.
| Supply metric | Value | Source and period |
|---|---|---|
| Units delivered | 2,155 | Yardi Matrix, 2025 |
| Units under construction | 2,581 | Yardi Matrix, February 2026 |
| Units delivered | 683 | Colliers, Q1 2026 |
The data describes a market digesting an unusually large supply wave for its size, which explains the modest rent declines and occupancy softening. The critical question is whether demand, constrained by slow population growth, can absorb the new units, and the evidence of occupancy holding near 94% suggests it largely can, aided by affordability that attracts renters and by the stability of the employment base. CoStar's caution about a further construction wave in 2026 means supply pressure may persist in the near term, but Albuquerque's high barriers to development, including limited water resources and a slow growth entitlement environment, structurally constrain how much can be built over the long run. For an investor, the supply picture is the primary near term risk but not a structural concern, and the eventual normalization of the pipeline is the basis for the rent recovery thesis.
Section 09Single Family Homes
The for sale housing market in Albuquerque is affordable and steadily appreciating, a favorable contrast to the softening apartment sector and a reflection of persistent buyer demand meeting limited supply. Redfin reported a median sale price of $360,000 for the three months ending June 2026, up 2.8% year over year, with price per square foot of $212, up 0.5%. Albuquerque's median price sits well below the national median of $408,776 that Redfin reported for June 2026, preserving the market's affordability advantage.
| Metric | Value | Source and period |
|---|---|---|
| Median sale price | $360,000 | Redfin, 3 months ending June 2026 |
| Median sale price, year over year | +2.8% | Redfin, 3 months ending June 2026 |
| Median price per square foot | $212 | Redfin, 3 months ending June 2026 |
| Median price per square foot, year over year | +0.5% | Redfin, 3 months ending June 2026 |
| Northeast Albuquerque median price | $385,000 | Redfin, 3 months ending June 2026 |
| National median sale price | $408,776 | Redfin, June 2026 |
The 2.8% price appreciation, occurring even as apartment rents softened, reflects the durability of ownership demand in an affordable market where the median owner occupied home value was $291,500 per the 2020 to 2024 Census and the owner occupancy rate was 61.8%. The single family rental angle is supported by the same affordability and by a 38% renter share, with rents and prices both low enough in absolute terms to produce workable cash flow, a genuine advantage over expensive markets. The desirable Northeast Albuquerque submarket, at a $385,000 median up 5.4% year over year, illustrates the price dispersion across the city's quadrants. For an investor, Albuquerque single family and small multifamily offer a stable, affordable, appreciating market with reasonable price to rent economics, well suited to buy and hold rental strategies rather than to rapid appreciation plays.
Section 10Commercial Real Estate and Retail Centers
Albuquerque commercial real estate reflects the metro's stable but slow growing economy, with office challenged by the national remote work trend, industrial supported by data centers and logistics, and retail relatively tight. Colliers reported metro office vacancy at 14.53% in the third quarter of 2025, an improvement from higher levels but still elevated by significant vacancy in the downtown core, consistent with the national office malaise, though below the national office vacancy that CoStar reported below 14% only after years above it.
| Sector | Vacancy | Source and period |
|---|---|---|
| Office, metro | 14.53% | Colliers, Q3 2025 |
| Retail, metro | 7.01% | Colliers, Q1 2025 |
Office is the most challenged sector, with metro vacancy near 14.53% concentrated in an aging downtown that faces the same structural pressures as central business districts nationally, while suburban and medical office generally performs better. Retail is comparatively healthy, with Colliers reporting metro vacancy of 7.01% in the first quarter of 2025 and retail rents growing around 2.5%, supported by the metro's role as the retail hub for a large portion of New Mexico and by grocery anchored and necessity centers serving established neighborhoods. Industrial is a genuine growth sector, and Colliers reported that industrial vacancy rose 138 basis points in the fourth quarter of 2025 as new supply delivered, while demand remained resilient into 2026, driven by power industrial users including Walmart, the Meta data center operation, and Amazon, along with the logistics advantages of Albuquerque's position on Interstate 40 and Interstate 25. For an investor, industrial and grocery anchored retail are the most attractive commercial sectors, while downtown office carries the structural challenges seen nationally.
Section 11Transactions and Capital Markets
Multifamily investment activity in Albuquerque was exceptionally thin in late 2025 and early 2026, reflecting the national repricing and the local rent softness. Yardi Matrix reported that no multifamily transactions were recorded through February 2026 and that full year 2025 sales volume totaled just $69 million, a very low figure, while the average price per unit rose 26.4% year over year to $181,967, still below the national average of $202,620.
| Metric | Value | Source and period |
|---|---|---|
| Multifamily sales volume | $69 million | Yardi Matrix, 2025 |
| Transactions through February | none recorded | Yardi Matrix, 2026 |
| Average price per unit | $181,967 | Yardi Matrix, 2025 |
| National average price per unit | $202,620 | Yardi Matrix, 2025 |
The data reflects a market in a transaction freeze, common across the country as buyers and sellers adjusted to higher interest rates and softer rent growth. The very low $69 million in 2025 volume and the absence of trades through early 2026 indicate limited price discovery, though the 26.4% rise in average price per unit to $181,967 suggests that the assets that did trade were of higher quality or that pricing held up better than transaction counts imply. The Albuquerque per unit price remains below the national average, consistent with the market's affordability and higher going in yields.
Section 12Taxes
Property taxes in Albuquerque are moderate and were reduced in 2025, a favorable feature supported by New Mexico's assessment structure. New Mexico assesses property at one third of market value, and Bernalillo County applies a residential property tax cap that limits the annual increase in assessed value to a maximum of 3% after the first year of ownership, which protects owners from rapid tax increases as values rise. For tax year 2025, the New Mexico Department of Finance and Administration certified the mill levies for Bernalillo County taxing districts.
| Tax district | Total mill levy (tax year 2025) | Source |
|---|---|---|
| Albuquerque city, residential | 48.323 mills | NM Department of Finance and Administration |
| Albuquerque city, non residential | 53.462 mills | NM Department of Finance and Administration |
Applied to assessed value at one third of market value, these mill levies translate into a moderate effective burden on market value, and importantly the rates declined in 2025 for the second consecutive year, with the Bernalillo County Assessor reporting a 1.6% reduction in the residential mill rate and a 4.5% reduction for commercial property. The 3% annual cap on assessed value growth for residential property is a meaningful protection for long term owners, holding taxable values below market during periods of appreciation, though it does not apply upon a change of ownership. The mill levies fund a wide range of entities, including the state, county, city, Albuquerque Public Schools, the University of New Mexico Hospital, and the community college. For an investor, the property tax environment is a genuine positive: rates are moderate, they are declining, and the assessment cap provides predictability, all of which support net operating income and partially offset the market's slow growth profile.
Section 13Insurance
Property insurance in Albuquerque is comparatively affordable relative to catastrophe exposed coastal and wildfire prone markets, though wildfire risk in the broader region has become a growing concern. New Mexico faces no hurricane or coastal flood risk, and the Albuquerque metro itself, situated in a high desert basin, has limited exposure to the perils that drive extreme premiums elsewhere. Home insurance costs in New Mexico have historically been below the national average, a favorable feature for both homeowners and rental property investors.
The important qualification is wildfire, which has become a rising risk across New Mexico following the 2022 Hermits Peak and Calf Canyon fire, the largest in state history, which burned in the mountains north of Albuquerque. While the urban core of Albuquerque sits in the desert basin with low wildfire exposure, the forested East Mountains and the wildland urban interface areas around the metro carry meaningful and increasing wildfire risk, which is beginning to affect insurance availability and cost in those specific areas. For an investor, the insurance conclusion is favorable for properties in the urban basin, where costs remain moderate, but wildfire exposure should be assessed carefully for any property in or near the wildland urban interface, and the broader trend of rising insurance costs nationally warrants verification of current quotes rather than reliance on historical norms.
Section 14Landlord Tenant and Regulatory Environment
New Mexico is a moderately landlord favorable state, and its framework supports rental investment in Albuquerque without the tenant protections that constrain owners in some other states. The state operates under the New Mexico Uniform Owner Resident Relations Act, which provides a defined process for leases, security deposits, and eviction. New Mexico has no statewide rent control, and state law generally preempts local rent regulation, so rents are set by the market, a structural protection for rental income. Eviction procedures are defined by statute and are reasonably efficient by national standards, though owners must follow the required notice and court process.
The regulatory environment on the development side reflects New Mexico's slow growth character and its water constraints, with entitlement and permitting processes that are not unusually burdensome but that operate in a context of limited water availability, which structurally constrains large scale development. Short term rental regulation exists at the municipal level in Albuquerque, which requires permits and imposes rules on vacation rentals, a consideration for investors pursuing that strategy given the city's tourism appeal, though it is a minor factor in a market driven by long term rental demand. The overall regulatory read is favorable for conventional rental investment, with no rent control and efficient enforcement, and moderately constrained on the development side by water and slow growth dynamics. Investors should confirm current city short term rental and rental licensing requirements before underwriting any specific strategy.
Section 15Infrastructure
Albuquerque possesses solid transportation infrastructure and a strategic logistics position, though its defining infrastructure constraint is water. The metro sits at the crossroads of Interstate 40, the major east and west route across the Southwest, and Interstate 25, the primary north and south corridor, giving it strong highway connectivity and supporting its growing logistics and distribution sector. The Albuquerque International Sunport provides commercial air service, and the region benefits from rail connectivity and the presence of major institutional infrastructure at Kirtland Air Force Base and Sandia National Laboratories.
The paramount infrastructure reality is water. Albuquerque sits in an arid high desert environment and depends on a combination of Rio Grande surface water, delivered in part through the San Juan Chama diversion project, and groundwater from the underlying aquifer, both of which are finite and stressed by drought and by long term climate trends. The Albuquerque Bernalillo County Water Utility Authority manages supply and has invested in conservation and aquifer recharge, and water availability is a genuine constraint on the pace and location of new development. The presence of the Middle Rio Grande Conservancy District and the Albuquerque Metropolitan Arroyo Flood Control Authority in the property tax rolls reflects the region's active management of both water delivery and flash flood control in the arroyos. For a real estate investor, the infrastructure picture is favorable on transportation but centered on water as the long term variable that most constrains growth and warrants ongoing attention, particularly given the aridification of the Southwest.
Section 16Climate and Physical Risks
Albuquerque's physical risk profile is dominated by aridity, heat, and water scarcity rather than by the flood, hurricane, and severe storm risks that affect other regions. The high desert climate brings hot, dry summers with intensifying extreme heat, and the paramount long term risk is water supply, as the Rio Grande and the regional aquifer face pressure from prolonged drought and from the broader aridification of the Southwest. This water constraint is both an environmental risk and a structural limit on development, and it is the single most important physical variable for the region's long term real estate prospects.
Wildfire is a secondary but rising risk, concentrated in the forested mountains and the wildland urban interface around the metro rather than in the desert basin where most of the city sits, as demonstrated by the record 2022 fire season in northern New Mexico. Flash flooding in arroyos during summer monsoon storms is a localized risk that the region manages through an extensive flood control system, but riverine and coastal flood risk of the kind that affects other markets is minimal. Extreme heat is an intensifying chronic risk that raises cooling costs and stresses building systems and water resources. For an investor, the climate conclusion is that Albuquerque avoids the catastrophic hurricane and flood tail risks of coastal markets and the extreme wildfire risk of some western markets within its urban core, but that water scarcity is a genuine long term constraint and heat is an intensifying chronic cost, both of which should inform long horizon underwriting.
Section 17Neighborhoods and Submarkets
Albuquerque is conventionally understood through its four quadrants, divided by the intersection of Central Avenue, the historic Route 66, and the railroad tracks, along with the affluent foothills and the growing suburbs. The Northeast Heights, rising toward the Sandia Mountains, is the largest and generally most affluent quadrant, and Redfin reported a Northeast Albuquerque median sale price of $385,000 for the three months ending June 2026, up 5.4% year over year, above the citywide median and reflecting strong demand for its schools, views, and newer housing stock.
The other quadrants and the broader metro offer distinct profiles. The North Valley and the foothills contain the city's highest value historic and custom homes, while the Southeast and the South Valley are more affordable and working class, and the downtown and university areas offer urban rental product. Beyond the city, Rio Rancho in Sandoval County is the metro's fast growing suburban frontier, home to the Intel complex and much of the region's new single family construction, while the East Mountains offer rural and wildland interface living with associated wildfire exposure. The multifamily submarkets broadly track this geography, with newer, higher rent product concentrated in the Northeast Heights and the growing northwest suburbs, and older, more affordable stock in the central and southeast areas. For an investor, the practical conclusion is that submarket selection in Albuquerque is a function of quadrant, school quality, and proximity to the employment centers of the laboratories, the base, and the universities, with the Northeast Heights and Rio Rancho offering growth and quality at higher entry prices and the central and southeast areas offering affordability and higher yields.
Section 18Opportunities
The clearest opportunity in Albuquerque is countercyclical multifamily acquisition during the current supply driven soft patch, in a market whose occupancy near 94% remains far tighter than the national average and whose five year average rent growth of 6.3% demonstrates genuine pricing power. With rents temporarily flat to down, transactions frozen, and per unit pricing below the national average, patient capital can enter an affordable, stable market ahead of the rent recovery that should follow once the supply pipeline clears, capturing higher going in yields than growth markets offer.
A second opportunity is single family rental and small multifamily, where an affordable median home price of $360,000 and low rents produce workable cash flow, supported by steady 2.8% price appreciation and a stable renter base. A third opportunity is industrial and logistics exposure, driven by data center investment from Meta, distribution demand from Amazon and Walmart, and the metro's position at the crossroads of two interstates. A fourth is the defensive quality of the institutional economy itself, where laboratory, military, university, and health care employment provides recession resistant demand that few markets can match. Underpinning these is a favorable and declining property tax environment with a 3% assessment cap, and moderate insurance costs in the urban core.
Section 19Risks
The most significant structural risk is slow population and economic growth. The city lost 1.4% of its population since 2020, metro employment was roughly flat in mid 2026, and the market lacks the demographic engine that drives appreciation elsewhere, which caps rent and price growth potential. The second major risk is dependence on federal spending, since government at 80,800 jobs is the largest sector and encompasses the laboratories, the air force base, and public institutions, making the economy vulnerable to federal budget cuts, and the 6.7% year over year decline in professional and business services, which includes laboratory contractors, illustrates that sensitivity.
The third risk is the near term supply wave, with a decade high 2,155 units delivered in 2025 and 2,581 under construction, which has softened rents and occupancy and could pressure fundamentals further if the additional 2026 construction CoStar flagged proceeds. Additional risks include the region's water scarcity, which is both an environmental risk and a long term constraint on growth; rising wildfire risk in the wildland urban interface; intensifying extreme heat; and the thin transaction market that complicates price discovery and exit. Property tax and insurance risks are comparatively low, genuine offsets. None of these is disqualifying, but together they define Albuquerque as a stable, low growth market rather than a high return one.
Section 20Investor Implications
For an accredited investor, Albuquerque is a defensive, affordable, income oriented market that rewards a stability and yield mindset rather than an appreciation mindset. The attractive elements are real: apartment occupancy near 94% that is far tighter than the national average, genuine affordability with rents 22% below the national average, a stable institutional economy anchored by the national laboratories and health care, moderate and declining property taxes, and moderate insurance costs in the urban core. The offsetting challenges are equally real and are dominated by slow population and economic growth, dependence on federal spending, a near term supply wave, and long term water constraints.
The strategies the data most supports are countercyclical multifamily acquisition ahead of the rent recovery, single family and small multifamily rental where affordability produces workable cash flow, and industrial exposure tied to data center and logistics growth. Underwriting should focus on the pace at which the supply pipeline clears and rents recover, the stability of federal funding for the laboratories and the base that anchor the economy, the long term water supply picture, and wildfire exposure for any property near the wildland urban interface. Albuquerque rewards investors who value the defensive stability and yield of an institutionally anchored market and who do not require the rapid growth of Sun Belt peers, and who treat the current apartment softness as a cyclical entry opportunity rather than a structural warning.
Section 21Conclusion
Albuquerque is a stable, affordable, high desert market whose real estate is anchored by an exceptional base of federal, laboratory, military, and university employment. The apartment market is working through a decade high supply wave that has temporarily softened rents, yet occupancy near 94% remains far healthier than the national market, and a five year average rent growth of 6.3% points to a recovery once the pipeline clears. Homes remain affordable and appreciating at a $360,000 median, well below the national level, and property taxes are moderate and declining. Beneath these dynamics sits a slow growth demographic and economic profile, a dependence on federal spending, and a defining long term constraint in water scarcity. For the accredited investor, Albuquerque is best understood not as a simple yes or no but as a defensive, yield oriented market where the current apartment soft patch offers a cyclical entry point, where the institutional economy provides genuine stability, and where honest attention to growth limits, federal funding risk, and water will separate sound results from disappointment. Every figure in this review carries a named public source and an explicit scope so that the reader can verify it independently.
Sources
- US Census Bureau, QuickFacts, Albuquerque city, New Mexico, population, income, housing, and demographic figures, retrieved August 31, 2026, https://www.census.gov/quickfacts/fact/table/albuquerquecitynewmexico/PST045225
- US Bureau of Labor Statistics, Albuquerque NM Economy at a Glance, labor force, unemployment, and nonfarm employment by sector, data extracted August 28, 2026, https://www.bls.gov/eag/eag.nm_albuquerque_msa.htm
- Yardi Matrix, Albuquerque Multifamily Market Report April 2026, asking rents, occupancy, supply, and investment, data as of February 2026, https://www.yardimatrix.com/blog/albuquerque-multifamily-market-report/
- Colliers, Q1 2026 Albuquerque Multifamily Market Report, occupancy, effective rent, and deliveries, https://www.colliers.com/en/research/new-mexico/q1-2026-albuquerque-multifamily-market-report
- CoStar, Albuquerque apartment market faces new challenges, construction outlook, https://www.costar.com/article/909071013/albuquerques-apartment-market-faces-new-challenges
- CoStar, Apartments.com and CoStar multifamily forecast, national vacancy near 8.5%, https://investors.costargroup.com/news-releases/news-release-details/apartmentscom-and-costar-raise-near-term-us-multifamily-rent
- Redfin, Albuquerque NM Housing Market, median sale price and price per square foot, three months ending June 2026, https://www.redfin.com/city/513/NM/Albuquerque/housing-market
- Colliers, Q3 2025 Albuquerque Office Market Report, metro office vacancy 14.53 percent, https://www.colliers.com/en/research/new-mexico/q3-2025-albuquerque-office-market-report
- Colliers, Q1 2025 Albuquerque Retail Market Report, metro retail vacancy 7.01 percent, https://www.colliers.com/en/research/new-mexico/q1-2025-albuquerque-retail-market-report
- Colliers, Q4 2025 Albuquerque Industrial Market Report, industrial vacancy change and demand drivers, https://www.colliers.com/en/research/new-mexico/q4-2025-albuquerque-industrial-market-report
- New Mexico Department of Finance and Administration, Certificate of Property Tax Rates in Mills, Bernalillo County Tax Year 2025, https://www.nmdfa.state.nm.us/wp-content/uploads/2026/05/Bernalillo-County-2025-rev-Sept-19-2025.pdf
- Greater Albuquerque Association of Realtors, Bernalillo County residential property owners may see tax decrease, mill rate reductions for 2025, https://www.gaar.com/blog/article/bernco-residential-property-owners-may-see-tax-decrease
- Bernalillo County Treasurer, property tax and the 3 percent residential value cap, https://www.bernco.gov/blog/2025/10/01/bernalillo-county-treasurer-says-to-know-your-tax-bill/