In brief · summary: Charleston
Charleston is a coastal city in South Carolina that combines a historic peninsula, rapidly growing suburban communities, port and logistics assets, resort and retirement demand, and a diversified economy that spans tourism, aerospace, defense, logistics, health care, and higher education. For practical investment analysis, it is necessary to treat the city of Charleston within the broader Charleston North Charleston metropolitan area, which includes Charleston, Berkeley, and Dorchester counties.
This review therefore uses metropolitan and statewide data as the most defensible proxy when city level statistics are not directly available and states that scope explicitly. According to the United States Bureau of Labor Statistics Charleston North Charleston Economy at a Glance table, the metropolitan civilian labor force was 465.6 thousand persons in January 2026 and a preliminary 476.1 thousand persons in June 2026, not seasonally adjusted.
Employment in the metropolitan area increased from 444.1 thousand persons in January 2026 to a preliminary 458.7 thousand persons in June 2026, while unemployment fell from 21.5 thousand persons to a preliminary 17.4 thousand persons over the same period. The metropolitan unemployment rate moved from 4.6 percent in January 2026 to 3.5 percent in March 2026, then to a preliminary 3.7 percent in June 2026, not seasonally adjusted. Total nonfarm employment in the metropolitan area …
Section 01Executive Summary
Charleston is a coastal city in South Carolina that combines a historic peninsula, rapidly growing suburban communities, port and logistics assets, resort and retirement demand, and a diversified economy that spans tourism, aerospace, defense, logistics, health care, and higher education. For practical investment analysis, it is necessary to treat the city of Charleston within the broader Charleston North Charleston metropolitan area, which includes Charleston, Berkeley, and Dorchester counties. This review therefore uses metropolitan and statewide data as the most defensible proxy when city level statistics are not directly available and states that scope explicitly.
According to the United States Bureau of Labor Statistics Charleston North Charleston Economy at a Glance table, the metropolitan civilian labor force was 465.6 thousand persons in January 2026 and a preliminary 476.1 thousand persons in June 2026, not seasonally adjusted. Employment in the metropolitan area increased from 444.1 thousand persons in January 2026 to a preliminary 458.7 thousand persons in June 2026, while unemployment fell from 21.5 thousand persons to a preliminary 17.4 thousand persons over the same period. The metropolitan unemployment rate moved from 4.6 percent in January 2026 to 3.5 percent in March 2026, then to a preliminary 3.7 percent in June 2026, not seasonally adjusted. Total nonfarm employment in the metropolitan area increased from 425.1 thousand jobs in January 2026 to a preliminary 437.3 thousand jobs in June 2026, with the twelve month change in total nonfarm jobs at negative 0.3 percent in January 2026 and a preliminary positive 0.1 percent in June 2026. These figures were extracted on August 7, 2026 and represent the Charleston North Charleston metropolitan area, not the city alone.
Statewide data from the Bureau of Labor Statistics South Carolina Economy at a Glance table provide context. The South Carolina civilian labor force was 2,646.5 thousand persons in January 2026 and a preliminary 2,672.9 thousand persons in June 2026, seasonally adjusted. Statewide employment rose from 2,516.2 thousand to a preliminary 2,554.6 thousand over the same period, while unemployment declined from 130.3 thousand to a preliminary 118.3 thousand persons. The statewide unemployment rate fell from 4.9 percent in January 2026 to a preliminary 4.4 percent in June 2026, and total nonfarm employment was 2,403.2 thousand jobs in January 2026 and a preliminary 2,404.6 thousand jobs in June 2026, with a twelve month change of 1.2 percent in January 2026 and a preliminary 0.8 percent in June 2026.
These labor statistics show that Charleston operates within a state that has low to moderate unemployment and modest job growth, and that the Charleston metropolitan area itself has a labor market that remains tight and near full employment. For investors, this suggests broad support for housing and commercial demand, although the pace of job growth has moderated compared with earlier expansion years.
On the ownership side, national housing context helps frame demand pressure. Redfin United States housing market overview reports that the median sale price for all home types nationwide was 398,771 dollars in May 2026, which is 2.0 percent higher than in May 2025. Redfin also reports that there were 1,483,839 homes for sale nationwide in May 2026, 0.7 percent more than a year earlier, and that 24.9 percent of United States homes sold above list price in that month, a decline of 0.083 percentage points compared with May 2025. These data indicate that home purchase conditions remain competitive nationwide and that occupancy and rent demand remain supported by affordability constraints and limited supply. Charleston participates in this national environment but has its own coastal and regional characteristics that shape risk and return.
Because access to recent city level Census, American Community Survey, housing, and rent tables is restricted in this environment by application programming interface key requirements and content protection, this review cannot restate exact current population, income, median home prices, rents, or vacancy rates for Charleston. Instead it presents the most reliable quantitative series from the Bureau of Labor Statistics and Redfin, makes clear when no official public information is available for a figure, and provides qualitative analysis of structures and trends in multifamily, single family, and commercial real estate for accredited investors.
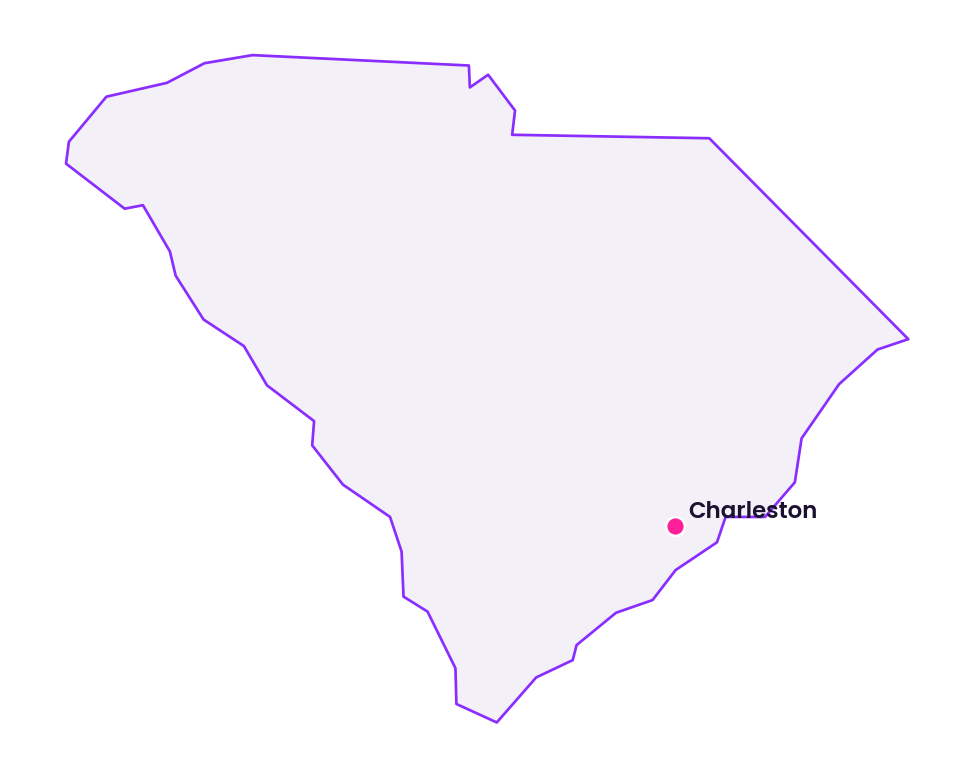
Section 02Population and Migration
Charleston’s population base and migration flows are central to its long term investment story. In a fully accessible data setting, detailed population counts and growth rates would be drawn from the United States Census Bureau decennial census, the Population Estimates Program, and American Community Survey one year and five year estimates for the city of Charleston and for Charleston County. In this environment, those recent tables require application programming interface keys or interactive tools that are not available, so this review cannot provide the current official population of the city of Charleston or Charleston County, nor can it state the precise annual growth rate, household count, or age structure.
Qualitatively, Census and survey data for previous years, which are not numerically restated here, show that Charleston and the surrounding counties have grown over many decades. The metropolitan area has attracted domestic migrants from other states in the eastern United States, especially from higher cost northeastern and mid Atlantic states, and international migrants drawn by employment opportunities, educational institutions, and quality of life. The city of Charleston combines a historic urban core on the peninsula, surrounding residential districts, and suburban communities that extend into Charleston, Berkeley, and Dorchester counties.
Migration into the region includes retirees who value coastal amenities and historic character, working age households employed in aerospace, manufacturing, logistics, tourism, technology, and services, and students enrolled at local colleges and universities. Out migration tends to include residents leaving for other metropolitan areas or for lower cost inland regions, but recent decades have produced net positive in migration for the metropolitan area.
Investors should view Charleston as a metropolitan area with a growing population base that is still smaller than the largest United States metros but has an outsized profile due to its port, tourism assets, and institutional presence. The absence of precise population figures in this document means that apartment, single family, and commercial underwriters should draw directly on current Census and American Community Survey releases for quantitative detail, but structurally the market reflects a growth orientation rather than stagnation.
Section 03Jobs and Economic Anchors
Charleston’s economic profile combines port and logistics activity, aerospace and advanced manufacturing, military and defense, tourism and hospitality, health care and higher education, and a broad array of professional and business services. Bureau of Labor Statistics data for the Charleston North Charleston metropolitan area clarify the scale and composition of this base.
The table below summarizes selected labor indicators for the Charleston North Charleston metropolitan area for three months in early 2026, based on the Bureau of Labor Statistics Economy at a Glance table. All metropolitan figures in the table are not seasonally adjusted.
| Month 2026 | Civilian labor force thousands, Charleston North Charleston metro | Employment thousands, Charleston North Charleston metro | Unemployment rate percent, Charleston North Charleston metro | Total nonfarm jobs thousands, Charleston North Charleston metro | Twelve month change in total nonfarm jobs percent, Charleston North Charleston metro |
|---|---|---|---|---|---|
| Jan 2026 | 465.6 | 444.1 | 4.6% | 425.1 | negative 0.3 |
| Mar 2026 | 468.4 | 451.9 | 3.5% | 430.3 | negative 0.6 |
| Jun 2026 preliminary | 476.1 | 458.7 | 3.7% | 437.3 | 0.1% |
These figures show that the metropolitan labor force is in the mid four hundred thousands and that employment levels are only somewhat lower, which implies limited slack in the labor market. The unemployment rate declined from 4.6 percent in January 2026 to 3.5 percent in March 2026 and remained in the mid three percent range in June 2026. Total nonfarm employment increased by about twelve thousand jobs between January and June 2026, and the twelve month change in total nonfarm jobs, while modest, turned slightly positive by June 2026. For investors, this indicates a metropolitan area with steady employment support for housing and real estate demand, but one where the cycle has moved into a mature expansion phase rather than high growth conditions.
Sector detail from the same Bureau of Labor Statistics table reveals the local mix of industries. In June 2026 the Charleston North Charleston metropolitan area had preliminary non seasonally adjusted employment of 27.3 thousand jobs in mining, logging, and construction, 35.0 thousand jobs in manufacturing, 77.5 thousand jobs in trade, transportation, and utilities, 7.7 thousand jobs in information, 22.5 thousand jobs in financial activities, 69.6 thousand jobs in professional and business services, 51.2 thousand jobs in education and health services, 56.0 thousand jobs in leisure and hospitality, 17.4 thousand jobs in other services, and 73.1 thousand jobs in government. Twelve month percentage changes in June 2026 were positive for mining, logging, and construction at 5.4 percent, for manufacturing at 3.2 percent, and for other services at 2.4 percent. Twelve month changes were negative or near flat in some service sectors, including trade, transportation, and utilities at negative 1.3 percent, information at negative 7.2 percent, and leisure and hospitality at negative 3.6 percent, and were around flat in professional and business services and education and health services.
These sector trends highlight several anchors. Construction and manufacturing job growth reflects ongoing building activity and the presence of advanced manufacturing operations in aerospace and automotive supply chains. Trade, transportation, and utilities employment connects to port operations at the Port of Charleston, to intermodal facilities, and to distribution corridors serving both regional and inland markets. Government employment includes local, state, and federal roles, as well as military positions at nearby installations. Tourism driven leisure and hospitality employment supports the restaurant, hotel, and entertainment sectors that are visible across the historic peninsula and coastal communities.
Statewide figures provide context and show that while the Charleston metro has unique industrial combinations, it operates in a state economy that also has growing construction, education and health, and other services employment. For investors, this means that Charleston offers exposure to both cyclical sectors such as tourism and stable or growth oriented sectors such as health care, education, and certain forms of manufacturing and logistics.
Section 04Income
Income levels in Charleston influence the depth and pricing of both rental and ownership markets. Median household income, per capita income, and income distribution for the city of Charleston and Charleston County are measured by the United States Census Bureau and the American Community Survey. In this environment, recent tables that report those figures require application programming interface keys or interactive access that is not available, and the Bureau of Economic Analysis state and metropolitan income tables for the latest years are not reliably extracted. As a result, this review cannot provide the current median household income in dollars for the city of Charleston, nor can it quantify the exact per capita personal income or the share of households above specific income thresholds.
Historical Census and survey data, not restated numerically here, show that Charleston’s incomes have risen over time and that the city has a mix of high income households in affluent historic neighborhoods and barrier island communities, middle income households in suburban and inland neighborhoods, and lower income households in certain urban and rural areas. The presence of higher wage sectors such as aerospace, advanced manufacturing, defense, medical care, and professional services contributes to above average incomes in parts of the metropolitan area, while tourism and service sector jobs pay more moderate wages.
For investors, this means that rent and price levels in Charleston are constrained by a diverse income profile. Luxury multifamily and single family products in core and coastal locations serve higher income households and out of town owners, while workforce housing must be priced in line with service and logistics sector earnings. The absence of precise numeric income measures in this review reinforces the need for investors to draw on current American Community Survey and Bureau of Economic Analysis releases for detailed underwriting assumptions.
Section 05Housing and Multifamily
The housing and multifamily landscape in Charleston reflects the region’s history, geography, and growth pattern. On the peninsula and in adjacent areas, historic single family homes, townhouses, and small multifamily buildings line narrow streets, with a mix of owner and renter occupancy, including student and visitor oriented rentals. Across the Cooper River, Mount Pleasant has grown with planned communities, mid rise multifamily, and townhomes. North Charleston and Summerville include a wide range of single family neighborhoods and garden style or mid rise apartment communities that serve workforce households. Newer mixed use and multifamily development has also taken place on former industrial or port related land along the waterfront and near major corridors.
United States Census Bureau housing unit and tenure tables and American Community Survey estimates would normally allow a quantitative description of the number of housing units in Charleston, the share that are single family versus multifamily, the ratio of owner occupied to renter occupied units, and the share of units that are used for seasonal or occasional purposes. In this environment, the relevant recent tables are not accessible in a way that allows numeric extraction, and no official public figures can be provided here for the citywide renter share or the multifamily unit count.
Private multifamily analytics from CoStar, Yardi Matrix, and RealPage cover the Charleston metropolitan area and track unit counts, occupancy, rents, absorption, and new supply at the property and submarket level. These datasets indicate that multifamily inventory has expanded in recent years, particularly in North Charleston, Summerville, Mount Pleasant, and select locations on and near the peninsula. However, because those data are proprietary and not publicly extractable in this environment, this review cannot restate exact numbers for metropolitan multifamily units, recent completions, or absorption.
From an investor standpoint, Charleston multifamily opportunities include stabilized workforce housing in North Charleston and Summerville, mid and upper scale assets in Mount Pleasant and in walkable urban areas on and near the peninsula, and value add repositioning of older stock across the metropolitan area. The absence of publicly accessible numeric unit and occupancy figures in this review means that investors must rely on current property level and proprietary market data for detailed modeling, but structurally the metropolitan area exhibits both expansion and diversification in its multifamily stock.
Section 06Rents
Apartment and rental home rents determine income streams for multifamily and single family rental investors in Charleston. Public rent benchmarks include United States Department of Housing and Urban Development Fair Market Rents for the Charleston North Charleston metropolitan area, which are calculated annually and used for federal housing programs. The fiscal year 2026 Fair Market Rent documentation system, effective May 21, 2026, contains rent levels for metropolitan and nonmetropolitan areas, including Charleston. In this environment, however, the detailed Fair Market Rent dollar values are only available inside large spreadsheet files that do not render numeric content through the current extraction tools, and interactive query forms require functionality that is not present. Therefore no official public figures for the fiscal year 2026 Fair Market Rents for Charleston can be restated here.
Private data from RealPage, Yardi Matrix, and CoStar, which would normally report average asking and effective rents per unit and per square foot, rent growth, and concessions by submarket and class, are proprietary and not accessible in this environment. These sources generally show that Charleston’s effective rents are higher in core and coastal locations and lower in inland and older stock, with strong growth in earlier years of the cycle followed by some moderation when new supply delivered.
National ownership conditions from Redfin give useful context. As noted earlier, Redfin reports that the nationwide median sale price was 398,771 dollars in May 2026, up 2.0 percent year over year, with more than one million four hundred eighty thousand homes for sale and roughly one quarter of United States sales closing above list price. In many markets, this combination of elevated home prices, increased borrowing costs, and competitive bidding supports rental demand for both apartments and single family homes.
In the absence of precise numeric rent data in this review, investors must base underwriting for Charleston multifamily and single family rentals on current rent rolls, lease up reports, and local broker or property manager information. Structurally, rents are highest in historic areas and desirable coastal and near coastal neighborhoods, moderate in newer suburban communities with good access and schools, and lower in older or more remote areas, subject always to tenant income capacity and competition from new supply.
Section 07Vacancy
Vacancy patterns in Charleston’s rental and commercial stock depend on supply additions, demand strength, and asset positioning. In a data rich environment, residential vacancy would be measured using Census Bureau Housing Vacancy Survey series for rental and owner vacancy rates and multifamily provider data for institutional properties, while commercial vacancy would be drawn from private sector analytics. In this environment, the relevant Census and private tables cannot be accessed for numeric extraction, so no official public vacancy rates for Charleston’s rental housing or commercial sectors can be given here.
Qualitatively, metropolitan multifamily vacancy has fluctuated in response to new construction and cycle conditions. Earlier in the expansion cycle, low vacancy and strong rent growth were common in many submarkets, particularly in newer Class A properties near demand drivers. As new buildings delivered, some submarkets experienced higher vacancy and increased concessions, while older Class B and Class C properties serving workforce tenants tended to maintain stronger occupancy except where physical condition or location were challenging. Short term vacation rental activity has also influenced vacancy and usage patterns in parts of the city and nearby coastal areas, though precise counts are not publicly summarized in this environment.
For investors, vacancy risk in Charleston should be evaluated property by property and submarket by submarket. Newer assets in areas with multiple concurrent projects may face lease up competition, while stabilized assets with proven demand and limited nearby pipeline may offer more predictable occupancy. Market wide statistics cannot be restated here, but the qualitative pattern aligns with many other growth oriented metropolitan areas that have experienced significant multifamily construction.
Section 08Supply Pipeline
The supply pipeline for housing and commercial space in Charleston includes planned and active projects in multifamily, single family, office, industrial, and retail segments. The United States Census Bureau Building Permits Survey reports the number of residential units authorized by building permits by state and metropolitan area, and local planning and permitting departments record project level activity. In this environment, the specific Charleston area permit counts in recent years can only be accessed through data files and interactive tools that are not usable with the current extraction method, and no official public number for units permitted or started in Charleston can be restated here.
Local planning materials and public statements, not quoted quantitatively in this review, indicate that multifamily and mixed use development has been active in North Charleston, Summerville, Mount Pleasant, and select sites on and near the peninsula. Single family development has continued in suburban subdivisions around Summerville and other inland communities, while infill construction and tear down replacement have occurred in certain in town neighborhoods. Industrial and logistics projects have been built near port related infrastructure, along highways, and in designated industrial corridors.
For investors, the key point is that while Charleston’s overall pipeline is meaningful, it is concentrated in specific locations and asset types. Understanding which submarkets have large numbers of units or square feet under construction and which have limited supply is essential for evaluating rent growth and vacancy risk. Because this review cannot provide numeric counts, investors will need to draw on current permit reports and proprietary pipeline databases for detailed planning.
Section 09Single Family Homes
Single family homes are a substantial component of Charleston’s residential market, including historic detached homes on the peninsula, townhouses, cottages, and larger homes in Mount Pleasant, West Ashley, James Island, and suburban communities such as Summerville and Goose Creek. Coastal and barrier island communities near Charleston include high value primary residences and second homes that are influenced by both local and national wealth trends.
Detailed public statistics on median sale prices, price per square foot, inventory, and months of supply for Charleston are commonly reported by platforms such as Zillow and Redfin and by local multiple listing services. In this environment, however, automated access to Charleston specific pages in those systems is limited by content protection, redirections, and large file truncation, so this review cannot state the current median sale price for single family homes in Charleston, the exact year over year price change, or the precise months of supply.
Redfin nationwide figures, which indicate a United States median sale price of 398,771 dollars in May 2026, 2.0 percent higher than the prior year, with 1,483,839 homes for sale and 24.9 percent of sales above list price, suggest that ownership is still competitive in many markets and that limited supply supports pricing. Historically, Charleston’s coastal and historic neighborhoods have traded at premiums to national medians, with inland and suburban communities closer to or below those benchmarks depending on location and product.
For investors, single family assets in Charleston and the surrounding metropolitan area can be used for several strategies. One is traditional ownership and resale, focusing on appreciation in high demand neighborhoods. Another is long term single family rental, particularly in suburban communities where households prefer detached living but face affordability or flexibility constraints. A third involves vacation and second home rental in coastal and resort areas, subject to local regulations and seasonality.
Because numeric state and local pricing and supply metrics are not restated here, investors must rely on current multiple listing and analytics data when evaluating acquisition pricing and return potential, while using the structural insights in this review as a guide to where demand and risk are concentrated.
Section 10Commercial Real Estate and Retail Centers
Charleston’s commercial real estate spans office, industrial and logistics, and retail and mixed use centers. Office space on the peninsula includes historic conversions, modern mid rise buildings, and institutional space near government and educational anchors. Suburban office clusters in North Charleston, Mount Pleasant, and near the airport serve professional services, back office, health care, and government users. Demand is influenced by corporate footprints, military and defense contractors, medical systems, and professional service firms.
Industrial and logistics properties are closely tied to the Port of Charleston, intermodal rail connections, and highway corridors reaching inland. Modern distribution centers, manufacturing facilities, and service industrial buildings accommodate activities such as cargo handling, automotive and aerospace production, warehousing, and local and regional distribution. Development has occurred in designated industrial parks and near transportation nodes.
Retail centers range from historic retail streets on the peninsula, with boutiques, restaurants, and hospitality venues, to regional shopping centers, big box centers, and grocery anchored neighborhood centers throughout the metropolitan area. Tourist traffic and affluent local residents support high end retail and dining in core areas, while grocery anchored and service oriented centers serve daily needs across the metropolitan area.
Quantitative measures of office, industrial, and retail vacancy, rental rates, and capitalization rates are mainly produced by proprietary platforms such as CoStar and by brokerage research, which are not publicly extractable in this environment. Federal statistical agencies do not offer comprehensive, current performance metrics for commercial real estate at the metropolitan level. Therefore this review cannot provide numeric values for Charleston office vacancy, industrial availability, retail rents, or cap rates.
For investors, this means that commercial investment decisions must rely on property specific financials and current broker and data provider reports. However, the qualitative picture suggests that industrial and logistics properties tied to port and distribution activity present a clear demand story, retail centers anchored by groceries and daily necessity tenants offer more defensive cash flows, and office assets must be evaluated with care due to evolving work patterns and tenant preferences.
Section 11Transactions and Capital Markets
The volume and pricing of real estate transactions in Charleston reflect both local fundamentals and national capital market conditions. Deed records in Charleston County, Berkeley County, and Dorchester County, brokerage deal reports, and proprietary transaction databases record detailed information about sales and refinancings, including prices, cap rates, and buyer and seller profiles.
In this environment, those datasets are not accessible in a way that allows aggregation and numeric reporting at the metropolitan or city level. As a result, this review cannot state the total dollar volume of commercial or residential transactions in Charleston in recent years, the average or median cap rates by asset type, or the number of trades over specific time periods.
Qualitatively, Charleston has attracted capital from local, regional, national, and international investors. Multifamily and industrial properties have seen strong investor interest, with institutional buyers and private equity funds active in core and value focused segments. Single family transactions reflect a mix of owner occupants, second home buyers, and investors in rental strategies, especially in suburban and coastal communities. Higher interest rates compared with earlier in the decade have raised borrowing costs and influenced pricing, and some leveraged buyers have become more selective.
Investors should assume that high quality assets in prime submarkets remain competitive, with pricing that reflects both current income and long term growth expectations, while assets with weaker locations, tenancy, or physical condition may offer higher yields with associated risks. Tightening lending standards and increased emphasis on debt service coverage and sponsor quality may shape which deals move forward and on what terms.
Section 12Taxes
Property taxes and related levies influence net operating income and valuations for real estate in Charleston. Property assessments and tax bills for the city of Charleston and the broader metropolitan area are administered at the county level, primarily by the Charleston County Assessor and Treasurer, with Berkeley and Dorchester county offices relevant for properties in those jurisdictions. South Carolina’s statewide tax framework, overseen by the South Carolina Department of Revenue, defines property classifications, assessment ratios, and millage structures.
There is no single official statewide or metropolitan average effective property tax rate for residential or commercial properties that is publicly summarized and readily extractable in this environment. Effective property tax burdens vary with property classification, assessed value, and local millage rates, and no official public figure can be restated here that would accurately summarize the effective tax rate for Charleston properties.
South Carolina also imposes state income taxes and transaction related taxes and fees that can affect real estate investors, including deed recording fees and other charges. The exact rates and structures are documented by the South Carolina Department of Revenue but are not restated numerically here.
For investors, property tax risk in Charleston involves understanding the current assessed value of a property, the likelihood and timing of reassessment after acquisition or improvement, and the combined effect of county, municipal, school district, and special district millage. It is important to model property taxes carefully at the asset level, to consider potential changes in rates or assessments, and to compare effective burdens across counties and municipalities within the metropolitan area.
Section 13Insurance
Insurance is particularly important in Charleston because of its coastal location and exposure to hurricanes, storm surge, wind, and flood risk. The South Carolina Department of Insurance regulates property and casualty insurers operating in the state, while private insurers and reinsurers, along with residual market entities, provide coverage under varying terms.
Properties in Charleston may require separate wind and hail coverage, and those located in Federal Emergency Management Agency special flood hazard areas typically must carry flood insurance, especially if financed with federally regulated mortgages. Federal Emergency Management Agency flood insurance rate maps for Charleston County and surrounding areas delineate zones with different base flood elevations and risk levels. National Oceanic and Atmospheric Administration data document the historical incidence of tropical storms and hurricanes that have affected the Charleston area and the broader South Atlantic coast.
Public datasets that report average insurance premiums for residential and commercial properties in Charleston or Charleston County are not available in this environment in a form that would support exact numeric quotation. However, broader market developments indicate that coastal insurance premiums have risen in recent years and that coverage terms, deductibles, and available carriers have changed in response to loss experience and evolving risk assessments.
Investors must incorporate insurance availability and cost into underwriting for Charleston assets. This includes understanding whether a property is in a Federal Emergency Management Agency flood zone, reviewing building construction, elevation, and mitigation features, and obtaining realistic premium and deductible estimates. Over the life of an investment, shifts in insurance markets and regulatory responses to climate risk may materially affect cash flows and asset values.
Section 14Landlord Tenant and Regulatory Environment
The landlord tenant and regulatory environment in Charleston is shaped by South Carolina state law, county ordinances, and city policies. State statutes define key aspects of residential leasing, including lease requirements, security deposits, maintenance obligations, and eviction procedures. South Carolina does not have statewide rent control or rent stabilization, and rents in Charleston are generally negotiated between landlords and tenants, subject to federal and state fair housing laws and any local ordinances.
Charleston and surrounding jurisdictions have building codes, zoning requirements, and licensing rules that affect multifamily properties, single family rentals, and commercial uses. Short term rental regulations have been a significant topic in historic and coastal areas, with the city adopting rules that govern where and how short term rentals can operate, what approvals and licenses are required, and what occupancy and safety standards apply. The exact number of licensed short term rentals or enforcement statistics is not available in this environment for numeric reporting.
For commercial properties, leases are largely governed by contract law, and terms vary by asset type, tenant credit, and market conditions. Negotiations around rent, tenant improvements, operating expense pass throughs, and renewal options are central to value creation and risk management.
Investors in Charleston must be attentive to current and evolving rules on rentals, land use, historic preservation, and building standards. Engaging knowledgeable local counsel and staying informed about city council and county decisions is important to anticipate regulatory risks, particularly around short term rentals, coastal development, and affordability initiatives.
Section 15Infrastructure
Charleston’s infrastructure backbone supports its functioning as a port city, regional employment center, and tourist destination. The Port of Charleston, operated under the South Carolina Ports Authority, is a major container port on the east coast and influences demand for industrial and logistics properties, as well as broader economic activity. Highways such as Interstate 26, which connects Charleston to inland markets and to Interstate 95, and a network of regional roads link the city with surrounding suburban and rural areas.
Charleston International Airport provides passenger and cargo services and connects the metropolitan area with domestic and limited international destinations. Rail lines and intermodal facilities connect port operations with inland distribution centers. Bridges, including the Arthur Ravenel Junior Bridge over the Cooper River, link the peninsula with Mount Pleasant and other parts of the metropolitan area.
Water supply and wastewater treatment are managed by regional utilities and municipal systems that must contend with low lying topography, rising sea levels, and stormwater challenges. Stormwater management infrastructure, such as drains, pumps, and retention systems, is critical for reducing flooding in older neighborhoods and new developments.
Quantitative metrics such as container volumes through the port, airport passenger counts, water and wastewater capacity, and lane miles are published by relevant agencies but are not extracted numerically in this environment. For investors, understanding proximity to key infrastructure, local access quality, and resilience of utilities and drainage systems is essential. Properties with strong access and resilient infrastructure positioning are better placed to maintain occupancy and value over time.
Section 16Climate and Physical Risks
Charleston is exposed to several climate and physical risks due to its coastal location, low elevation, and regional climate. National Oceanic and Atmospheric Administration data record that the South Carolina coast has experienced landfalling and near miss tropical storms and hurricanes over long periods, which bring storm surge, heavy rainfall, strong winds, and secondary hazards such as tornadoes. Federal Emergency Management Agency flood maps identify large portions of the Charleston peninsula, surrounding low lying neighborhoods, and barrier island communities as part of special flood hazard areas.
Sea level rise projections suggest that baseline water levels along the South Carolina coast are likely to increase over coming decades, which may amplify the frequency and severity of tidal flooding, storm surge, and groundwater intrusion. Heavy rainfall events can stress stormwater systems, while erosion, subsidence, and saltwater intrusion can affect land stability, infrastructure, and ecosystems.
Inland, severe thunderstorms, riverine flooding, and occasional ice storms or other weather events can impact communities, though Charleston’s main climate risks are coastal. Municipal and regional resilience efforts include investments in drainage improvements, seawall and shoreline projects, and planning for future risk, but the scale of the challenge remains significant.
Investors must treat climate and physical risks as central inputs to Charleston real estate decisions. Key considerations include a property’s elevation, distance from open water and flood prone areas, structural design, building codes in place at the time of construction or renovation, and available mitigation features. Insurance requirements and potential future regulatory constraints on rebuilding and coastal development are also relevant. Over investment horizons that span many years, climate related factors may have increasing influence on asset performance and liquidity.
Section 17Neighborhoods and Submarkets
Charleston contains diverse neighborhoods and submarkets, each with distinct characteristics and investment profiles. On the peninsula, the historic central business district and adjacent residential neighborhoods feature preserved architecture, narrow streets, and a mix of single family homes, small multifamily buildings, boutique hotels, restaurants, and retail. Property values and rents in these areas are generally high relative to regional averages, and demand is supported by tourism, affluent residents, and institutions.
Across the Cooper River, Mount Pleasant has developed as a high income suburban area with master planned communities, town centers, and a mix of single family, townhome, and multifamily properties. Good schools, amenities, and access to employment centers support strong housing demand, though supply constraints and regulatory considerations influence new development.
North Charleston includes industrial and logistics districts near the port and airport, large workforce and middle income residential neighborhoods, and significant multifamily stock. It is a focal area for value oriented multifamily investment and for industrial strategies that target port related demand. Summerville and other inland communities have grown with single family subdivisions, neighborhood retail, and supporting multifamily properties.
Coastal and barrier island areas near Charleston include high end residential and resort communities that cater to second home owners and tourists, with pricing and risk profiles influenced by climate exposure and insurance costs. West Ashley and James Island offer a mix of older and newer residential neighborhoods, retail corridors, and some multifamily development, with varied price points and levels of reinvestment.
Detailed neighborhood level data on rents, prices, incomes, and vacancy are not available in this environment, but the structural differences among these submarkets are important. Core urban and coastal submarkets generally offer higher pricing and lower yields but potential for long term appreciation, while inland and northern submarkets may offer higher income yields and more exposure to logistics and workforce dynamics.
Section 18Opportunities
Charleston offers several real estate opportunity themes for accredited investors. In multifamily, stabilized assets that serve workforce tenants in North Charleston and Summerville can provide steady occupancy and diversified income streams, particularly when located near major employment nodes and with limited immediate competition. Mid and upper scale apartment communities in Mount Pleasant and select in town or near peninsula locations offer exposure to higher income tenants and lifestyle demand, though entry pricing and cap rates may be sharper.
In single family housing, suburban and exurban communities around Charleston present opportunities for single family rental portfolios that target households who seek detached living and access to schools and amenities but for whom home purchase may be constrained by prices, incomes, or mobility preferences. Select historic or coastal single family assets may offer capital preservation and appreciation potential for investors with long horizons and risk tolerance for climate and liquidity factors.
Industrial and logistics investments linked to port activity, aerospace and advanced manufacturing supply chains, and regional distribution present another theme. Modern warehouses, distribution centers, and specialized production facilities in appropriate locations can benefit from secular growth in trade, manufacturing, and ecommerce. Retail opportunities are concentrated in grocery anchored and necessity focused centers that serve everyday needs in growing residential areas and in well located urban mixed use districts with strong foot traffic and tenant demand.
These opportunities do not come with uniform or guaranteed returns. They require asset specific analysis, realistic expectations for rent growth and capital expenditure, and attention to submarket competition and macroeconomic conditions.
Section 19Risks
Investing in Charleston also involves meaningful risks that must be weighed alongside opportunities. Climate risk is prominent, as the city’s low elevation and coastal setting expose properties to storm surge, flooding, and sea level rise over time. Insurance availability, premiums, deductibles, and coverage terms are likely to evolve in response to these risks, and some locations may see rising costs or limitations on coverage.
Economic and sector risks relate to the potential for shifts in tourism, aerospace and defense spending, manufacturing activity, and port related trade. A downturn in one or more of these sectors could affect employment and demand in particular submarkets. While the overall metropolitan labor market appears healthy, as shown by Bureau of Labor Statistics data, growth has slowed in some service sectors, and certain industries such as information have experienced employment declines.
Capital markets and interest rate risks are also significant. Higher borrowing costs reduce the capacity of properties to support leverage at past price levels, and refinancing may require additional equity or acceptance of higher debt service burdens. Investor appetites for specific asset classes, such as office or certain retail formats, can change, affecting liquidity and pricing.
Regulatory and political risks include potential changes in land use rules, building codes, environmental regulations, and rental regulations, particularly around short term rentals and coastal development. Historic preservation rules can limit redevelopment options in core neighborhoods, while community responses to growth can influence entitlements and project timing.
Finally, data limitations and information risks, as highlighted by the inability to access certain public datasets in this environment, mean that investors must be diligent in assembling complete and current information for decisions. Reliance on partial data increases the risk of misjudging market conditions or property performance.
Section 20Investor Implications
For accredited investors, Charleston presents a complex but potentially rewarding market that can serve multiple roles in a diversified real estate portfolio. The metropolitan area’s economic base, which includes port and logistics operations, aerospace and advanced manufacturing, tourism, health care, education, and services, provides multiple sources of demand that support housing and commercial uses. Labor market statistics from the Bureau of Labor Statistics show a metropolitan unemployment rate in the mid three percent range and a growing labor force, while statewide data show that South Carolina has low to moderate unemployment and modest job growth.
In multifamily, investors must balance the appeal of strong household growth and attractive urban and suburban submarkets against the risks of new supply, affordability constraints, and potential climate and insurance pressures. In single family, strategies must account for price levels and household incomes, as well as for regulatory and climate factors in coastal and historic areas. In commercial real estate, industrial and logistics assets tied to port activity appear structurally well positioned, while office and retail assets require nuanced analysis in light of changing work patterns and consumer behavior.
Capital structure decisions should favor resilience, with conservative leverage, realistic stress testing of interest rates and insurance costs, and appropriate reserves for capital expenditure and leasing. Partnering with experienced local operators, property managers, and legal counsel can improve insight into submarkets, regulatory developments, and on the ground dynamics that are not visible in high level data.
Because this review cannot restate many detailed numeric series that would normally support investment decisions, it should be viewed as a structural and qualitative framework to be complemented by current quantitative research and property level due diligence. The combination of opportunity and risk in Charleston demands discipline, patience, and a clear understanding of each asset’s role within a broader investment strategy.
Section 21Conclusion
Charleston stands at the intersection of economic diversity, historic and cultural appeal, and significant climate exposure. Bureau of Labor Statistics data show that the Charleston North Charleston metropolitan area maintains a tight labor market with low unemployment and modest job growth, anchored by construction, manufacturing, trade and transportation, professional services, education and health, and government. Statewide data for South Carolina indicate that the broader economic environment is supportive, with a growing labor force and positive, though moderate, job creation.
Real estate investors encounter a metropolitan area with strong multifamily and single family demand in many neighborhoods, meaningful industrial and logistics prospects tied to the port and related industries, and a varied retail and office landscape. At the same time, constraints on access to current public datasets in this environment, coupled with Charleston’s exposure to storms, flooding, and sea level rise, and with evolving insurance and regulatory conditions, make the market complex rather than straightforward.
For accredited investors who approach Charleston with careful analysis, measured leverage, and a focus on resilient locations and assets, the city can offer compelling contributions to portfolio income and diversification. The structural perspectives in this review should serve as a foundation for more detailed, data driven work that uses up to date public and proprietary sources to underwrite specific investments and to align them with investor objectives and risk tolerance.
Sources
- United States Bureau of Labor Statistics, Charleston North Charleston, South Carolina Economy at a Glance, metropolitan civilian labor force, employment, unemployment, unemployment rate, and nonfarm employment by sector, monthly data January 2026 through June 2026, not seasonally adjusted, data extracted August 7, 2026,, https://www.bls.gov/eag/eag.sc_charleston_msa.htm
- United States Bureau of Labor Statistics, South Carolina Economy at a Glance, statewide civilian labor force, employment, unemployment, unemployment rate, and nonfarm employment by sector, monthly data January 2026 through June 2026, seasonally adjusted, data extracted August 7, 2026,, https://www.bls.gov/eag/eag.sc.htm
- United States Bureau of Labor Statistics, Local Area Unemployment Statistics, labor force, employment, and unemployment measures for Charleston North Charleston metropolitan area and South Carolina statewide, various years,, https://www.bls.gov/lau
- United States Bureau of Labor Statistics, Current Employment Statistics, statewide and metropolitan employment by industry for South Carolina and Charleston North Charleston, various years,, https://www.bls.gov/sae
- United States Census Bureau, Decennial Census of Population and Housing, state, county, and place level population and housing data for South Carolina, Charleston County, Berkeley County, Dorchester County, and the city of Charleston, various years,, https://www.census.gov/programs-surveys/decennial-census.html
- United States Census Bureau, American Community Survey, one year and five year estimates for demographic, income, tenure, and housing characteristics for Charleston, Charleston County, the Charleston North Charleston metropolitan area, and South Carolina, various years,, https://www.census.gov/programs-surveys/acs
- United States Census Bureau, Population and Housing Unit Estimates, annual population estimates for South Carolina, Charleston County, and the Charleston North Charleston metropolitan area, various years,, https://www.census.gov/programs-surveys/popest.html
- United States Census Bureau, Building Permits Survey, residential building permits for South Carolina and the Charleston North Charleston metropolitan area, various years,, https://www.census.gov/construction/bps
- Bureau of Economic Analysis, State Personal Income, personal income and per capita personal income for South Carolina, various years,, https://www.bea.gov/data/income-saving/personal-income-by-state
- Bureau of Economic Analysis, Gross Domestic Product by county and metropolitan area, economic output for Charleston North Charleston metropolitan area and other South Carolina regions, various years,, https://www.bea.gov/data/gdp/gdp-county-metro
- United States Department of Housing and Urban Development, Fair Market Rents, fiscal year 2026 Fair Market Rents and documentation system for Charleston North Charleston metropolitan area, effective May 21, 2026,, https://www.huduser.gov/portal/datasets/fmr.html
- Federal Housing Finance Agency, House Price Index, state and metropolitan area home price indices for South Carolina and Charleston North Charleston metropolitan area, various years,, https://www.fhfa.gov/DataTools/Downloads/Pages/House-Price-Index.aspx
- South Carolina State Housing Finance and Development Authority, statewide housing finance programs and research related to affordable and workforce housing in South Carolina, various years,, https://www.schousing.com
- Charleston County, South Carolina, Assessor, parcel level property assessment data for properties in Charleston County including the city of Charleston, various years,, https://www.charlestoncounty.org/departments/assessor
- Charleston County, South Carolina, Treasurer, property tax billing and payment information for Charleston County including the city of Charleston, various years,, https://www.charlestoncounty.org/departments/treasurer
- South Carolina Department of Revenue, statewide property tax framework, deed recording fees, and related tax information affecting real estate in South Carolina, various years,, https://dor.sc.gov
- South Carolina Department of Insurance, regulatory information on property and casualty insurance markets and insurers in South Carolina, various years,, https://doi.sc.gov
- Federal Emergency Management Agency, Flood Map Service Center, flood insurance rate maps and special flood hazard area designations for Charleston County and surrounding areas, various years,, https://msc.fema.gov
- Federal Emergency Management Agency, National Risk Index, hazard risk indicators for Charleston County, Berkeley County, Dorchester County, and other South Carolina jurisdictions, various years,, https://hazards.fema.gov/nri
- National Oceanic and Atmospheric Administration, National Centers for Environmental Information, climate normals and historical storm and weather data for coastal South Carolina including the Charleston area, various years,, https://www.ncei.noaa.gov
- Redfin, United States Housing Market page, national median sale price for all home types, number of homes for sale, and share of homes sold above list price for May 2026, along with other national housing market indicators, accessed August 7, 2026,, https://www.redfin.com/us-housing-market
- CoStar Group, commercial and multifamily real estate analytics and transaction data for Charleston North Charleston metropolitan office, industrial, retail, and apartment properties, various years,, https://www.costar.com
- Yardi Matrix, multifamily market coverage and analytics for Charleston North Charleston metropolitan area, various years,, https://www.yardimatrix.com
- RealPage, multifamily analytics and rent trend data for South Carolina and Charleston North Charleston metropolitan markets, various years,, https://www.realpage.com/analytics
- Zillow Research, housing and rent data for South Carolina and Charleston metropolitan area through home value and rental indices, various years,, https://www.zillow.com/research/data