In brief · summary: Chattanooga
Chattanooga presents a markedly different investment profile from the coastal Florida markets that dominate Sun Belt discussion. It is an inland, diversified secondary market with a manufacturing, logistics, insurance, and health care base, steady rather than explosive population growth, a low cost operating environment, and a physical risk profile centered on tornadoes and river flooding rather than hurricanes.
For an accredited investor, the appeal is stability and cash flow durability rather than rapid appreciation, and the multifamily sector here is considerably healthier than in the oversupplied Gulf coast metros. The Chattanooga metropolitan statistical area, which spans southeastern Tennessee and northwestern Georgia, reached a population of 588,050 in 2024, according to US Census Bureau estimates, and Hamilton County, the core county, grew to 386,256 by July 1, 2024, up 5.29 percent from its 2020 base.
The labor market is tight, with metro unemployment of 3.6 percent in June 2026 per the Bureau of Labor Statistics, well below the national rate, even as nonfarm employment softened modestly. The apartment market shows vacancy near 11.0 percent and a small construction pipeline. According to CoStar data reported by Matthews, the metro recorded average apartment asking rent of 1,389 dollars per unit in the second quarter of 2025, down 2.1 percent year over year, with …
Section 01Executive Summary
Chattanooga presents a markedly different investment profile from the coastal Florida markets that dominate Sun Belt discussion. It is an inland, diversified secondary market with a manufacturing, logistics, insurance, and health care base, steady rather than explosive population growth, a low cost operating environment, and a physical risk profile centered on tornadoes and river flooding rather than hurricanes. For an accredited investor, the appeal is stability and cash flow durability rather than rapid appreciation, and the multifamily sector here is considerably healthier than in the oversupplied Gulf coast metros.
The Chattanooga metropolitan statistical area, which spans southeastern Tennessee and northwestern Georgia, reached a population of 588,050 in 2024, according to US Census Bureau estimates, and Hamilton County, the core county, grew to 386,256 by July 1, 2024, up 5.29 percent from its 2020 base. The labor market is tight, with metro unemployment of 3.6 percent in June 2026 per the Bureau of Labor Statistics, well below the national rate, even as nonfarm employment softened modestly. The apartment market shows vacancy near 11.0 percent and a small construction pipeline. According to CoStar data reported by Matthews, the metro recorded average apartment asking rent of 1,389 dollars per unit in the second quarter of 2025, down 2.1 percent year over year, with just 576 units under construction, a fraction of the supply overhang weighing on Florida markets.
The Chattanooga thesis rests on a low cost, business friendly, landlord friendly environment, with no state income tax, modest property taxes, and comparatively affordable insurance, set against slower growth and a manufacturing concentration that carries cyclical risk. The sections below quantify demand, supply, cost, and risk with named public sources, each figure carrying its scope, geography, and time period.
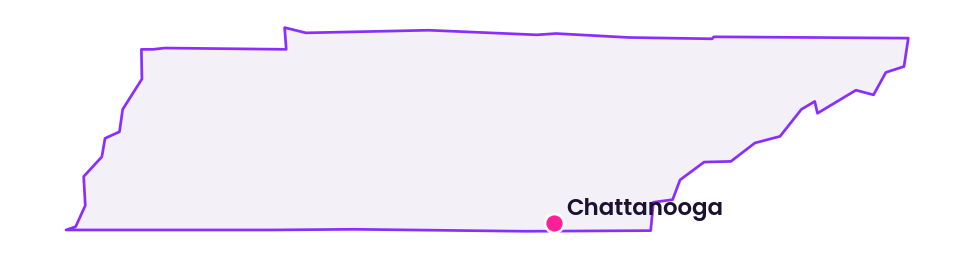
Section 02Population and Migration
Chattanooga's growth is steady and positive but modest by Sun Belt standards, which is itself an important signal about the pace of demand. The relevant geographies are the city of Chattanooga, Hamilton County, and the Chattanooga metropolitan statistical area spanning Tennessee and Georgia.
| Geography | Population | Date | Source |
|---|---|---|---|
| Chattanooga city | 181,099 | April 1, 2020 | US Census Bureau |
| Chattanooga city | 187,030 | July 1, 2023 | US Census Bureau QuickFacts |
| Hamilton County | 366,837 | April 1, 2020 base | US Census Bureau |
| Hamilton County | 386,256 | July 1, 2024 | US Census Bureau QuickFacts |
| Chattanooga TN GA MSA | 588,050 | 2024 estimate | US Census Bureau |
The city of Chattanooga grew about 3.3 percent from the 2020 census to 187,030 in 2023, and Hamilton County added 19,419 residents, or 5.29 percent, from its 2020 base to 386,256 in 2024. The metro area reached 588,050 in 2024, ranking among the 100 largest metropolitan areas in the country. These are healthy but unspectacular growth rates, in the low single digits annually, which stands in deliberate contrast to the near double digit multi year gains seen in Fort Myers or Sarasota. For an investor, the practical meaning is twofold. Demand growth is real and sustained, supporting gradual absorption of new housing, but it does not generate the explosive rent spikes, or the boom and bust supply cycles, that characterize faster growing markets. The Census totals do not separate the growth into domestic migration, international migration, and natural increase in the figures cited here, so a precise net migration figure is not stated, but the steady gains reflect both natural increase and in migration drawn by affordability, employment, and quality of life amenities including the region's outdoor recreation and its nationally recognized municipal broadband network.
Section 03Jobs and Economic Anchors
The labor market is one of Chattanooga's clear strengths, and its diversity is its defining feature. According to the Bureau of Labor Statistics, the metro unemployment rate was 3.6 percent in June 2026 on a seasonally adjusted basis, down slightly from 3.7 percent in June 2025, and the annual averages were 3.3 percent in 2025 and 3.1 percent in 2024, all below national levels. Total nonfarm employment was 292,400 in March 2026, down 0.9 percent year over year, after reading 297,400 in November 2025, so the very low unemployment coincides with a slight recent softening in payroll counts.
| Labor measure | Value | Period | Source |
|---|---|---|---|
| Unemployment rate | 3.6% | June 2026 | BLS |
| Unemployment rate | 3.7% | June 2025 | BLS |
| Annual average unemployment | 3.3% | 2025 | BLS |
| Annual average unemployment | 3.1% | 2024 | BLS |
| Total nonfarm employment | 292,400 | March 2026 | BLS |
| Nonfarm employment | 297,400 | November 2025 | BLS |
| Nonfarm job change | -0.9% | year over year to March 2026 | BLS |
The employer base is genuinely diversified across health care, manufacturing, insurance and finance, education, public power, food production, and logistics, which cushions the market against a downturn in any single sector. The Chattanooga Chamber of Commerce major employers list, reflecting employment as of December 31, 2024, ranks the leading employers as follows.
| Employer | Full time employees | Sector | Source |
|---|---|---|---|
| Erlanger Health System | 5,994 | Health care | Chattanooga Chamber 2025 list |
| Hamilton County Schools | 5,781 | Education | Chattanooga Chamber 2025 list |
| Volkswagen Chattanooga | 5,239 | Automotive manufacturing | Chattanooga Chamber 2025 list |
| BlueCross BlueShield of Tennessee | 4,145 | Insurance | Chattanooga Chamber 2025 list |
| Tennessee Valley Authority | 3,857 | Public power | Chattanooga Chamber 2025 list |
| CommonSpirit Memorial Hospital | 3,722 | Health care | Chattanooga Chamber 2025 list |
| McKee Foods | 3,171 | Food manufacturing | Chattanooga Chamber 2025 list |
| Unum Group | 3,082 | Insurance | Chattanooga Chamber 2025 list |
This roster is a genuine asset. A metro anchored by two large hospital systems, a Volkswagen assembly plant employing more than 5,000, the headquarters of BlueCross BlueShield of Tennessee and Unum, the Tennessee Valley Authority, and McKee Foods, maker of Little Debbie snacks, has demand drivers that span cyclical manufacturing and defensive health care, insurance, and government. The BLS reported 26,250 production jobs in the metro in May 2025 with a location quotient of 1.77, indicating a manufacturing concentration well above the national average, which is a growth engine but also the primary source of cyclical risk. Amazon, at 1,472 employees, anchors a growing logistics presence supported by the region's interstate crossroads. A further distinctive anchor is the municipal utility EPB and its fiber network, which made Chattanooga the first American city with citywide gigabit internet and helped brand it as Gig City, supporting a small but real technology and remote work base.
Section 04Income
Household income in Chattanooga is moderate and affordable relative to the coast, which supports rental demand at accessible price points. According to US Census Bureau QuickFacts, based on American Community Survey five year data covering 2019 through 2023 in 2023 dollars, median household income was 61,028 dollars in the city of Chattanooga, with a poverty rate of 17.6 percent. Hamilton County, the broader and more affluent geography, had a median household income of 72,568 dollars over the same period, with a poverty rate of 12.5 percent.
| Income measure | Value | Geography and period | Source |
|---|---|---|---|
| Median household income | 61,028 | Chattanooga city, ACS 2019 to 2023 | US Census Bureau |
| Poverty rate | 17.6% | Chattanooga city, ACS 2019 to 2023 | US Census Bureau |
| Median household income | 72,568 | Hamilton County, ACS 2019 to 2023 | US Census Bureau |
| Poverty rate | 12.5% | Hamilton County, ACS 2019 to 2023 | US Census Bureau |
The gap between the city figure of 61,028 dollars and the county figure of 72,568 dollars reflects the familiar pattern in which the incorporated core carries a lower income, higher renter share population than the surrounding suburban county. A cleanly isolated Bureau of Economic Analysis per capita personal income figure for Hamilton County, Tennessee is not stated here, because available county tabulations are readily confused with same named counties in other states and no reliably geography specific figure was confirmed. What the income data establish for an investor is that Chattanooga is a fundamentally affordable market. A median county household income near 72,568 dollars against a typical rent that Zillow observes near 1,519 dollars per month implies a rent to income ratio that leaves room for households to absorb modest rent increases, an important contrast with the affordability strained Florida markets where rents had pushed against local income ceilings.
Section 05Housing and Multifamily
The multifamily market is where Chattanooga's relative health is most visible. Rather than the mid to high teens vacancy seen in oversupplied Gulf coast metros, Chattanooga's apartment vacancy sits near 11 percent with a small construction pipeline, reflecting a market that added supply in measured fashion. The clearest current public figures come from CoStar, reported by Matthews, and from Yardi Matrix.
| Metric | Value | Geography and period | Source |
|---|---|---|---|
| Average asking rent | 1,389 | Chattanooga metro, Q2 2025 | CoStar, reported by Matthews |
| Year over year rent change | -2.1% | Chattanooga metro, Q2 2025 | CoStar, reported by Matthews |
| Apartment vacancy | 11.0% | Chattanooga metro, Q2 2025 | CoStar, reported by Matthews |
| Units under construction | 576 | Chattanooga metro, Q2 2025 | CoStar, reported by Matthews |
| Net absorption, quarter | 442 | Chattanooga metro, Q2 2025 | CoStar, reported by Matthews |
| Net absorption, trailing 12 months | 1,087 | Chattanooga metro, through Q2 2025 | CoStar, reported by Matthews |
| Net absorption, trailing 12 months | 1,692 | Chattanooga, through June 2025 | Yardi Matrix |
The defining feature is the modest scale of new supply. With only 576 units under construction in the second quarter of 2025 against trailing twelve month absorption of 1,087 units on the CoStar measure and 1,692 units on the Yardi Matrix measure, Chattanooga is absorbing apartments faster than it is building them, the mirror image of the Florida markets where deliveries have swamped demand. Vacancy of 11.0 percent is elevated relative to a fully stabilized market but is not distressed, and it reflects normal frictional vacancy plus the lease up of a limited number of recent projects rather than a supply glut. The one soft spot is rent, which declined 2.1 percent year over year to 1,389 dollars in the second quarter of 2025, indicating that even modest new supply, combined with national rent normalization, has been enough to nudge rents down in a market of this size. For an investor, the takeaway is a fundamentally balanced market with limited new competition on the horizon, which supports occupancy stability and a return to positive rent growth sooner than in heavily oversupplied metros.
Section 06Rents
Rents in Chattanooga are affordable and have softened modestly, a pattern consistent with national rent normalization rather than local oversupply. The CoStar data reported by Matthews put average apartment asking rent at 1,389 dollars per unit in the second quarter of 2025, down 2.1 percent year over year. A separate report drawing on later data placed metro average asking rent at 1,379 dollars in the third quarter of 2025. On the single family and all home rental side, the Zillow Observed Rent Index for Chattanooga was 1,519 dollars per month as of June 2026, up roughly 1.5 percent year over year, a measure that covers all homes and bedroom counts rather than apartments alone.
| Rent measure | Value | Geography and period | Source |
|---|---|---|---|
| Average apartment asking rent | 1,389 | Chattanooga metro, Q2 2025 | CoStar, reported by Matthews |
| Year over year apartment rent change | -2.1% | Chattanooga metro, Q2 2025 | CoStar, reported by Matthews |
| Average apartment asking rent | 1,379 | Chattanooga metro, Q3 2025 | Cosign |
| Zillow Observed Rent Index, all homes | 1,519 | Chattanooga, June 2026 | Zillow |
| Year over year rent change, all homes | +1.5% | Chattanooga, June 2026 | Zillow |
| Fair Market Rent, two bedroom | 1,426 | Chattanooga TN GA HUD Metro FMR Area, FY2025 | HUD |
The divergence between the apartment measure, down 2.1 percent, and the Zillow all home measure, up roughly 1.5 percent, is informative. It suggests that professionally managed apartment product faced modest pricing pressure from new lease up and national concession trends, while the broader rental stock, including single family rentals, held firmer. The HUD Fair Market Rent for a two bedroom of 1,426 dollars per month for fiscal year 2025 sits close to the market apartment rent, confirming that Chattanooga's effective two bedroom rent clusters in the low to mid 1,400s. For underwriting, the prudent posture is to assume flat to low single digit rent growth in the near term, with a credible path to firmer growth given the small supply pipeline.
Section 07Vacancy
Vacancy in Chattanooga is moderate and does not carry the definitional distortions that plague oversupplied markets. CoStar, as reported by Matthews, put metro apartment vacancy at 11.0 percent in the second quarter of 2025, and a later report placed occupancy at 89.5 percent, implying vacancy near 10.5 percent, in the third quarter of 2025. These figures are consistent with one another and describe a market with normal frictional vacancy plus a limited amount of lease up, rather than the wide gap between stabilized and overall vacancy that signals a supply glut elsewhere.
An 11 percent vacancy rate is somewhat above a tight market's 5 to 7 percent, but the trajectory matters. With absorption running well ahead of the small construction pipeline, vacancy should trend down as the handful of new projects fill and few replacements enter the pipeline. This is a healthier vacancy dynamic than in the Florida markets, where elevated vacancy is being driven higher by continued heavy deliveries. For an investor, moderate and improving vacancy supports underwriting to stable or gradually improving occupancy, with less lease up risk on new acquisitions than in oversupplied metros, though buyers should still verify submarket level occupancy for any specific asset.
Section 08Supply Pipeline
The supply pipeline is the single most favorable feature of the Chattanooga multifamily market. CoStar reported just 576 units under construction in the second quarter of 2025, and a later report counted 556 units in the third quarter of 2025. Against a metro apartment inventory measured in the tens of thousands and trailing twelve month absorption between roughly 1,087 and 1,692 units depending on the source, a pipeline of well under 1,000 units is small, and it means new competitive supply will be limited over the next one to two years.
| Supply measure | Value | Period | Source |
|---|---|---|---|
| Units under construction | 576 | Q2 2025 | CoStar, reported by Matthews |
| Units under construction | 556 | Q3 2025 | Cosign |
| Privately owned units authorized | 2,043 | Hamilton County, 2023 | Census Building Permits Survey |
| Privately owned units authorized | 2,130 | Hamilton County, 2024 | Census Building Permits Survey |
On the broader housing side, the Census Building Permits Survey shows Hamilton County authorized 2,130 privately owned housing units in 2024, up modestly from 2,043 in 2023. This series covers all structure types rather than single family alone, so it should not be described as a detached only count, but the stability of permitting near 2,000 units annually confirms a measured, demand matched pace of construction rather than a speculative boom. The investment implication is direct. Limited new supply protects existing assets from the occupancy and rent pressure that oversupply inflicts, and it is the strongest argument for the durability of Chattanooga apartment cash flows relative to faster building markets.
Section 09Single Family Homes
The for sale market is affordable and appreciating steadily, supporting a single family rental thesis. According to Redfin, the median sale price across all home types in the city of Chattanooga was 359,804 dollars for the three months ending June 2026, up 4.3 percent year over year. Zillow's Home Value Index for Chattanooga stood in the low 320,000s in mid 2026 and was roughly flat to slightly lower over the year, a measure that reflects the typical home value across the middle of the market rather than the sale price of homes that transacted.
| For sale and rental measure | Value | Geography and period | Source |
|---|---|---|---|
| Median sale price, all home types | 359,804 | Chattanooga city, 3 months ending June 2026 | Redfin |
| Year over year price change | +4.3% | Chattanooga city, June 2026 | Redfin |
| Zillow Observed Rent Index, all homes | 1,519 | Chattanooga, June 2026 | Zillow |
| Months of supply, single family region | 4.3 | Chattanooga region, May 2026 | Greater Chattanooga Realtors |
| Months of supply, all homes | 4.4 | Chattanooga, July 2026 | Redfin |
The combination of a Redfin median sale price near 359,804 dollars and a Zillow rent index near 1,519 dollars per month describes a market where the gross rent to price relationship is more favorable to landlords than in high cost coastal markets, supporting a single family rental or build to rent strategy. Home values are flat to modestly changing, with the Redfin all home median up 4.3 percent while the Zillow value index held roughly flat to slightly lower, indicating a market that has neither the froth nor the sharp correction seen elsewhere. Redfin data show homes typically going under contract in about 43 days in recent months, and Greater Chattanooga Realtors reported roughly 4.3 months of supply in May 2026, with Redfin near 4.4 months in July 2026, both consistent with a broadly balanced market. Affordability, steady appreciation, and favorable rent to price ratios make Chattanooga a credible single family rental market for investors seeking cash flow over rapid appreciation.
Section 10Commercial Real Estate and Retail Centers
Current public figures for Chattanooga office, industrial, and retail vacancy, asking rents, absorption, and cap rates are not available at the metro scale from a named public source, so this section states the demand structure that public data support.
The demand fundamentals favor industrial and logistics most strongly. Chattanooga sits at the crossroads of Interstate 75 and Interstate 24, roughly equidistant between Atlanta and Nashville, with rail service and a Tennessee River port, which makes it a natural distribution and manufacturing location. The Volkswagen assembly plant and its supplier network, the Amazon logistics presence, and trucking and logistics operators anchor genuine industrial demand, and the region's manufacturing location quotient of 1.77 underscores the concentration. Retail, particularly grocery anchored neighborhood centers, is supported by steady population growth and the affordability that sustains household formation, and it tends to be resilient given the necessity based nature of grocery anchored demand. Office is the weakest national property type in the current cycle, and Chattanooga's office demand is oriented toward its insurance and finance anchors, BlueCross BlueShield of Tennessee and Unum, and toward health care and government, rather than large speculative corporate tenancy, which argues for caution on speculative office and a focus on medical and credit tenant space. Local sector level metrics should be sourced from a current market survey specific to the subject property before committing capital.
Section 11Transactions and Capital Markets
Public transaction and pricing data for Chattanooga institutional real estate are limited, and a current multifamily cap rate for the metro from a named public source such as CoStar, Yardi Matrix, RealPage, or Berkadia is not available, so a specific cap rate is not stated. This is an honest gap. Chattanooga is a smaller market than the major metros that generate abundant public transaction commentary, and its cap rate data reside primarily in broker files and transaction records not published as free public series.
Secondary Sun Belt markets like Chattanooga have generally traded at wider cap rates than primary coastal and large Sun Belt metros, reflecting their smaller size, slower growth, and thinner buyer pools, and this cap rate premium is the compensation an investor receives for those characteristics. The favorable supply picture and low cost operating environment support income durability, which is the core of the Chattanooga value proposition.
Section 12Taxes
Tennessee's tax environment is a significant and underappreciated advantage. The state levies no tax on wage and salary income, and the Hall tax on investment income was fully repealed as of 2021, so residents pay no state income tax at all, a meaningful draw for high income households and retirees and a structural support for in migration. Property taxes are also modest by national standards. According to the Chattanooga Chamber summary sourced to the Hamilton County Assessor of Property, the following rates and assessment ratios apply.
| Tax feature | Value | Applies to | Source |
|---|---|---|---|
| Hamilton County property tax rate | 1.5157 per 100 assessed | 2025 | Hamilton County Assessor via Chattanooga Chamber |
| City of Chattanooga property tax rate | 1.9300 per 100 assessed | 2025 | Hamilton County Assessor via Chattanooga Chamber |
| Combined city and county rate | 3.4457 per 100 assessed | 2025, city parcels | Hamilton County Assessor via Chattanooga Chamber |
| Residential assessment ratio | 25% | Residential property | Tennessee law |
| Commercial and industrial assessment ratio | 40% | Commercial and industrial real property | Tennessee law |
| Effective rate on market value, city residential | 0.86% | City residential | Derived from rates and 25% assessment |
| Effective rate on market value, unincorporated residential | 0.38% | Unincorporated residential | Derived from county rate and 25% assessment |
Critically, Tennessee assesses residential property at 25 percent of its appraised market value, so the effective tax rate on market value is far lower than the nominal rate suggests. For a city property, the combined rate of 3.4457 dollars per 100 dollars of assessed value, applied to an assessment ratio of 25 percent, produces an effective rate on market value of roughly 0.86 percent, and for a property in unincorporated Hamilton County subject only to the county rate, the effective rate on market value is roughly 0.38 percent. These are low effective rates compared with many markets, and combined with the absence of a state income tax, they materially improve after tax returns. Investors should note that commercial and industrial real property is assessed at 40 percent rather than 25 percent under Tennessee law, so the effective rate on those asset classes is correspondingly higher and must be modeled specifically.
Section 13Insurance
Insurance is a relative advantage for Chattanooga, and this is one of the clearest contrasts with the Florida markets. As an inland metro, Chattanooga has no hurricane storm surge exposure and none of the coastal wind and flood driven insurance crisis that has made Florida coverage so expensive and volatile. Property insurance costs in Tennessee are driven primarily by severe convective storms, tornadoes, hail, and wind, along with localized flood risk, perils that are meaningful but that generally price far below coastal hurricane exposure.
A current average homeowners or commercial property insurance premium specific to Chattanooga or Hamilton County is not published by a named public source such as the Tennessee Department of Commerce and Insurance or the Insurance Information Institute, so no premium figure is stated here. What is clear is directional. Tennessee is consistently among the more affordable states for property insurance relative to the coastal catastrophe states, and the absence of hurricane exposure removes the single largest driver of the insurance cost escalation and availability problems seen in Florida. For an investor accustomed to underwriting Florida deals, the lower and more stable insurance cost in Chattanooga is a genuine improvement to net operating income durability, though tornado and hail exposure should still be reflected in deductibles and coverage, and any specific property should be quoted directly before closing.
Section 14Landlord Tenant and Regulatory Environment
Tennessee is a landlord friendly, state controlled regulatory environment, and Chattanooga benefits from the clarity of the state's Uniform Residential Landlord and Tenant Act. That Act, codified at Tennessee Code Annotated Title 66, Chapter 28, applies in the state's larger counties above a population threshold, which includes Hamilton County, so Chattanooga rental housing operates under a defined statutory framework rather than a patchwork of local rules. Most importantly for pricing power, Tennessee law preempts local rent control, barring any city or county from adopting an ordinance that controls the amount of rent charged for private residential or commercial property under Tennessee Code Annotated Title 66, Chapter 35, Section 102, so there is no rent control anywhere in the state and no prospect of it locally.
The statutory framework is also relatively favorable to owners on the operational details.
| Provision | Rule | Source |
|---|---|---|
| Security deposit cap | No cap | Tennessee URLTA, Title 66, Chapter 28 |
| Security deposit return | Generally within 30 days of termination, with itemized statement | Tennessee URLTA, Title 66, Chapter 28 |
| Nonpayment of rent notice | 14 days | Tennessee URLTA, Title 66, Chapter 28 |
| Late fee cap | 10% | Tennessee URLTA, Title 66, Chapter 28 |
| Month to month termination notice | 30 days before the periodic rental date | Tennessee URLTA, Title 66, Chapter 28 |
| Week to week termination notice | 10 days | Tennessee URLTA, Title 66, Chapter 28 |
Tennessee also has no just cause eviction requirement and no statutory landlord entry notice period in the Act, leaving entry terms to the lease. For an out of state investor, the combination of no rent control, no deposit cap, fast notice periods, and state level preemption of local tenant regulation makes Tennessee one of the more straightforward and owner friendly operating environments in the country, and it is a clear positive in the Chattanooga underwriting picture.
Section 15Infrastructure
Infrastructure is a genuine strength and a real demand driver for Chattanooga. The metro sits at the junction of Interstate 75, running north to south from the Midwest through Atlanta, and Interstate 24, connecting Nashville to the northwest, placing Chattanooga within a short drive of Atlanta and Nashville and making it a natural logistics and distribution hub. The Tennessee River provides barge access and a river port, and the region is served by Norfolk Southern and CSX rail, reinforcing its manufacturing and distribution role. Chattanooga Metropolitan Airport provides commercial passenger service, and while it is a smaller regional airport than the coastal Florida airports, it adequately serves a metro of this size.
The standout infrastructure asset is the municipal broadband network operated by the local electric utility EPB. Chattanooga became the first American city to offer citywide gigabit fiber internet, earning the Gig City nickname, and the network has since expanded to multi gigabit speeds. This is more than a marketing point. Reliable, ultra fast, affordable broadband has supported the region's technology startup activity, its ability to attract remote workers, and the smart grid capabilities of the utility itself. Current traffic counts, roadway capacity figures, and capital project schedules for the highway and river infrastructure are not consolidated into a single public figure here, but the structure itself, an interstate crossroads with rail and river access and a nationally leading broadband network, is a durable competitive advantage that supports industrial, logistics, and knowledge economy demand.
Section 16Climate and Physical Risks
Chattanooga's physical risk profile is fundamentally different from coastal Florida's, and on balance more favorable, though it is not risk free. As an inland metro, Chattanooga faces no hurricane storm surge, the single most destructive peril on the Gulf coast. Its primary natural hazards are severe convective storms, including tornadoes and hail, and riverine and surface flooding along the Tennessee River and its tributaries.
The tornado risk is real and was demonstrated vividly on April 27, 2011, when the historic Super Outbreak, the largest tornado outbreak in recorded history with more than 200 tornadoes in a single day, struck the Chattanooga area along with Tuscaloosa, Birmingham, and Huntsville, causing extensive damage and loss of life across the region, according to the National Weather Service and NOAA. Flooding is the other principal exposure. The NOAA National Centers for Environmental Information record multiple billion dollar flooding events affecting Tennessee, and independent risk analysis indicates that a meaningful share of Chattanooga buildings carry flood risk, concentrated along the river corridor and low lying tributary areas. Properties fall under FEMA National Flood Insurance Program mapping, with high risk zones along the Tennessee River and its tributaries and lower risk zones elsewhere, but flood zone status is parcel specific and must be checked for any individual property. For an investor, the practical implication is that Chattanooga trades hurricane risk for tornado and flood risk, a trade that generally results in lower and more stable insurance costs and less catastrophic tail exposure, though wind, hail, and flood coverage and appropriate deductibles remain essential, and riverfront parcels warrant particular flood scrutiny.
Section 17Neighborhoods and Submarkets
Chattanooga's submarkets range from a revitalized urban core to established suburban areas and growing outlying communities, and submarket selection turns on the balance between urban amenity and appreciation on one hand and affordability and yield on the other. Downtown Chattanooga and the North Shore across the Tennessee River have been the focus of the city's nationally noted revitalization, with riverfront development, cultural amenities, and higher end apartment and condominium product, commanding premium rents but with more new supply and higher entry prices. Established close in neighborhoods offer older housing stock and value add potential for single family and small multifamily investors. To the east and north, suburban Hamilton County communities including Hixson, Ooltewah, and the area near the Enterprise South industrial park where Volkswagen operates provide newer single family product and workforce rental demand tied to the manufacturing base. Across the state line, the northwest Georgia portion of the metro, including Catoosa and Walker counties, offers the most affordable housing and a lower tax jurisdiction, drawing commuters into the Chattanooga job market.
Rent, vacancy, and price data at the individual neighborhood scale beyond the metro and city figures already cited are not published in a consistent public series, so specific submarket numbers are not stated. The defensible strategic point is that the urban core and North Shore trade higher rents and appreciation potential against higher entry prices and more new supply, while suburban Hamilton County and the Georgia suburbs trade lower price points and stronger yields for slower appreciation, and submarket selection should follow the investor's balance of cash flow versus growth objectives.
Section 18Opportunities
The opportunity in Chattanooga is durable cash flow in a low cost, low volatility secondary market with a favorable supply picture. Unlike the oversupplied Florida coast, Chattanooga's apartment market carries only a small construction pipeline, with 576 units under construction against trailing twelve month absorption well above that, which protects existing assets from new competition and supports occupancy stability and a return to positive rent growth. The operating environment is genuinely advantageous, with no state income tax, low effective property tax rates near 0.86 percent on market value for city residential property and lower in the unincorporated county, comparatively affordable and stable insurance given the absence of hurricane exposure, and one of the most landlord friendly legal regimes in the country. The diversified employment base, spanning health care, automotive manufacturing, insurance headquarters, public power, and logistics, with metro unemployment at just 3.6 percent, underpins steady housing demand. For a single family rental or build to rent investor, affordable home prices, with a Redfin all home median near 359,804 dollars, against rents near 1,519 dollars per month produce favorable yields. The overall profile suits an investor prioritizing income durability and downside protection over rapid appreciation.
Section 19Risks
The risks are the mirror image of the opportunities. Growth is modest, in the low single digits, so the appreciation and rent spike potential is lower than in faster growing markets, and an investor seeking outsized value creation may find the pace slow. The manufacturing concentration, reflected in a location quotient of 1.77 for production jobs and anchored by the Volkswagen plant, is a cyclical exposure, and a downturn in automotive or broader manufacturing would weigh on employment and housing demand more than in a service dominated economy. Nonfarm employment softened 0.9 percent year over year to March 2026, a signal that the local economy is not immune to national cooling. Apartment rents declined 2.1 percent year over year as of the second quarter of 2025, showing that even a balanced market is subject to national rent normalization. Physical risk, while lower than on the coast, is real, with tornado and hail exposure demonstrated by the 2011 Super Outbreak and flood exposure along the Tennessee River corridor. Finally, as a smaller secondary market, Chattanooga has a thinner transaction market and less liquidity than primary metros, which can lengthen hold periods and widen exit cap rates, and the absence of reliable public cap rate data itself reflects that thinner market.
Section 20Investor Implications
For an accredited investor evaluating Chattanooga, the synthesis is a steady, affordable, low volatility secondary market that rewards a cash flow oriented strategy and a long hold. The favorable supply picture, low operating costs, absence of a state income tax, modest effective property taxes, and comparatively stable insurance support durable net operating income, and the landlord friendly legal environment reduces operational and political risk. Underwriting should assume modest population and rent growth in the low single digits rather than the rapid gains of boom markets, should reflect the small construction pipeline as a support to occupancy, and should incorporate the low effective property tax rates and stable insurance as genuine advantages relative to Florida deals. Buyers should underwrite to the wider cap rates typical of secondary markets, obtain current transaction comparables directly from active brokers given the limited public pricing data, and stress test for the cyclical manufacturing exposure that is the market's principal economic risk. Physical risk underwriting should address tornado, hail, and flood rather than hurricane, with particular flood scrutiny for riverfront parcels. In short, Chattanooga suits investors who value income durability, downside protection, and a low cost operating environment over rapid appreciation, and who can accept slower growth and thinner liquidity in exchange for stability. This is educational analysis to frame the opportunity, not a recommendation to transact.
Section 21Conclusion
Chattanooga in mid 2026 is a steady, diversified, affordable secondary market that offers a genuine alternative to the boom and bust dynamics of the coastal Sun Belt. Hamilton County has grown to 386,256 residents, the metro to 588,050, at a measured low single digit pace, and metro unemployment of 3.6 percent reflects a tight labor market anchored by health care, automotive manufacturing, insurance headquarters, public power, and logistics. The apartment market is broadly balanced, with vacancy near 11 percent, a small construction pipeline of under 600 units, and only modestly soft rents, a far healthier supply picture than the oversupplied Florida metros. Low taxes, including no state income tax, affordable and stable insurance given the inland location, and a landlord friendly legal regime round out a low cost, low volatility operating environment. The tradeoffs are slower growth, a cyclical manufacturing concentration, tornado and flood rather than hurricane risk, and thinner market liquidity. The investment question is not whether Chattanooga will boom, it likely will not, but whether its stability, affordability, and cash flow durability fit an investor's objectives, and that is a question each investor must answer through definitive offering documents and independent verification of every figure above.