In brief · summary: Colorado Springs
Colorado Springs is Colorado’s second largest city and the economic center of El Paso County on the southern Front Range. Three geographies matter, and they are not interchangeable. The city proper is the unit for household income, tenure, rents, vacancy, and housing stock. El Paso County is the unit for building permits, county product, and the Census Bureau’s July 1 population estimates. The Colorado Springs metropolitan statistical area is the unit the U.S.
Bureau of Labor Statistics uses for payroll jobs and the unemployment rate. This review names the geography on every figure. The 2020 Census counted 478,961 city residents. The American Community Survey 2024 one year estimate puts the city at 493,540, with a margin of error of 57 people. El Paso County’s July 1 population rose from 733,721 in 2020 to 757,040 in 2025 on the Census Bureau series hosted by FRED.
Growth continues, but it is measured, not explosive. The labor market is a military, federal, health, and professional services machine with a thin information sector. In the Colorado Springs MSA, preliminary June 2026 nonfarm payroll employment was 333,600, up 0.8% from a year earlier, and the not seasonally adjusted unemployment rate was 4.1%. Education and health services and professional and business services added jobs. Information employment …
Section 01Executive Summary
Colorado Springs is Colorado’s second largest city and the economic center of El Paso County on the southern Front Range. Three geographies matter, and they are not interchangeable. The city proper is the unit for household income, tenure, rents, vacancy, and housing stock. El Paso County is the unit for building permits, county product, and the Census Bureau’s July 1 population estimates. The Colorado Springs metropolitan statistical area is the unit the U.S. Bureau of Labor Statistics uses for payroll jobs and the unemployment rate. This review names the geography on every figure.
The 2020 Census counted 478,961 city residents. The American Community Survey 2024 one year estimate puts the city at 493,540, with a margin of error of 57 people. El Paso County’s July 1 population rose from 733,721 in 2020 to 757,040 in 2025 on the Census Bureau series hosted by FRED. Growth continues, but it is measured, not explosive.
The labor market is a military, federal, health, and professional services machine with a thin information sector. In the Colorado Springs MSA, preliminary June 2026 nonfarm payroll employment was 333,600, up 0.8% from a year earlier, and the not seasonally adjusted unemployment rate was 4.1%. Education and health services and professional and business services added jobs. Information employment was down 14.0% over 12 months. Government remains the largest supersector at 55,900 jobs even after a 1.8% decline.
Housing is tighter than the typical 2024 to 2026 Sun Belt tape. ACS 2024 counts 218,794 housing units, 209,874 occupied households, a median owner occupied value of $479,500, and a median gross rent of $1,699. Units vacant and for rent number 2,847. Using the Census rental vacancy formula (for rent units divided by for rent units plus renter occupied units), the city rental vacancy rate is 3.07%. Homeowner vacancy is 0.93%. Those are low vacancy prints, not a concession market conclusion, and they do not assure pricing power, occupancy, or investment results.
The tension is in the other public tapes. HUD’s FY 2026 two bedroom Fair Market Rent for the Colorado Springs HUD Metro FMR Area (El Paso County) is $1,735, down from $1,778 in FY 2025. County building permits fell from 9,186 units in 2021 to 3,849 in 2024, then rebounded to 5,707 in 2025. Tight occupied stock, a HUD mark to market that moved slightly lower, and a permit trough followed by a rebound is the 2026 setup. The public residential vacancy print is the ACS 2024 Census rental vacancy rate of 3.07% for Colorado Springs city. No public Colorado Springs commercial vacancy rate or cap rate is published. This is a frame, not a verdict. Past conditions and trends do not assure future occupancy, rents, or investment results.
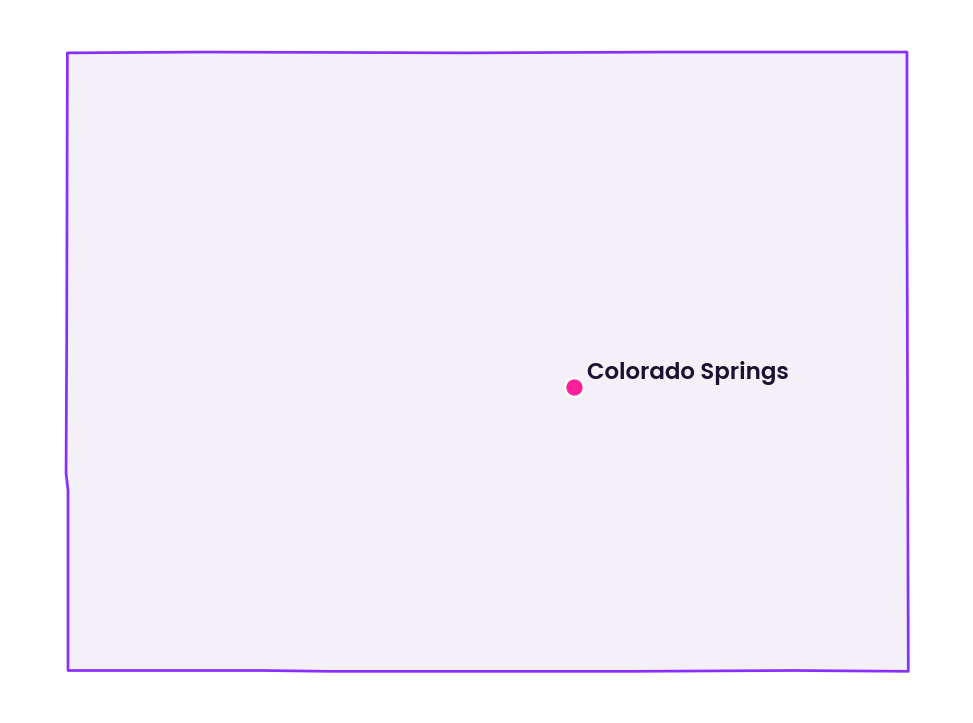
Section 02Population and Migration
The 2020 Census city count is 478,961. ACS 2024 estimates 493,540 residents in the city, a survey figure whose 57 person margin of error is unusually tight for a city of this size. El Paso County, of which Colorado Springs is the seat and dominant city, grew from 733,721 in 2020 to 752,356 in 2024 and 757,040 in 2025 (Census Bureau July 1 estimates via FRED). The 2024 to 2025 county gain was 4,684 people. That is still growth. It is not the 2021 housing frenzy pace.
The city is younger than the national old age stereotype and older than some Sun Belt boomtowns. ACS 2024 median age is 36.0 years (34.9 for males, 36.9 for females). Hispanic or Latino residents number 104,189 of 493,540, or 21.11%. Non Hispanic residents number 389,351. A median age of 36 is consistent with both family rentals and a large working age military adjacent renter pool. That is demographic context, not a forecast of occupancy.
Household structure is family heavy with a large living alone sleeve. ACS 2024 counts 209,874 households, of which 129,937 are family households and 100,088 are married couple families. Nonfamily households number 79,937, including 62,566 people living alone. Married couple share is high for a city this size, which supports three and four bedroom product. More than 60,000 one person households still support one bedroom apartments near bases, hospitals, and the core.
Geographic mobility is the military tell. ACS 2024 covers 486,719 people age one year and over.
| Mobility status (ACS 2024, city, population 1 year and over) | People | Share of 486,719 |
|---|---|---|
| Same house as one year earlier | 396,038 | 81.37% |
| Moved within El Paso County (same county) | 45,645 | 9.38% |
| Moved from a different Colorado county | 13,680 | 2.81% |
| Moved from a different state | 25,269 | 5.19% |
| Moved from abroad | 6,087 | 1.25% |
Interstate movers (25,269) outnumber movers from other Colorado counties (13,680). That pattern is unusual for a midsize inland city and is consistent with permanent change of station traffic around Fort Carson, the United States Air Force Academy, Peterson Space Force Base, and related installations. Same county churn (45,645) is still the largest move category after “did not move.” Investors who underwrite only local household formation can miss a renter pool that regularly turns over because the Department of Defense moved the household, not because a lease expired in a normal civilian way. Turnover can support absorption. It can also raise make ready costs and credit noise if incoming rank mix shifts. Neither absorption nor expense outcomes are assured.
Section 03Jobs and Economic Anchors
City residents and city payrolls are different universes. ACS 2024 reports 243,241 civilian employed people living in Colorado Springs. Active duty service members are largely outside that civilian table. The BLS Current Employment Statistics survey for the Colorado Springs MSA is the current payroll tape. Figures below are not seasonally adjusted, preliminary for June 2026.
| Industry (MSA, thousands of jobs) | June 2026 (preliminary) | 12 month percent change |
|---|---|---|
| Total nonfarm | 333.6 | +0.8% |
| Government | 55.9 | -1.8% |
| Professional and business services | 54.2 | +3.0% |
| Education and health services | 53.4 | +6.2% |
| Trade, transportation, and utilities | 49.7 | -1.2% |
| Leisure and hospitality | 44.2 | +3.8% |
| Other services | 22.1 | -7.9% |
| Financial activities | 19.5 | +0.0% |
| Mining, logging, and construction | 18.7 | +2.2% |
| Manufacturing | 11.6 | +0.0% |
| Information | 4.3 | -14.0% |
June 2026 civilian labor force was 385,500, with 369,700 employed and 15,800 unemployed, for a 4.1% unemployment rate. The rate is up from 3.6% in April 2026 on a not seasonally adjusted basis. The 12 month payroll gain of 0.8% is positive and thin. This is not a 3% job boom. It is a market that stopped shrinking after several weak winter prints (total nonfarm was down 0.7% year over year in January 2026) and turned slightly positive by June.
Sector mix is the demand tell. Government at 55,900 jobs is the largest supersector even after a 1.8% decline. That civilian government print still understates the military economy, because many active duty personnel are not in CES nonfarm the way a hospital nurse is. Education and health services at 53,400, up 6.2% over 12 months, is the strongest growth sleeve and the sleeve most often associated with civilian renter demand in this mix; that association is not a forecast of occupancy or rent. Professional and business services at 54,200, up 3.0%, is the contractor and professional overlay around space, defense, and cyber work. Leisure and hospitality at 44,200, up 3.8% in June, tracks Pikes Peak tourism, the Broadmoor, Olympic City USA visitor traffic, and a seasonal summer lift that was still negative on a 12 month basis as recently as May (down 1.2% in May 2026).
The weak sleeves are real. Information is only 4,300 jobs and was down 14.0% over 12 months. This is not a software campus market. Other services were down 7.9%. Trade, transportation, and utilities were down 1.2%, so this is not a warehouse boom. Manufacturing is flat at 11,600. Construction is modestly up at 18,700 after a weak winter.
Resident civilian industry from ACS 2024 lines up with health and professional work more than with factories.
| Resident industry (ACS 2024, civilian employed residents living in the city) | People | Share of 243,241 |
|---|---|---|
| Educational services and health care | 60,631 | 24.93% |
| Professional, scientific, management, and administrative | 36,033 | 14.81% |
| Retail | 23,559 | 9.69% |
| Construction | 18,326 | 7.53% |
| Public administration | 14,327 | 5.89% |
| Manufacturing | 13,258 | 5.45% |
| All civilian employed residents | 243,241 | 100.00% |
Public administration in the civilian ACS table excludes most active duty strength.
Named federal and military anchors in and around the city include Fort Carson, the United States Air Force Academy, Peterson Space Force Base, Schriever Space Force Base, and Cheyenne Mountain. No public official headcount is published for those installations. The BLS government supersector and the ACS interstate mover count are the quantitative proxies. A contractor workforce on time limited assignments can be a different credit and turnover box than a healthcare renter with a longer local job; both profiles are present in this market.
El Paso County GDP from the Bureau of Economic Analysis was $55,117,195,000 in 2024, up from $52,021,137,000 in 2023 and $47,467,199,000 in 2022. County product in current dollars is still rising.
Section 04Income
ACS 2024 median household income in Colorado Springs is $83,672 in 2024 inflation adjusted dollars, with a margin of error of $4,530. Per capita income is $47,059. Those are city resident money income figures. El Paso County per capita personal income from BEA was $68,934 in 2024, $65,598 in 2023, and $61,728 in 2022. BEA personal income includes supplements and property income that ACS does not. The county also includes higher income edges such as the Monument and northern corridor. Do not treat $83,672 and $68,934 as a fight about one number.
| Household income (ACS 2024, city) | Households | Share of 209,874 |
|---|---|---|
| Less than $25,000 | 22,518 | 10.73% |
| $25,000 to $49,999 | 31,406 | 14.96% |
| $50,000 to $74,999 | 39,518 | 18.83% |
| $75,000 to $99,999 | 29,114 | 13.87% |
| $100,000 to $149,999 | 38,843 | 18.51% |
| $150,000 to $199,999 | 21,840 | 10.41% |
| $200,000 or more | 26,635 | 12.69% |
The upper tail is material. Households at $150,000 and above are 23.10% of all households. Households under $25,000 are 10.73%. For multifamily, $83,672 median income against $1,699 median gross rent does not look automatically broken at the median, but the rent burden table later in this review shows that many renter households already pay 30% or more of income. For ownership, the binding comparison is $479,500 median owner occupied value against $83,672 median income. That is a richer value tape than many Sun Belt industrial cities, which is why payment shock, not a coastal trophy entry price, is the ownership constraint when mortgage rates are elevated.
Colorado levies a state individual income tax. The Colorado Department of Revenue publishes a 2025 individual income tax rate of 4.4% of Colorado taxable income (4.25% for tax year 2024). That is a statutory difference from Texas and it belongs in any after tax household comparison. Local property tax remains the real estate operating levy and is covered in the Taxes section.
No public city level official wage series is published. The income section rests on ACS household income, BEA county personal income, and the state income tax rate.
Section 05Housing and Multifamily
ACS 2024 is the public description of the city’s stock. Colorado Springs had 218,794 housing units and 209,874 occupied units. Owner occupied units were 119,989 (57.17% of occupied). Renter occupied units were 89,885 (42.83%). This is a majority ownership city with a large renter minority, typical of a military and family Front Range market rather than a renter majority coastal core.
| Units in structure (ACS 2024, city) | Units | Share of 218,794 |
|---|---|---|
| 1 unit, detached | 129,519 | 59.20% |
| 1 unit, attached | 16,618 | 7.59% |
| 2 units | 3,523 | 1.61% |
| 3 or 4 units | 12,226 | 5.59% |
| 5 to 9 units | 9,520 | 4.35% |
| 10 to 19 units | 14,844 | 6.78% |
| 20 to 49 units | 14,458 | 6.61% |
| 50 or more units | 13,636 | 6.23% |
| Mobile home | 4,211 | 1.92% |
| Boat, RV, van, etc. | 239 | 0.11% |
Structures with five or more units total 52,458, or 23.98% of the stock. That is the conventional apartment inventory. The 10 to 49 unit bands (29,302 units) are a large garden and mid density sleeve. Structures with 50 or more units (13,636) are the smaller high density sleeve. Attached one unit product (16,618) is a real townhouse book, not a rounding error.
Tenure by structure is the single family rental tell. Of 89,885 renter occupied units, 20,612 are one unit detached houses. That is 22.93% of renter households in a detached house. Owner occupied detached houses are 104,440. Detached rental is smaller as a share of renters than in some Texas industrial cities, but 20,612 households is still a full asset class.
Age of stock is older than a 2021 boomtown myth would suggest.
| Year structure built (ACS 2024, city) | Units | Share of 218,794 |
|---|---|---|
| 2020 or later | 13,828 | 6.32% |
| 2010 to 2019 | 29,533 | 13.50% |
| 2000 to 2009 | 28,754 | 13.14% |
| 1990 to 1999 | 27,715 | 12.67% |
| 1980 to 1989 | 34,824 | 15.92% |
| 1970 to 1979 | 36,500 | 16.68% |
| 1960 to 1969 | 18,802 | 8.59% |
| 1950 to 1959 | 13,380 | 6.11% |
| 1940 to 1949 | 4,549 | 2.08% |
| 1939 or earlier | 10,909 | 4.99% |
Units built in 2010 or later are 43,361, or 19.82% of the stock. The 1970s and 1980s together are 71,324 units, or 32.60%. That vintage is the garden value add book: wood frame, aging mechanicals, and, in this climate, hail and wildland ember exposure. Among renter occupied units, 6,479 were built in 2020 or later and 13,384 were built from 2010 to 2019. New rental supply exists. It is not the majority of occupied rentals.
Bedroom mix is not a studio market.
| Bedrooms (ACS 2024, all units) | Units | Share of 218,794 |
|---|---|---|
| No bedroom | 6,019 | 2.75% |
| 1 bedroom | 25,721 | 11.76% |
| 2 bedrooms | 56,143 | 25.66% |
| 3 bedrooms | 54,513 | 24.92% |
| 4 bedrooms | 47,181 | 21.56% |
| 5 or more bedrooms | 29,217 | 13.35% |
Two and three bedroom units together are 50.58% of the stock. Four or more bedrooms are 34.91%. Family and military household size shows up in the walls. Multifamily that ignores three bedroom demand is fighting the household structure, especially near Fort Carson and the Academy corridor.
Median owner occupied value is $479,500 (ACS 2024). That is a stock median of occupied owner homes, not a 2026 MLS median sale. Redfin reports a median sale price of $459,650 for Colorado Springs over the three months ending June 2026, down 3.1% from the same period a year earlier. The Zillow Home Value Index for Colorado Springs was $448,511 as of July 31, 2026, down 1.6% over the past year. The ACS value is the most defensible public city figure, and it is high enough that a $1,699 median gross rent does not, by itself, imply a particular cash on cash or other return on a median priced house after tax, insurance, and vacancy. No such return is shown or assured.
Section 06Rents
The public rent tape has two honest layers, and they do not say exactly the same thing.
ACS 2024 city median contract rent is $1,529. Median gross rent (contract rent plus estimated utilities) is $1,699. Median gross rent as a percentage of household income is 32.2%, just above the conventional 30% line at the median renter.
HUD Fair Market Rents for the Colorado Springs HUD Metro FMR Area, which HUD defines as El Paso County, are the voucher payment standard backbone. FY 2026 FMRs are below FY 2025 FMRs at every bedroom size in the HUD documentation system.
| Bedroom size (HUD FMR, El Paso County) | FY 2025 | FY 2026 | Change |
|---|---|---|---|
| Efficiency | $1,219 | $1,196 | -1.89% |
| One bedroom | $1,472 | $1,464 | -0.54% |
| Two bedroom | $1,778 | $1,735 | -2.42% |
| Three bedroom | $2,491 | $2,413 | -3.13% |
| Four bedroom | $2,846 | $2,744 | -3.58% |
A HUD two bedroom FMR that moved from $1,778 to $1,735 while ACS median gross rent sits at $1,699 is a market whose official 40th percentile recent mover path cooled even as occupied medians remain elevated. That is consistent with a 2021 to 2022 permit boom (9,186 and 8,685 county units) delivering into 2023 and 2024, then asking rents giving back some peak while in place tenants still pay near $1,700 gross. No public same unit asking rent index is published for Colorado Springs city. Zillow reports an average rent of $1,950 in Colorado Springs as of mid 2026, down $45 from the prior year.
| Gross rent as a percentage of income (ACS 2024, renter households) | Households | Share of 89,885 |
|---|---|---|
| Less than 15.0% | 6,644 | 7.39% |
| 15.0% to 24.9% | 19,380 | 21.56% |
| 25.0% to 29.9% | 13,410 | 14.92% |
| 30.0% to 34.9% | 9,209 | 10.25% |
| 35.0% to 49.9% | 19,095 | 21.24% |
| 50.0% or more | 19,153 | 21.31% |
| Not computed | 2,994 | 3.33% |
| Total renter households | 89,885 | 100.00% |
Among renter households with a computed ratio (86,891), 47,457 pay 30% or more of income on gross rent, and 19,153 pay 50% or more. That is 54.62% rent burdened and 22.04% severely burdened among computed renters. Affordability is not solved by a $1,699 median. New Class A deliveries that need rents well above the HUD two bedroom FMR of $1,735 would be asking more than the voucher standard and more than the ACS median. They compete with 20,612 detached rentals and with a large 1970s and 1980s garden book. No particular asking rent, occupancy, or investment result is assured.
Voucher programs in this HUD area use Small Area FMRs by ZIP Code. Neighborhood payment standards can sit above or below the county schedule. No public ZIP level Small Area FMR table is included in this review.
Section 07Vacancy
ACS 2024 vacant units total 8,920, or 4.08% of 218,794 units. That headline is low. Vacancy status is more useful.
| Vacancy status (ACS 2024, city) | Units | Share of 8,920 |
|---|---|---|
| For rent | 2,847 | 31.92% |
| Rented, not occupied | 825 | 9.25% |
| For sale only | 1,129 | 12.66% |
| Sold, not occupied | 359 | 4.02% |
| Seasonal, recreational, or occasional | 1,357 | 15.21% |
| For migrant workers | 0 | 0.00% |
| Other vacant | 2,403 | 26.94% |
| Total vacant | 8,920 | 100.00% |
The Census rental vacancy rate is 2,847 / (2,847 + 89,885) = 3.07%. The homeowner vacancy rate is 1,129 / (1,129 + 119,989) = 0.93%. Both sides of the housing market look tight in the occupied stock. Seasonal vacancy of 1,357 units is larger than in a pure year round industrial city and is consistent with Pikes Peak second homes and short stay product, but it is still a small share of 218,794 units. “Other vacant” at 2,403 is a residual (repairs, estate, held off market), not available supply.
A 3.07% rental vacancy is a different world from a high vacancy Sun Belt lease up tape. It can be consistent with less vacant for rent competition for in place operators, provided insurance and tax do not offset that condition; pricing power, occupancy, and net operating income are not assured. It also means new 2025 and 2026 deliveries, if concentrated in one corridor, can still bid against each other even when the citywide vacant for rent pool is small. No public property class occupancy series is published. Stabilized gardens can run better or worse than 3.07%. No public property class occupancy figure is published.
The HUD FMR decline sits beside this tight vacancy without contradiction if peak asking rents in 2023 and 2024 overshot what recent movers would pay in 2025. Tight occupancy and slightly lower FMRs can coexist when the vacant for rent pool is small but the marginal lease is negotiated down from an unsustainable peak.
Section 08Supply Pipeline
The defensible public proxy is the Census Bureau Building Permits Survey for El Paso County, new private housing units authorized.
| Year (annual, El Paso County) | Units authorized | Change versus prior year |
|---|---|---|
| 2020 | 6,819 | n/a |
| 2021 | 9,186 | +34.7% |
| 2022 | 8,685 | -5.5% |
| 2023 | 5,083 | -41.5% |
| 2024 | 3,849 | -24.3% |
| 2025 | 5,707 | +48.3% |
2021 was the peak in this window. 2022 remained elevated. 2023 and 2024 were the crash, with 2024 at 3,849 units, below even 2020. 2025 rebounded to 5,707, still well below 2021. Permits are authorizations, not completions, and they mix single family and multifamily. They still describe the cycle. The 2021 and 2022 wave is already in ACS as 13,828 city units built in 2020 or later. The 2024 trough is why citywide rental vacancy can look tight in ACS 2024 even as HUD FMRs slipped. The 2025 rebound is a delivery risk flag into 2026 and 2027 if those authorizations are completed: more competing units after a two year pause. Completions and occupancy effects are not assured.
Growth has been physically concentrated on the north and east edges (Briargate, Interquest, Powers corridor, Banning Lewis Ranch). Construction payroll in the MSA was 18,700 in June 2026, up 2.2% over 12 months, which is consistent with a permit rebound off a 2024 low rather than with another 9,000 unit year.
Section 09Single Family Homes
Detached houses are still the majority asset. ACS 2024 counts 129,519 one unit detached structures, 59.20% of all units, plus 16,618 attached one unit homes. Owner occupied detached houses are 104,440. Renter occupied detached houses are 20,612. The single family rental book is real, but it is not 30% of renters. It is about 23%.
Median owner occupied value of $479,500 is the public price anchor. At that median, a scattered site rental underwriting case is tighter than in a lower median value industrial city, and no particular cash on cash or other return is shown or assured. ACS does not publish a separate contract rent for detached rentals. Applying the citywide $1,529 median contract rent to a four bedroom house would understate many north corridor house rents and overstate older central east product. No citywide price to rent ratio is computed.
Homeowner vacancy of 0.93% says listings are thin. That can support resale liquidity if mortgage rates allow, though liquidity is not assured, and it means build to rent and resident buyers compete for the same inventory. Owner occupied units built in 2020 or later number 6,665. Renter occupied units built in 2020 or later number 6,479. New stock is split almost evenly between owners and renters in the occupied 2020 and later vintage, which is what a simultaneous apartment and subdivision boom looks like after the fact.
Redfin reports a median sale price of $459,650 for Colorado Springs over the three months ending June 2026, down 3.1% from the same period a year earlier. The Zillow Home Value Index for Colorado Springs was $448,511 as of July 31, 2026, down 1.6% over the past year. No public citywide average assessed value is published. Assessed value on an El Paso County roll will not equal contract price.
Four and five bedroom share is high (76,398 units). Military families are a qualitative demand story consistent with the interstate mover counts above.
Section 10Commercial Real Estate and Retail Centers
No public Colorado Springs office, industrial, or retail vacancy rate, asking rent, or cap rate is published.
Labor and land use still give direction. This is not a warehouse metro first. Trade, transportation, and utilities employment is 49,700 and falling 1.2% over 12 months. Industrial demand exists along Powers, the airport, and Interstate 25, but the BLS print does not describe a logistics boom. Defense contractors and space related users support flex and office near Peterson, Schriever, and the north gate of the Academy. Information jobs shrinking 14.0% is a warning for speculative office. Professional and business services growing 3.0% is the counterweight if those jobs occupy local space rather than home offices. ACS 2024 already counts 38,293 city residents who work from home, 15.20% of 251,902 workers.
Retail follows rooftops and visitors. ACS 2024 counts 209,874 households, median income $83,672, and 12.69% of households at $200,000 or more. Grocery anchored centers that serve growing north and east rooftops have a demographic backdrop. Tourism retail near Garden of the Gods, downtown, and the Broadmoor district has a seasonal backdrop that shows up in the June leisure and hospitality payroll lift. No public grocery anchored cap rate or occupancy figure is published. Outcomes vary by asset and are not assured.
Office in the downtown and north academy nodes can split between federal and contractor users who must be near a gate and a large work from home share. No public office vacancy percent is published for Colorado Springs.
Section 11Transactions and Capital Markets
No public 2025 or 2026 apartment, industrial, office, or retail transaction volume, median cap rate, or price per unit series is published for Colorado Springs.
What is public is the real economy tape. MSA payrolls up 0.8%, unemployment at 4.1%, county GDP at $55.1 billion in 2024, and a 3.07% rental vacancy describe a functioning, not frozen, market. They do not say what cap rate a 2022 vintage garden community trades at in 2026. National mortgage rate prints are not Colorado Springs specific and are omitted rather than borrowed from memory.
Debt markets, agency multifamily spreads, and life company appetite are national. The 2024 permit trough and 2025 rebound matter more for 2027 delivery risk than any unsourced cap rate would.
Section 12Taxes
Colorado has a state individual income tax and a local property tax. The Colorado Department of Revenue 2025 individual income tax rate is 4.4% of Colorado taxable income. The operating tax that matters for real estate is the property tax, stacked across city, county, school district, and special districts. El Paso County’s assessor appraises property. Each taxing unit sets a mill levy. No public combined mill levy for a typical Colorado Springs parcel is published.
Colorado’s residential assessment rate and Taxpayer Bill of Rights constraints are statewide design features that make mill levies and assessment ratios a legislative moving piece, not a fixed 2% Texas style story. Investment property does not receive homestead treatment. Budgeting tax as if the asset were an owner occupied residence is an underwriting error.
Special districts on the growth edge (roads, drainage, metropolitan districts) can add mills that a downtown parcel does not carry. Those overlay mills are why two houses with the same market value can produce very different tax bills in the same county.
Colorado does not rely on property tax alone the way Texas does, because it also taxes personal income at 4.4% in 2025. Household inbound migration math should include that state income tax. No household tax burden is estimated.
Section 13Insurance
No public average homeowners premium, average landlord premium, or year over year premium change is published for Colorado Springs or El Paso County. The Colorado Division of Insurance regulates admitted carriers.
Physical context is the underwriting issue. Colorado Springs sits at 6,011 feet on the eastern edge of the Southern Rocky Mountains, at the base of Pikes Peak, with a wildland urban edge on the west and north. Hail and convective storm are a Front Range constant. Wildfire is not theoretical. Neighborhoods near the mountain interface carry ember and evacuation risk that a prairie warehouse does not. No premium dollar or deductible percent is invented. Percentage wind and hail deductibles on commercial and landlord policies can turn a fully insured garden community into a large retention after one storm.
Flood is a Fountain Creek and drainage question, parcel by parcel, using FEMA maps. Upland mesas can still have local drainage issues. No public share of city parcels in the 1% annual chance floodplain is published.
Section 14Landlord Tenant and Regulatory Environment
Residential tenancies in Colorado are governed primarily by Colorado Revised Statutes Title 38, including warranty of habitability and security deposit rules. The code exists, it is state law, and it is the starting document for any leasing platform.
Colorado’s statewide tenant protection posture has, in recent legislative cycles, been more active than Texas Chapter 92. The educational point is that Colorado is not a low regulation default relative to Texas. Local governments along the Front Range have also debated short term rental limits and occupancy rules. No public Colorado Springs short term rental unit count or local rent cap is published.
Eviction is a court process. No public El Paso County eviction filing count or median days to possession figure is published.
Zoning, hillside overlay, wildfire mitigation requirements, and drainage rules can bind deals on the west side more than on the eastern plains. Those are local ordinances. Fair Housing Act rules apply. This review is not legal advice.
Section 15Infrastructure
Colorado Springs is an Interstate 25 city. The highway is the north south spine toward Denver and Pueblo. State Highway 24 runs east west. Powers Boulevard is the eastern relief corridor and a retail and apartment growth edge. The United States Air Force Academy, Interquest, and Briargate sit on the north Interstate 25 gate. Fort Carson sits south. Peterson Space Force Base and the airport sit east. That geometry, not a rail network, is how renter demand is arranged.
Colorado Springs Airport is the passenger air node. No public 2026 enplanement figure is published. ACS 2024 commute behavior says the system is a car city with a large work from home share.
| Means of transportation to work (ACS 2024, city workers) | Workers | Share of 251,902 |
|---|---|---|
| Drove alone | 179,779 | 71.37% |
| Carpooled | 24,391 | 9.68% |
| Public transportation | 2,187 | 0.87% |
| Walked | 3,574 | 1.42% |
| Worked from home | 38,293 | 15.20% |
| Other means (residual) | 3,678 | 1.46% |
Public transportation’s share is 0.87%. Work from home is 15.20%. Transit oriented rent premiums should be limited to places that actually have frequent service.
| Travel time to work (ACS 2024, workers not working from home) | Workers | Share of 213,609 |
|---|---|---|
| Less than 15 minutes | 52,546 | 24.60% |
| 15 to 29 minutes | 104,702 | 49.02% |
| 30 to 44 minutes | 36,200 | 16.95% |
| 45 to 59 minutes | 6,304 | 2.95% |
| 60 minutes or more | 13,857 | 6.49% |
| Total | 213,609 | 100.00% |
The 15 to 29 minute band is the majority. A 60 minute plus tail of 13,857 workers includes Denver bound commuters and long base gates. Congestion on Interstate 25 through the city is a known operating constraint. No public 2026 CDOT average annual daily traffic count is published.
Water is a Front Range constraint in a way that humid eastern metros do not face. Colorado Springs Utilities manages water, wastewater, electric, and gas for much of the city. No public impact fee or raw water tap fee is published as a single dollar figure. Growth on the eastern plains can carry metropolitan district debt and tap fees that infill on already served pipes does not.
Section 16Climate and Physical Risks
No public NOAA station normals table for Colorado Springs is published. The climate regime is high plains and mountain interface: intense sun, large daily temperature swings, winter snow and ice, spring wind, hail, and a wildfire season that can put smoke and embers into western neighborhoods. Elevation of 6,011 feet is the physical reason heating and cooling loads do not match a lowland Sun Belt garden.
Wildfire is the distinctive insurance and capex risk. West side and foothills parcels sit near wildland. Mitigation (defensible space, roof type, vent screening) can be a lender and carrier condition. No public FEMA National Risk Index score for El Paso County is published as a single figure.
Flood is concentrated on Fountain Creek and tributary drainages, not on a coastal surge. FEMA flood panels are the parcel tool. Hail is frequent enough on the Front Range that roof age and carrier appetite are operating variables, not footnotes.
Drought and water rights are a utilities and growth management issue. They show up as tap availability and restriction ordinances, not as a NOAA number in this document.
Section 17Neighborhoods and Submarkets
Colorado Springs is not one rent. ACS in this review is citywide. Neighborhood numbers below are qualitative because no public ACS slice by neighborhood is published.
The north Interstate 25 gate (Academy, Interquest, Briargate) is the newer household and contractor corridor: closer to the Air Force Academy, newer stock, and much of the 2010 and later inventory. This is where 2021 permits have been associated with new units. It is also where 2025's 5,707 county authorizations could show up again if completed.
The east Powers corridor and Banning Lewis Ranch are master planned growth, longer commutes to downtown, and a mix of detached houses and garden apartments. School district lines and metropolitan district mills matter more here than architecture.
Downtown, Old Colorado City, and the west side near Garden of the Gods mix older 1939 and earlier stock (10,909 city units), tourism, and hillside wildfire exposure. Value add and short stay narratives collide with insurance and parking.
The south side toward Fort Carson is the military renter and workforce band. Turnover can track postings more than downtown restaurant openings. Security and Widefield and Fountain, south of the city, are county edge alternatives that compete for the same soldier household. They are not in the city ACS counts.
Central and southeast tracts hold more 1970s and 1980s gardens (36,500 units citywide from 1970 to 1979, 34,824 from 1980 to 1989). That is the capex and hail deductible book.
Because neighborhood statistics are missing, this map is qualitative. It is not a substitute for parcel, school district, flood, and wildfire diligence.
Section 18Opportunities
The public record supports a few educational, non exhaustive observations.
First, occupied rental vacancy at 3.07% is scarce by 2026 Sun Belt standards. In place workforce and garden product facing that 3.07% city rental vacancy, rather than a much looser vacant for rent pool, has a structural occupancy backdrop versus that looser tape, provided insurance is obtainable. Occupancy and results are not assured.
Second, the 2024 permit trough (3,849 county units) followed a 2021 peak (9,186). If 2026 stays closer to 2024 than to 2021, the 2025 rebound to 5,707 does not have to recreate the last oversupply. That is a timing scenario, not a forecast or a guarantee, and it is not assured.
Third, military and federal demand shows up in 25,269 interstate movers and in government as the largest payroll supersector. One and two bedroom product near gates is a different, more turnover heavy sleeve than a downtown entertainment story. Recession resistance is not shown and not assured.
Fourth, education and health services jobs were up 6.2% over 12 months, the strongest supersector print. Medical office, workforce housing near hospital campuses, and need based retail have a labor market backdrop; occupancy and rent are not assured.
Fifth, 20,612 detached renter households already exist. Build to rent and scattered site SFR are not theoretical. They must clear a $479,500 median owner value, which is a higher bar than in cheaper industrial metros.
None of these points is a recommendation to buy.
Section 19Risks
HUD FY 2026 FMRs moved down versus FY 2025, including a 2.42% decline on the two bedroom standard. That is an official public sign that recent mover rents cooled even while ACS vacancy looks tight. New Class A that underwrites to prior year HUD two bedroom marks is fighting HUD’s own FY 2026 print.
County permits rebounded to 5,707 in 2025 after 3,849 in 2024. Corridor concentration could recreate local oversupply even if the citywide vacant for rent pool stays small.
Information jobs down 14.0% and other services down 7.9% are not a broad private boom. A thesis that needs software tenants is fighting the BLS print. Government jobs are also down 1.8%, so the federal sleeve is not a one way bid.
Rent burden is already high: 19,153 renter households spend 50% or more of income on gross rent. Pushing rents without wage growth raises delinquency risk, especially for junior enlisted households.
Insurance, especially hail and wildfire, can reprice net operating income faster than rents. No public premium index is published, which is itself a diligence flag.
Property tax overlays and metropolitan district mills on the growth edge are not in this document as a number and can surprise a model copied from a central parcel.
Colorado tenant statute and statewide politics are less landlord default than Texas. Legal diligence is not optional.
No public cap rate, asking rent index, or commercial occupancy rate is published. Decisions that need those figures are not supported by this document.
Section 20Investor Implications
Read Colorado Springs as a high elevation, military anchored, majority single family city with ACS median value of $479,500, median gross rent of $1,699, 3.07% rental vacancy, and only 0.8% payroll growth. The educational implication is to match strategy to that tape.
In place workforce gardens in the 1970 to 1989 vintage compete in a $1,699 median gross rent world with high existing burden and real insurance risk. Expense control is more central to that tape than a luxury asking rent story. No particular asking rent or return is shown or assured.
New Class A multifamily is a supply cycle trade against HUD FMRs that already moved lower into FY 2026 and against a 2025 permit rebound. Capital that can lease through new keys on the Powers and north Interstate 25 edges is in a different posture than a short horizon strategy that needs occupancy on day one. No particular occupancy, rent, cash flow, or investment return is promised or assured.
Military adjacent one and two bedroom product should be underwritten for turnover, not for near full occupancy every month of a deployment cycle. The ACS interstate mover count is the public mobility evidence. It is also a flag for turnover and make ready expense, not a proof of occupancy or return.
Single family rental must clear a higher entry value than in cheaper Sun Belt industrial cities. Twenty thousand plus detached renter households are the occupied comparable set.
Industrial is a supporting actor, not the lead, on a trade, transportation, and utilities payroll that is shrinking. Office needs a contractor or federal user, not a citywide occupancy thesis.
This section frames. It does not allocate capital.
Section 21Conclusion
Colorado Springs in 2026 is a city of 493,540 ACS residents inside an El Paso County of 757,040 people, with 333,600 MSA payroll jobs, 4.1% unemployment, $83,672 median household income, $479,500 median owner value, $1,699 median gross rent, and 3.07% rental vacancy. Health care hiring is strong. Information hiring is not. Housing supply peaked in 2021, bottomed in 2024, and rebounded in 2025. HUD two bedroom FMRs moved down into FY 2026 even as occupied vacancy looks scarce. The public record is strong on people, jobs, incomes, stock, HUD rents, and vacancy. It is weak on cap rates, asking rents, commercial occupancy, parcel mill levies, and insurance premiums. Tight vacancy and a military mover pool keep the city relevant as educational market context for accredited investors. Tight vacancy is not the same as cheap insurance or rising FMRs, is not an offer or solicitation, and no particular investment return is promised or assured.