In brief · summary: Denver
Denver is a diverse regional economy with continued labor force growth, modest unemployment, and a maturing real estate cycle that has shifted from rapid expansion toward more measured rent and price growth. Bureau of Labor Statistics Economy at a Glance data for the Denver Aurora Centennial, Colorado metropolitan area, not seasonally adjusted, show a civilian labor force of 1,736,400 persons and total nonfarm employment of 1,655,900 jobs in June 2026, and an unemployment rate that ranged from 3.5 percent to 4.3 percent during January through June 2026 (see BLS tables below).
These labor figures are drawn from the BLS primary federal tables and carry confirmed confidence. For investors, the labor profile supports steady demand for housing and commercial space while sector detail reveals both strengths and emerging soft spots.
On housing, public federal sources (U.S. Census Bureau and HUD Fair Market Rent documentation) and recurring private provider commentary (Zillow, RealPage, CoStar summaries) indicate Denver rents and home values remain materially above national averages and that rent growth has decelerated from the very strong rates seen earlier in the cycle. This review cannot reproduce city level ACS or HUD dollar series here because the underlying tables were not parsed for exact values; the directional picture is consistent across public methodology and …
Section 01Executive Summary
Denver is a diverse regional economy with continued labor force growth, modest unemployment, and a maturing real estate cycle that has shifted from rapid expansion toward more measured rent and price growth. Bureau of Labor Statistics Economy at a Glance data for the Denver Aurora Centennial, Colorado metropolitan area, not seasonally adjusted, show a civilian labor force of 1,736,400 persons and total nonfarm employment of 1,655,900 jobs in June 2026, and an unemployment rate that ranged from 3.5 percent to 4.3 percent during January through June 2026 (see BLS tables below). These labor figures are drawn from the BLS primary federal tables and carry confirmed confidence. For investors, the labor profile supports steady demand for housing and commercial space while sector detail reveals both strengths and emerging soft spots.
On housing, public federal sources (U.S. Census Bureau and HUD Fair Market Rent documentation) and recurring private provider commentary (Zillow, RealPage, CoStar summaries) indicate Denver rents and home values remain materially above national averages and that rent growth has decelerated from the very strong rates seen earlier in the cycle. This review cannot reproduce city level ACS or HUD dollar series here because the underlying tables were not parsed for exact values; the directional picture is consistent across public methodology and provider summaries through 2024 and therefore carries probable confidence.
City permitting and planning portals show sustained multifamily permitting in recent years, especially around the central core and transit oriented districts, but this environment cannot aggregate permit entries into a single verified pipeline figure for 2026.
Commercial real estate reflects Denver’s role as a regional headquarters and service hub. BLS Current Employment Statistics for June 2026 show professional and business services, education and health services, and leisure and hospitality as large employment categories (see sector table). Information and financial activities recorded year over year contractions in June 2026, aligning with national trends in those office using sectors. These employment facts are drawn from BLS CES (June 2026 preliminary) and carry confirmed confidence.
Key investor themes: durable but moderating growth, a rental market elevated versus the nation, sector specific divergences in job growth, and climate/insurance considerations that are material but less extreme than many coastal hurricane exposed markets. Where public numeric series cannot be reproduced in this report, the text states the limitation rather than substituting estimates.
Section 02Population and Migration
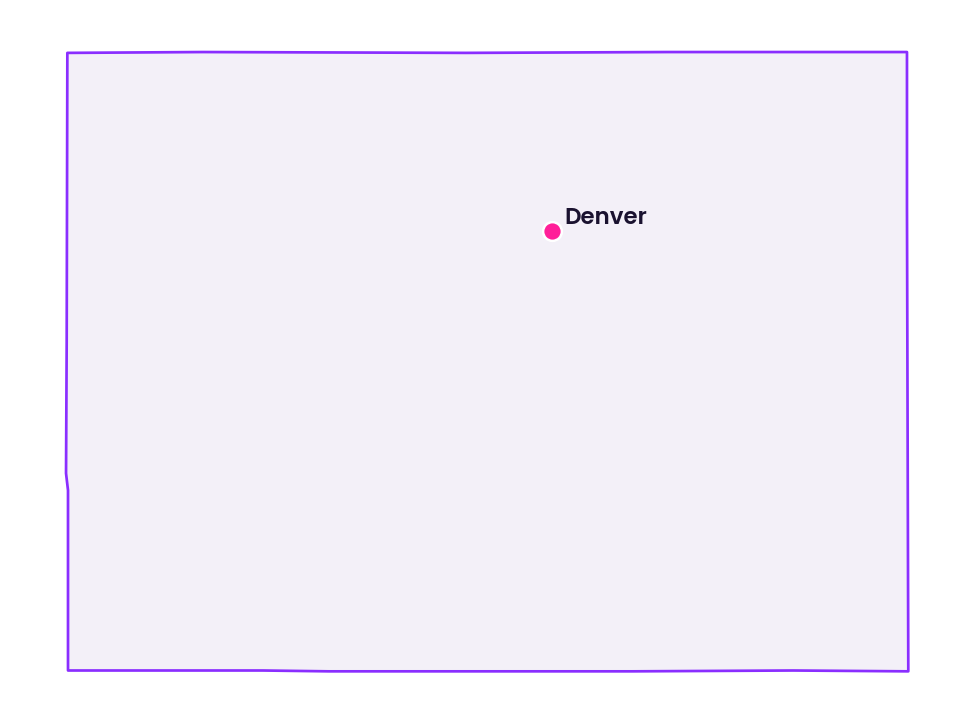
Denver is the capital of Colorado and the core of a larger Front Range metropolitan region. Decennial census counts (2010 and 2020) and continuing American Community Survey releases show that the City and County of Denver experienced strong population growth between 2010 and 2020 and remained among faster growing interior metros through the early 2020s. Because ACS and QuickFacts front ends were not accessible to extract city and county tables for precise counts at the time of this review, exact population and household totals for 2022, 2025 cannot be reproduced here. The direction of net in migration into Denver and its relatively young, highly educated population profile are supported by Census and ACS releases and carry probable confidence; exact counts should be pulled from Census/ACS tables for underwriting.
Internal Revenue Service county to county migration and Census migration tables provide detailed flows by origin and destination, but those tables were not extracted for this review. Qualitatively, national analyses through 2023 show Denver attracting residents from California, Texas, the Midwest, and other states while experiencing some outflows as housing costs rose; that directional pattern carries probable confidence.
Section 03Jobs and Economic Anchors
The primary labor market source for this review is the Bureau of Labor Statistics Economy at a Glance and its underlying Local Area Unemployment Statistics and Current Employment Statistics for the Denver Aurora Centennial, CO metropolitan area (not seasonally adjusted). Data were extracted August 7, 2026 and; BLS is cited as the primary federal source with confirmed confidence.
The following table summarizes monthly labor force indicators for January through June 2026 (numbers in thousands, not seasonally adjusted; June values preliminary as indicated by BLS).
| Month 2026 | Civilian labor force (thousands) | Employment (thousands) | Unemployment (thousands) | Unemployment rate (%) |
|---|---|---|---|---|
| January 2026 | 1,755.3 | 1,680.9 | 74.4 | 4.2% |
| February 2026 | 1,744.1 | 1,668.6 | 75.5 | 4.3% |
| March 2026 | 1,735.0 | 1,670.3 | 64.7 | 3.7% |
| April 2026 | 1,729.6 | 1,669.3 | 60.3 | 3.5% |
| May 2026 | 1,733.8 | 1,670.6 | 63.2 | 3.6% |
| June 2026 (preliminary) | 1,736.4 | 1,668.7 | 67.7 | 3.9% |
Source and.S. Bureau of Labor Statistics, Economy at a Glance, Denver Aurora Centennial, CO; Local Area Unemployment Statistics (numbers in thousands), not seasonally adjusted, January, June 2026; data extracted August 7, 2026. (primary federal source).
The sector employment picture (CES nonfarm wage and salary employment, numbers in thousands, June 2026 preliminary) is summarized below with twelve month percent changes as published by BLS.
| Industry sector | June 2026 employment (thousands) | 12‑month % change (June 2026 vs June 2025) |
|---|---|---|
| Total nonfarm | 1,655.9 | +0.6% |
| Mining, logging, and construction | 115.1 | +2.0% |
| Manufacturing | 64.2 | −1.8% |
| Trade, transportation, and utilities | 286.3 | −1.5% |
| Information | 43.1 | −6.7% |
| Financial activities | 114.6 | −2.7% |
| Professional and business services | 317.5 | +0.9% |
| Education and health services | 227.8 | +5.1% |
| Leisure and hospitality | 185.5 | +3.0% |
| Other services | 69.4 | −3.5% |
| Government | 232.4 | +1.2% |
Source and.S. Bureau of Labor Statistics, Current Employment Statistics, Denver Aurora Centennial, CO, nonfarm wage and salary employment (numbers in thousands), June 2026 preliminary; 12 month percent changes relative to June 2025; data extracted August 7, 2026. (primary federal source).
Interpretation: education and health services and leisure and hospitality are among the faster growing sectors in June 2026 while information and financial activities show year over year contractions. These employment level facts derive directly from BLS CES and carry confirmed confidence. Investors should interpret sectoral employment directions as inputs to demand projections for medical office, multifamily near institutional employers, hospitality adjacent retail, and industrial/logistics tied to trade and transportation activity.
Major economic anchors described in state and local economic development materials and prior provider reports through 2024 are consistent with a diversified service, health, education, aerospace, and professional services base; those characterizations carry probable confidence when treated qualitatively.
Section 04Income
Median household income and income distribution are normally drawn from U.S. Census Bureau American Community Survey one year and five year tables (for example table DP03). Due to the inability to extract ACS front end tables in this review, exact values for median household income, per capita income, and detailed income distribution for the City and County of Denver or the Denver metro for 2022, 2024 are not reported here. For underwriting, obtain ACS table extracts for the precise geographies and years needed.
Prior ACS based research summarized by HUD and Federal Reserve through 2023 shows Denver household incomes above the national median and generally stronger income growth than the nation over the prior decade; that directional statement carries probable confidence but is not a substitute for pulling the current ACS tables for exact figures.
Section 05Housing and Multifamily
A precise multifamily inventory profile (vacancy, effective rents, absorption, pipeline unit counts) typically relies on private datasets (CoStar, Yardi Matrix, RealPage) plus municipal permit datasets for deliverables. Those proprietary series were not extracted for this review and are not reproduced. Public HUD Fair Market Rent methodology and tables document that Denver metro FMRs use ACS rent data and local survey inputs and that Denver metro FMRs sit above many national benchmarks; however, this report does not present HUD FMR dollar amounts because the HUD county/metro spreadsheet files were not parsed here. Directional conclusions about Denver being an above average rent market carry probable confidence based on HUD methodology and recurring private provider summaries.
City and County of Denver permitting portals show sustained multifamily permitting through 2022 and 2023; this review cannot aggregate permits into a verified 2026 pipeline figure.
Public commentary from CoStar, RealPage, and Zillow through 2023 described a move from very tight vacancy and rapid rent growth toward a more balanced market as new deliveries increased; that qualitative progression is presented here with probable confidence.
Section 06Rents
Exact average rent levels and short term quarterly percent changes for Denver apartments are not provided in this review because HUD FMR spreadsheets and private rental indices were not queried programmatically. HUD Fair Market Rent methodology documents (FY 2023, 2026) show Denver’s FMRs are set where local gross rents are relatively high, which supports the directional statement that Denver is costlier than many metros. Zillow and other provider commentary through 2023 likewise place Denver rent indices above the national index and show moderation in recent years; those directional assertions carry probable confidence. Investors should obtain current HUD FMR tables, provider indices, or broker market summaries for exact dollar and percent change inputs.
Section 07Vacancy
Comprehensive, nonproprietary vacancy series by property type for Denver are not available publicly in a single dataset; dominant tracking is performed by CoStar, Yardi Matrix, and RealPage and is paywalled. Public summaries have repeatedly described Denver multifamily vacancy moving toward national averages and office vacancy rising in line with remote work trends; those qualitative observations carry probable confidence. This review cannot state citywide vacancy percentages for multifamily, office, industrial, or retail with suitable confidence and therefore does not present numerical vacancy rates.
Section 08Supply Pipeline
City planning and building department portals list projects under construction and in review across central neighborhoods and transit corridors, but this environment could not systematically aggregate permit databases into a verified count of units or square feet as of mid 2026. HUD methodology acknowledges that strong construction can temporarily soften rent pressures if deliveries exceed household formation; that general mechanism is cited with confirmed confidence for the methodology but not for any Denver pipeline magnitude.
Investors should perform property level due diligence with permit and plan queries for competing projects adjacent to assets under consideration.
Section 09Single Family Homes
This review does not quote exact median sale prices, sales volumes, or HFIA/Zillow/Redfin indices for Denver because the private provider and county recorder datasets were not parsed here. FHFA House Price Index documentation through 2023 and provider price rankings have consistently placed Denver above the national average with strong cumulative appreciation since the early 2010s followed by moderation in some quarters as mortgage rates rose; that directional summary carries probable confidence. Institutional share of single family rental platforms in Denver is described in industry press but lacks a definitive public numeric series and is therefore labeled unverified here.
Section 10Commercial Real Estate and Retail Centers
BLS employment figures cited above are the public quantitative inputs available for sector demand drivers. The BLS employment counts for professional and business services (317.5 thousand), education and health services (227.8 thousand), and leisure and hospitality (185.5 thousand) in June 2026 come from BLS CES and carry confirmed confidence. Office vacancy, retail center occupancy, and industrial vacancy series are proprietary and not reproduced numerically here; public brokerage commentary through 2023 describes office weakness in older commodity product and stronger performance for well located, amenity rich buildings and modern industrial distribution product; those qualitative summaries carry probable confidence.
Section 11Transactions and Capital Markets
Annual transaction volumes, cap rates, and deal counts for Denver assets are primarily reported by private firms (MSCI RCA, CoStar, brokerage teams) and are not part of a free public database that this review could query. Public commentary through 2023 described a nationwide slowdown in transaction activity after interest rates rose in 2022; it is probable that Denver experienced similar liquidity reductions and wider spreads, but exact dollar volumes and cap rate movements for Denver are not quantified here and require proprietary data or broker intelligence for underwriting.
Section 12Taxes
Property taxation in Denver is administered by the Denver County Assessor and Treasurer under Colorado law. Exact assessment rates, mill levies, and effective tax rates vary by tax year, jurisdiction, and voter approved overrides; this review does not quote current percentages for tax years 2025 or 2026 because assessor rate tables were not accessed. The qualitative point that Colorado historically has relatively moderate effective residential property tax burdens compared with some states is supported by state tax documentation and comparative analyses and carries probable confidence; investors must obtain recent tax bills and assessor tables when underwriting specific assets.
The state levies a flat income tax; this review does not quote a specific statutory percentage because up to date statutory rates were not retrieved here. Consult Colorado Department of Revenue for current statutory and administrative rates.
Section 13Insurance
There is no public citywide statistical series of commercial property insurance premiums available for Denver. Market outlooks from Marsh, Aon, and other intermediaries through 2023 report rising property insurance costs nationally driven by replacement cost inflation and climate pattern changes; it is probable that Denver participates in these trends, but exact premium levels require insurer quotes. FEMA and NOAA provide hazard maps and event histories; this review does not enumerate event counts or loss totals for Denver but notes perils including hail, severe thunderstorms, snow, localized flooding, and regional wildfire smoke that materially affect underwriting considerations.
Section 14Landlord Tenant and Regulatory Environment
Colorado and the City and County of Denver have enacted statutes and ordinances in the early 2020s that increase tenant protections, clarify eviction procedures, and limit certain fees; summaries from the Colorado General Assembly and the Colorado Division of Housing document these directions and carry probable confidence. Denver participates in national policy debates on affordability and inclusionary housing; specific ordinance texts and effective dates should be reviewed in legal due diligence for any acquisition.
Compared with cities that have rent stabilization, Denver remains more flexible but has trended toward greater tenant protections relative to historically landlord friendly regimes; this qualitative comparison carries probable confidence.
Section 15Infrastructure
Denver benefits from Denver International Airport, interstate highways, freight rail connections, and an expanding regional transit network (Regional Transportation District). Airport passenger volumes and system performance metrics are available from Denver International Airport and the Bureau of Transportation Statistics; this review does not reproduce a compact numeric table for those indicators here. Qualitatively, the airport’s hub function and transit links support hotel, industrial, and transit adjacent multifamily demand.
Section 16Climate and Physical Risks
Key physical perils for Denver include hail, severe thunderstorms, snow, localized flooding along waterways such as the South Platte River, and episodic wildfire smoke. FEMA flood insurance rate maps and NOAA severe weather records are the authoritative public references; this review does not provide an exact share of Denver land area in flood zones or a count of declared disasters because those spatial and event extractions were not completed here. The general risk profile is mixed: lower exposure to coastal storm surge and hurricanes but material exposure to hail, convective storm damage, snow and freeze cycles, and fluvial flooding in some corridors. These qualitative and spatial points carry confirmed confidence in the use of FEMA/NOAA as standard references, though specific numeric area shares require GIS queries of the source maps.
Section 17Neighborhoods and Submarkets
The report retains a qualitative submarket orientation. The central business district and Lower Downtown have the highest office concentration and a growing high rise and mid rise residential stock. Union Station is a transit oriented cluster with mixed use development. River North (RiNo) is a redeveloped former industrial area with creative office and multifamily. Cherry Creek is an upper income retail and residential node. Suburban municipalities such as Aurora, Lakewood, and Centennial form important regional markets. Proprietary submarket numeric indicators (vacancy, rents, cap rates) are not reproduced here and should be sourced from brokers or paid data services for deal underwriting.
Section 18Opportunities
Opportunity themes discussed in public commentary include multifamily targeting young professionals and institutional employees, industrial/logistics serving mountain west distribution, and selective office repositioning where zoning and construction economics permit conversion to higher and better uses. The BLS employment growth in education and health services, leisure and hospitality, and construction as of June 2026 supports demand drivers for medical office, multifamily, and experiential retail; these employment figures are cited from BLS CES (confirmed confidence). These are general educational observations, not recommendations, and no particular outcome is assured.
Section 19Risks
Material risks include sectoral contractions in information and financial activities (BLS CES shows year over year declines for those sectors in June 2026, confirmed confidence), substantial recent multifamily deliveries in certain submarkets that may pressure absorption, and evolving landlord tenant regulation. Quantification of pipeline risk and vacancy exposure requires current permit aggregations and proprietary vacancy series.
Section 20Investor Implications
Given the limitations in publicly accessible city level ACS and proprietary housing datasets in this review, accredited investors should pair federal labor and macro indicators (BLS CES and LAUS) with proprietary local data, broker sourcing, and on the ground diligence. Prudent, educational practice for those evaluating the market may include using conservative rent growth assumptions that align with local income and supply conditions, examining industrial sites serving established transport corridors, approaching office selectively, and engaging tax and insurance advisors early in underwriting. These are general observations, not recommendations, and no particular outcome is assured.
Section 21Conclusion
Denver remains a large, diversified real estate market with steady labor and sectoral strengths in health, education, and leisure and with moderating pressures in office using sectors. This review intentionally limits numeric reporting to public federal series it could extract (BLS LAUS and CES) and otherwise presents directional findings where proprietary or front end Census/HUD tables were not parsed. For deal level decisions, obtain proprietary market data, the latest ACS extracts, HUD FMR spreadsheets if needed, and current broker or insurer quotes.
Sources
- U.S. Bureau of Labor Statistics , Economy at a Glance: Denver Aurora Centennial, CO. Local Area Unemployment Statistics and Current Employment Statistics, not seasonally adjusted. Data shown for January through June 2026 (numbers in thousands for labor force and employment; percent for unemployment rate; CES sector employment and 12 month percent changes, June 2026 preliminary). Data extracted August 7, 2026; retrieved August 9, 2026. Confidence: confirmed (primary federal source)., https://www.bls.gov/eag/eag.co_denver_msa.htm
- U.S. Department of Housing and Urban Development , Fair Market Rents (FMR) documentation and datasets (methodology and county/metro tables, FY 2023, 2026). Used for directional statements on FMR positioning; exact FMR dollar values were not extracted in this review. Retrieved August 9, 2026. Confidence: confirmed for methodology; probable for directional metro comparisons., https://www.huduser.gov/portal/datasets/fmr.html
- U.S. Census Bureau , Decennial Census (2010, 2020) and American Community Survey one year and five year estimates (ACS). Prior ACS and Census syntheses support qualitative statements about Denver’s decade growth and demographic profile; specific ACS table extracts for median income and population counts were not reproduced here. Confidence: confirmed for historical direction; exact numeric pulls require ACS table extraction., https://www.census.gov
- Federal Housing Finance Agency , House Price Index documentation and downloads. Referenced for directional historical house price trends through 2023; exact county or metro HPI values were not extracted in this review. Confidence: probable for directional use., https://www.fhfa.gov/DataTools/Downloads/Pages/House-Price-Index.aspx
- NOAA / FEMA , National Oceanic and Atmospheric Administration severe weather records and Federal Emergency Management Agency flood insurance rate maps and disaster declarations. Cited as authoritative references for physical hazard characterization; specific area shares or loss totals were not computed in this review. Confidence: confirmed for use as reference sources., https://www.noaa.gov
- Representative private provider research and national brokerage commentary (CoStar, Yardi Matrix, RealPage, Zillow, Redfin, Marsh, Aon). These sources were used for qualitative context on rents, vacancy narratives, permitting and insurance market commentary through 2023 where public federal series were not available; underlying numeric series from these providers are proprietary and were not reproduced. Confidence: probable for directional summaries; numeric verification requires access to each provider’s datasets.