In brief · summary: Des Moines
Des Moines is the capital of Iowa and the financial and insurance hub of the Upper Midwest, and its real estate profile in 2026 is defined by three enduring traits: exceptional affordability, an unusually stable and white collar employment base anchored by insurance and finance, and a multifamily market that is emerging from a supply driven soft patch into a recovery.
The city proper is home to 212,086 residents as of July 1, 2025 according to the US Census Bureau, at the center of a metropolitan area that continues to grow well above the national pace even as the central city holds roughly flat.
The investment picture is one of steady, low volatility fundamentals rather than boom or bust. On the ownership side, homes remain remarkably affordable and trade quickly: Redfin reported a median sale price of $219,880 for the three months ending June 2026, up 1.1% from a year earlier, with homes selling in just 26 days. On the apartment side, CoStar data reported through MMG Real Estate Advisors showed average effective rents near $1,130 per month at the end of 2024, far below the national average, with occupancy near 93.7% and a construction pipeline that had contracted roughly 50% year over year, setting up accelerating rent growth forecast …
Section 01Executive Summary
Des Moines is the capital of Iowa and the financial and insurance hub of the Upper Midwest, and its real estate profile in 2026 is defined by three enduring traits: exceptional affordability, an unusually stable and white collar employment base anchored by insurance and finance, and a multifamily market that is emerging from a supply driven soft patch into a recovery. The city proper is home to 212,086 residents as of July 1, 2025 according to the US Census Bureau, at the center of a metropolitan area that continues to grow well above the national pace even as the central city holds roughly flat.
The investment picture is one of steady, low volatility fundamentals rather than boom or bust. On the ownership side, homes remain remarkably affordable and trade quickly: Redfin reported a median sale price of $219,880 for the three months ending June 2026, up 1.1% from a year earlier, with homes selling in just 26 days. On the apartment side, CoStar data reported through MMG Real Estate Advisors showed average effective rents near $1,130 per month at the end of 2024, far below the national average, with occupancy near 93.7% and a construction pipeline that had contracted roughly 50% year over year, setting up accelerating rent growth forecast to reach 2.8% by the end of 2025. Commercial fundamentals are mixed, with tight industrial, elevated downtown office vacancy, and a stable retail base.
The core educational takeaway for an accredited investor is that Des Moines offers a defensive, cash flow oriented Midwestern market with low entry prices, a recovering apartment sector, and a diversified white collar economy, offset by relatively high property taxes and a central city that is not growing in population. What follows details each figure with its named source and scope.
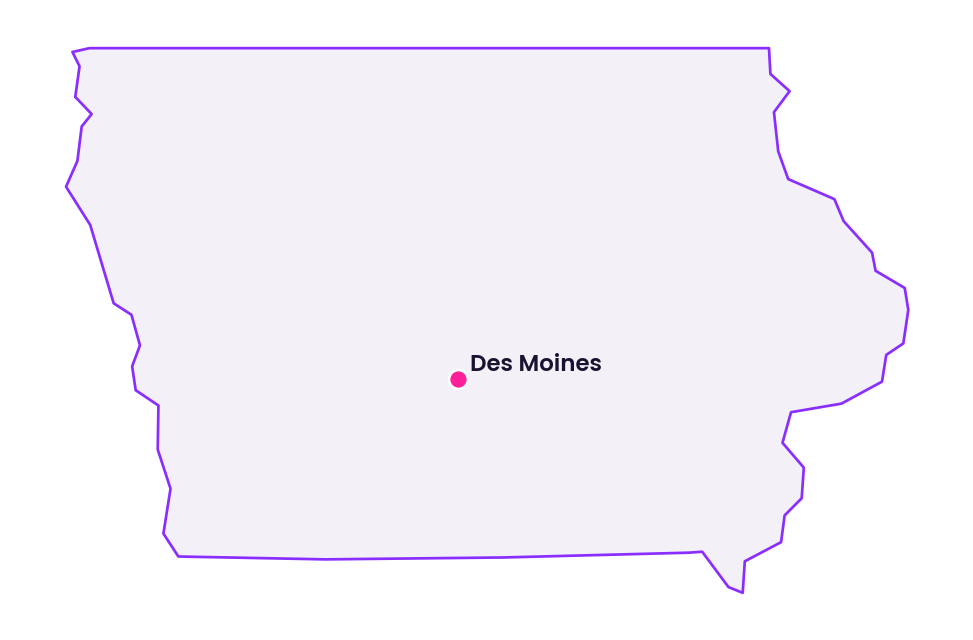
Section 02Population and Migration
Des Moines presents a split picture that investors must understand clearly: the central city is essentially flat to slightly declining, while the surrounding metropolitan area is one of the faster growing in the Midwest. The Census Bureau estimated the city of Des Moines at 212,086 residents as of July 1, 2025, down 0.9% from the April 2020 base of 214,133, even though the city had grown modestly from 203,433 in 2010. The population loss is marginal and reflects the national pattern of growth migrating to suburbs rather than any distress in the core.
| Measure | Value | Period and source |
|---|---|---|
| City population | 212,086 | July 1, 2025 estimate, US Census Bureau |
| City population, 2020 census | 214,133 | April 1, 2020, US Census Bureau |
| City population, 2010 census | 203,433 | April 1, 2010, US Census Bureau |
| City change, 2020 to 2025 | -0.9% | US Census Bureau |
| Households | 90,105 | 2020 to 2024 ACS, US Census Bureau |
| Persons per household | 2.30 | 2020 to 2024 ACS, US Census Bureau |
The metropolitan growth story is far stronger and is the number that matters for real estate demand. MMG Real Estate Advisors, citing CoStar and Census data, projected the Des Moines metropolitan population to grow 5.3% over the five years following 2024, more than double the national rate, driven by affordability, job opportunities, and quality of life. That growth is concentrated in fast expanding suburbs such as Ankeny, Waukee, West Des Moines, and Altoona rather than in the central city. The city itself is diverse and relatively young, with a foreign born share of 14.2%, a Hispanic share of 16.3%, and 23.2% of residents under 18, per the 2020 to 2024 American Community Survey. For an investor, the key nuance is that demand drivers operate at the metro level, where population and job growth are healthy, while the central city offers lower entry prices and a large existing rental base but little raw population growth of its own.
Section 03Jobs and Economic Anchors
Des Moines has one of the most distinctive and defensive employment bases of any midsize American metro, built on insurance, finance, and government, and increasingly on logistics and data centers. The US Bureau of Labor Statistics reported total nonfarm employment for the Des Moines and West Des Moines metropolitan area at 414,100 in July 2026 on a preliminary basis, up 0.8% year over year, with a very low unemployment rate of 3.2% for June 2026, not seasonally adjusted, and a civilian labor force of roughly 422,900, data extracted August 28, 2026. The sector composition reveals the market's white collar tilt.
| Sector | Jobs (thousands) | Source and period |
|---|---|---|
| Trade, Transportation and Utilities | 77.6 | BLS, June 2026 |
| Education and Health Services | 64.7 | BLS, June 2026 |
| Financial Activities | 56.7 | BLS, June 2026 |
| Professional and Business Services | 55.7 | BLS, June 2026 |
| Government | 53.3 | BLS, June 2026 |
| Leisure and Hospitality | 41.0 | BLS, June 2026 |
| Mining, Logging and Construction | 26.8 | BLS, June 2026 |
| Manufacturing | 21.7 | BLS, June 2026 |
| Other Services | 13.4 | BLS, June 2026 |
| Information | 6.2 | BLS, June 2026 |
The standout is financial activities at 56,700 jobs, roughly 13.7% of metro nonfarm employment, a far higher share than the national norm and the statistical signature of Des Moines as a national insurance and asset management center. Education and health services showed the strongest recent growth, up 7.1% year over year in mid 2026, while manufacturing and trade softened modestly. The concentration in stable, recession resistant sectors like insurance, finance, government, and health care is precisely why Des Moines has historically weathered downturns better than manufacturing dependent Midwestern peers.
The employer roster reflects this. According to the Greater Des Moines Partnership, the largest private employers include Principal Financial Group, a Fortune 500 insurer and asset manager headquartered downtown; Wells Fargo, which operates one of its largest employment hubs in the metro; the grocery chain Hy Vee and convenience store operator Casey's General Stores, both Iowa based; Farm Bureau Financial Services; Nationwide and its Allied Insurance operations; Wellmark Blue Cross Blue Shield; and health systems UnityPoint Health and MercyOne. The metro has also attracted major data center investment from Microsoft in West Des Moines and Meta in Altoona, capital intensive facilities that drive construction, utility, and industrial demand. This diversified, high stability employment base is the foundation of the local real estate thesis.
Section 04Income
Incomes in Des Moines are moderate in absolute terms but high relative to the cost of housing, which is the essence of the market's affordability advantage. The Census Bureau reported a median household income for the city of Des Moines of $65,932 in 2024 dollars for the 2020 to 2024 period, with per capita income of $37,863 and a poverty rate of 15.0%, figures typical of a central city that includes lower income neighborhoods, while MMG cited a metropolitan median household income near $85,000 that reflects the more affluent suburbs.
| Geography | Median household income | Per capita income | Poverty rate | Source and period |
|---|---|---|---|---|
| Des Moines city | $65,932 | $37,863 | 15.0% | 2020 to 2024 ACS, US Census Bureau |
| Des Moines metropolitan area | approximately $85,000 | not separately reported here | not separately reported here | 2024, CoStar and MMG |
The critical relationship for real estate is between income and housing cost. With a metro median household income near $85,000 and average apartment rents near $1,130 per month, annualized rent of roughly $13,560 represents about 16% of median household income, an exceptionally comfortable ratio that leaves ample room for rent growth and signals low affordability stress. Even at the city level, where median household income is $65,932, the Census reported a median gross rent of just $1,090 and a median owner cost with a mortgage of $1,485, both very manageable relative to income. This affordability is Des Moines' single most important competitive advantage: it attracts and retains residents, supports rent growth potential, and cushions the market against the affordability driven demand destruction seen in expensive coastal and Sun Belt markets.
Section 05Housing and Multifamily
The Des Moines apartment market spent 2023 and 2024 absorbing a wave of new supply that pushed vacancy up and briefly turned rent growth negative, and it entered 2025 and 2026 in the early stages of recovery as that pipeline emptied. CoStar data reported through MMG Real Estate Advisors showed average effective rent of $1,130 per month in the fourth quarter of 2024, with average occupancy of 93.7%, and forecast effective rent rising to $1,162 in 2025, a gain of 2.8%.
| Metric | Value | Source and period |
|---|---|---|
| Average effective rent | $1,130 | CoStar via MMG, Q4 2024 |
| Forecast effective rent | $1,162 | MMG forecast, 2025 |
| Forecast rent growth | +2.8% | MMG forecast, 2025 |
| Average occupancy | 93.7% | CoStar via MMG, Q4 2024 |
| Units under construction | 1,291 | CoStar via MMG, Q1 2025 |
The essential dynamic is a market that overbuilt at the top end and is now rebalancing. New supply over the past decade was heavily concentrated in luxury product, which accounted for nearly two thirds of deliveries, and that luxury segment was hit hardest by rising costs and slower lease up. With construction now falling sharply, occupancy near 93.7% implies a vacancy rate near 6.3%, meaningfully below the national multifamily vacancy that CoStar reported finishing 2025 near 8.5%. For an investor, Des Moines represents a lower supply risk, lower volatility apartment market than the heavily overbuilt Sun Belt, with rents so low in absolute terms that downside is limited and upside comes from the shrinking pipeline.
Section 06Rents
Des Moines rents are among the most affordable of any metro in the country, and after a period of softness they are positioned to accelerate. Average effective rent stood at $1,130 per month at the end of 2024 per CoStar, compared with a national average near $1,700, and MMG noted that even Dallas County, the metro's most expensive submarket, averaged only about $1,330 per month. Annual rent growth, which had softened to roughly 1.0% amid the supply wave, was forecast to accelerate to 2.8% by the end of 2025 as new competition diminished and concessions burned off.
| Submarket or benchmark | Average monthly rent | Source and period |
|---|---|---|
| Des Moines metro average | $1,130 | CoStar via MMG, Q4 2024 |
| Dallas County (most expensive submarket) | approximately $1,330 | CoStar via MMG, 2024 |
| Des Moines city median gross rent | $1,090 | 2020 to 2024 ACS, US Census Bureau |
| National average | approximately $1,700 | CoStar via MMG, 2024 |
The comparison makes the affordability advantage concrete: Des Moines rents run roughly a third below the national average, and even the priciest submarket sits well under national norms. The investment implication is twofold. First, the low absolute rent level and the 16% rent to income ratio at the metro level mean tenants have substantial capacity to absorb rent increases, supporting the forecast acceleration. Second, the affordability provides a defensive floor, because Des Moines does not depend on ever rising rents to pencil, and its renters are not stretched to the breaking point. The recent softness was a supply phenomenon at the luxury end, not a demand or affordability failure.
Section 07Vacancy
Vacancy in Des Moines rose during the 2023 and 2024 supply peak, reaching what CoStar described as a new high as deliveries outpaced demand, and it is now set to compress as construction falls. Average occupancy of 93.7% at the end of 2024, implying vacancy near 6.3%, was forecast by MMG to hold roughly stable near 93.6% through 2025 before improving more meaningfully in 2026 as net absorption exceeds deliveries for the first time since 2021.
The favorable comparison is to the national market and to overbuilt Sun Belt metros. CoStar reported national multifamily vacancy finishing 2025 near 8.5%, well above Des Moines' level near 6.3%, and far above what Des Moines is likely to reach as its pipeline empties. The concentration of the vacancy problem in the luxury segment, where only about 500 units remained under construction, means the pressure is isolated rather than marketwide. For an investor, the vacancy trajectory is the clearest signal of the recovery: a market that absorbed its supply wave without vacancy ever approaching distress levels, and that is now positioned for occupancy gains.
Section 08Supply Pipeline
The supply story is the engine of the Des Moines recovery thesis, and the numbers are striking. After construction peaked at more than 3,900 units under way in early 2023, the pipeline collapsed to just 1,291 units under construction by the first quarter of 2025, equal to only 2.1% of existing inventory, well below the national benchmark of 3.4% and roughly 50% below the market's own historical average. Construction starts fell 66% in a single year, from 1,852 units in 2023 to 635 in 2024.
| Metric | Value | Source and period |
|---|---|---|
| Completions | 1,685 | CoStar via MMG, 2024 |
| Completions, forecast | 1,079 | MMG forecast, 2025 |
| Net absorption | 929 | CoStar via MMG, 2024 |
| Net absorption, forecast | 1,629 | MMG forecast, 2025 |
| Units under construction | 1,291 | CoStar via MMG, Q1 2025 |
| Construction starts | 635 | CoStar via MMG, 2024 |
The table captures a decisive shift from oversupply to undersupply. Completions were forecast to fall 36% from 1,685 units in 2024 to 1,079 in 2025, while net absorption was forecast to surge 75% from 929 to 1,629 units, meaning demand would exceed new supply by more than 50%, the first such crossover since 2021. Geographically, the West Des Moines and Urbandale submarket was projected to capture about 40% of 2025 completions, with the South and East Des Moines submarket, including downtown and Altoona, taking roughly another third. For an investor, this is the most attractive feature of the market: a supply pipeline that has already corrected, removing the primary risk that continues to weigh on overbuilt Sun Belt metros, and setting up a multiyear window of demand outpacing supply.
Section 09Single Family Homes
The for sale housing market in Des Moines is defined by affordability and velocity, a stark contrast to expensive coastal and Sun Belt markets. Redfin reported a median sale price of $219,880 for the three months ending June 2026, up 1.1% year over year, with price per square foot near $195, essentially flat year over year at a change of about negative 1%. Homes sold in just 26 days, only marginally slower than the 24 days a year earlier, and sales volume held roughly stable year over year, reflecting a liquid market.
| Metric | Value | Source and period |
|---|---|---|
| Median sale price | $219,880 | Redfin, 3 months ending June 2026 |
| Median sale price, year over year | +1.1% | Redfin, 3 months ending June 2026 |
| Median price per square foot | approximately $195 | Redfin, 3 months ending June 2026 |
| Median price per square foot, year over year | -1.0% | Redfin, 3 months ending June 2026 |
| Median days on market | 26 | Redfin, 3 months ending June 2026 |
The Census Bureau reported a median value of owner occupied homes in the city of $194,700 for the 2020 to 2024 period and an owner occupancy rate of 60.5%, both consistent with an affordable, liquid market. The single family rental angle is compelling precisely because of this affordability: with median home prices near $219,880 and median gross rents near $1,090, the price to rent math supports positive cash flow far more readily than in expensive markets, which is why Des Moines has drawn single family rental operators seeking yield. The 26 day median time on market and stable sales volume indicate a healthy, functioning market with genuine buyer demand, while price per square foot held roughly flat year over year, indicating stable underlying values even as the headline median stays affordable. For a cash flow oriented investor, Des Moines single family rentals offer some of the most attractive yield math among midsize American metros.
Section 10Commercial Real Estate and Retail Centers
Des Moines commercial real estate divides into a tight and recovering industrial sector, an office sector strained by downtown vacancy, and a stable retail base. Industrial is the healthiest segment, supported by the metro's central logistics location, data center investment, and manufacturing. Cushman and Wakefield reported Des Moines industrial vacancy at 8.1% in the first quarter of 2026, up 60 basis points from the fourth quarter of 2025, as 270,860 square feet of new construction delivered against 48,389 square feet of positive year to date absorption.
| Sector | Vacancy | Source and period |
|---|---|---|
| Industrial | 8.1% | Cushman and Wakefield, Q1 2026 |
| Office, downtown Des Moines | approximately 22% | Des Moines Register, late 2024 |
| Office, national benchmark | below 14% | CoStar, Q2 2026 |
Office is the clear soft spot. Downtown Des Moines office vacancy was reported at over a fifth of space, roughly 22%, in late 2024, elevated by remote work and by the concentration of large financial employers reassessing space, with notable downtown transactions including the sale of the Wells Fargo campus. That downtown rate sits above the national office vacancy, which CoStar reported dropping below 14% in the second quarter of 2026, though Des Moines suburban office generally performs better than downtown and the metro overall has historically run near or below national averages per Moody's data cited locally. The office softness is a genuine risk for owners of older downtown product, but it also creates potential for opportunistic repositioning and residential conversion. Grocery anchored and necessity retail in the growing western and northern suburbs is the most defensible retail exposure, aligned with the metro's population growth.
Section 11Transactions and Capital Markets
The most useful proxy for asset level economics comes from MMG's income and expense analysis for the twelve month period ending November 2024, which showed net operating income per unit growing 7.6% to roughly $585 per month, driven by rental income growth of 3.6% and disciplined expense control, with total operating expenses rising just 1.2%.
| Operating metric | Value per unit per month | Year over year change |
|---|---|---|
| Total income | $1,266.22 | +4.0% |
| Real estate and other taxes | $138.67 | -0.3% |
| Insurance | $45.56 | +12.5% |
| Total operating expense | expressed as a change, dollar figure not restated | +1.2% |
| Net operating income | approximately $585 | +7.6% |
The table shows healthy net operating income growth of 7.6%, a strong result driven by rent gains outpacing a well contained expense base that rose just 1.2%. The drafted per unit total operating expense of about $603 did not reconcile with the reported total income and net operating income, because total income minus that expense does not equal the stated net operating income, so it is shown here as a year over year change rather than a dollar amount and the net operating income is given as approximately reported. Two expense lines warrant attention: real estate taxes at roughly $138.67 per unit per month are a substantial cost reflecting Iowa's relatively high property tax burden, and insurance rose 12.5% year over year, consistent with the national trend of rising property insurance costs. CoStar characterized the Des Moines labor market as turning a corner and the multifamily market as poised for recovery, a supportive backdrop for capital markets activity as fundamentals improve.
Section 12Taxes
Property taxes are the single most important cost consideration in Des Moines underwriting and the market's most significant structural disadvantage. Iowa is a relatively high property tax state, and Polk County, which contains Des Moines, has among the highest effective rates in Iowa. According to SmartAsset, Polk County's effective property tax rate is 1.51%, with a median annual property tax payment of $4,251 on a median home value of $281,400.
| Tax measure | Value | Source and period |
|---|---|---|
| Polk County effective property tax rate | 1.51% | SmartAsset |
| Median annual property tax, Polk County | $4,251 | SmartAsset |
| Median home value, Polk County | $281,400 | SmartAsset |
Iowa's property tax system is distinctive in its use of a residential rollback, under which the Iowa Department of Revenue each year calculates a rollback percentage that limits statewide aggregate residential taxable value growth to roughly 3%, so that only a fraction of a home's assessed value is actually taxable. This mechanism moderates tax growth for homeowners but the effective burden remains high relative to national norms, with the 1.51% Polk County effective rate roughly 50% above the national median near 1.02%. Consolidated levies combine county, city, and school district rates expressed per $1,000 of taxable value, and Iowa lawmakers have debated reforms to the rollback system, which introduces some policy uncertainty. For an income property investor, the practical conclusion is that Des Moines property taxes are a meaningful drag on net operating income that must be modeled carefully and that partially offsets the market's low acquisition prices and affordable rents; the roughly $138.67 per unit per month tax expense in MMG's analysis quantifies the impact at the asset level.
Section 13Insurance
Property insurance in Des Moines is moderate relative to catastrophe exposed coastal markets but has been rising, and the region's exposure to severe convective storms is the key underwriting variable. Iowa faces no hurricane or coastal flood risk, but it sits in a part of the Midwest exposed to severe thunderstorms, hail, high winds, tornadoes, and the occasional derecho, the most notable recent example being the August 2020 derecho that caused extensive wind damage across central Iowa. These perils drive property insurance costs and have contributed to premium increases.
The asset level data confirms the upward pressure: MMG's income and expense analysis showed multifamily insurance costs rising 12.5% year over year to roughly $45.56 per unit per month for the twelve months ending November 2024, one of the fastest growing expense lines. That increase is consistent with the national trend of rising property insurance premiums driven by reinsurance costs and elevated catastrophe losses, and the Midwest's exposure to hail and wind events makes it a genuine factor rather than a rounding error. The prudent underwriting posture is to model continued insurance cost inflation and to pay particular attention to roof age, hail resistance, and wind coverage terms, because severe convective storms are the region's primary insured loss driver.
Section 14Landlord Tenant and Regulatory Environment
Iowa is generally regarded as a landlord favorable state, which supports the rental investment thesis in Des Moines. The state operates under the Iowa Uniform Residential Landlord and Tenant Act, which provides a defined and relatively efficient framework for leases, security deposits, and eviction. Iowa has no statewide rent control, and state law preempts local rent regulation, so neither Des Moines nor any Iowa municipality can cap rents, a structural protection for rental income. Eviction procedures for nonpayment are comparatively straightforward and quicker than in many tenant favorable states, though landlords must follow the statutory notice and court process.
The regulatory environment on the development and operating side is comparatively business friendly, consistent with Iowa's broader posture. Des Moines and its suburbs maintain standard zoning, building, and rental licensing requirements, and some jurisdictions operate rental inspection programs, but there is no unusual regulatory burden relative to national norms. Short term rental regulation exists at the municipal level and should be verified for any specific strategy, though it is a minor consideration in a market driven by long term rental demand. The overall regulatory read is favorable: no rent control, efficient enforcement, and a business friendly state posture, a combination that supports the value and operating flexibility of rental assets. Investors should confirm current city rental licensing and inspection requirements before underwriting any specific property.
Section 15Infrastructure
Des Moines benefits from strong, well maintained infrastructure and a central logistics location that supports its industrial and data center growth. The metro sits at the intersection of Interstate 35, running north and south, and Interstate 80, the major east and west transcontinental route, giving it excellent highway connectivity and one day trucking access to a large share of the US population. The Des Moines International Airport provides commercial passenger service and has undertaken terminal expansion to accommodate growth. The mean travel time to work in the city is just 19.5 minutes per the Census, reflecting the metro's manageable size and limited congestion, a genuine quality of life advantage that supports resident attraction and retention.
Utility infrastructure has been a specific enabler of the metro's data center boom, with Microsoft in West Des Moines and Meta in Altoona building large campuses supported by adequate power and water. Water supply in central Iowa is generally reliable, drawn from surface and groundwater sources managed by regional utilities, though nutrient loading and water quality in Iowa rivers is a long running environmental and policy issue rather than a supply constraint. For a real estate investor, the infrastructure picture is favorable: excellent interstate connectivity, a functional airport, short commutes, and utility capacity sufficient to attract capital intensive data center investment, all of which support industrial and housing demand across the metro.
Section 16Climate and Physical Risks
Des Moines faces a Midwestern continental climate whose principal real estate risks are severe convective storms and riverine flooding rather than the hurricanes and wildfires that dominate coastal and western markets. The region experiences the full range of severe weather, including thunderstorms, large hail, damaging straight line winds, and tornadoes, and central Iowa was struck by the August 2020 derecho, an unusually intense and widespread windstorm that caused major damage. These wind and hail perils are the primary drivers of insured property losses and of the rising insurance costs discussed earlier.
Flood risk is a localized but real consideration, because Des Moines sits at the confluence of the Des Moines and Raccoon rivers and has a documented history of significant flooding, most notably the catastrophic floods of 1993 and further flooding in 2008. Properties in and near the floodplains of these rivers carry genuine flood exposure that requires flood insurance through the Federal Emergency Management Agency National Flood Insurance Program or private markets, and the city has invested in levee and flood control improvements in response. Away from the rivers, flood risk is low. Extreme heat and cold are seasonal factors that affect utility costs but do not pose catastrophic property risk. For an investor, the underwriting conclusion is that Des Moines physical risk is manageable and insurable but not negligible: wind and hail resistant construction and careful attention to floodplain location are the key variables, and the market lacks the existential catastrophe tail risk of hurricane and wildfire exposed regions.
Section 17Neighborhoods and Submarkets
The Des Moines market is best understood at the submarket level, where the affordable, established central city contrasts with the fast growing, higher priced western and northern suburbs. Within the city, downtown Des Moines has seen substantial residential development and offers an urban rental product, though Redfin reported downtown median sale prices near $264,000 for the three months ending June 2026, down 3.9% year over year, reflecting some softness in the urban core tied to office weakness. Established city neighborhoods such as Beaverdale, the historic near north side, and the south side offer affordable single family stock well suited to rental strategies.
At the metro scale, the multifamily submarkets tell the growth story. MMG identified West Des Moines and Urbandale as the leading recipient of new apartment supply, projected to capture about 40% of 2025 completions, reflecting strong demand in the affluent western suburbs, while the South and East Des Moines submarket, including downtown and Altoona, was projected to take roughly another third. Dallas County, on the western edge of the metro and home to fast growing Waukee and parts of West Des Moines, is the most expensive submarket with average rents near $1,330 per month, well above the metro average of $1,130, reflecting newer product and higher incomes. The practical conclusion for an investor is that submarket selection defines the strategy: the western suburbs offer newer product, higher rents, and population growth at higher entry prices, while the central city offers lower entry prices, higher yields, and a deep existing rental base but little population growth. Both can work, but they are different theses.
Section 18Opportunities
The clearest opportunity in Des Moines is cash flow oriented multifamily acquisition ahead of the supply driven recovery. With the construction pipeline down roughly 50% year over year to just 2.1% of inventory, net absorption forecast to exceed deliveries by more than 50%, and rent growth accelerating toward 2.8%, the market offers a favorable entry point where the primary risk, oversupply, has already corrected. Low absolute rents near $1,130 and a metro rent to income ratio near 16% provide both a defensive floor and room for rent growth.
A second opportunity is single family rental, where median home prices near $219,880 against median rents near $1,090 produce price to rent math that supports positive cash flow far more readily than in expensive markets, a genuine yield advantage for operators. A third opportunity is exposure to the metro's data center and logistics growth through industrial and flex assets, supported by Microsoft and Meta campuses and the interstate crossroads location. A fourth is opportunistic downtown office repositioning or residential conversion, where elevated vacancy near 22% has depressed values and could reward creative capital. Underpinning all of these is the metro's defensive, insurance and finance anchored economy and its 5.3% projected five year population growth, which provide durable demand.
Section 19Risks
The most significant structural risk is the high property tax burden. Polk County's effective property tax rate of 1.51%, roughly 50% above the national median, is a persistent drag on net operating income that offsets the market's low prices and rents, and potential changes to Iowa's rollback system add policy uncertainty. The second risk is the central city's lack of population growth, with the city of Des Moines down 0.9% since 2020, which means central city demand depends on capturing metro renters rather than on organic growth, and which contrasts with the fast growing suburbs.
The third risk is office sector weakness, with downtown vacancy near 22% weighing on the urban core and on the large financial employers that anchor the market, a dynamic that could pressure downtown values and nearby residential demand. Additional risks include rising insurance costs from severe convective storm exposure, with multifamily insurance up 12.5% year over year; localized flood risk near the Des Moines and Raccoon rivers; and the market's modest overall growth ceiling as a midsize Midwestern metro that will never deliver the rapid appreciation of high growth Sun Belt markets. Broad risks such as elevated financing costs apply here as everywhere. None of these is a verdict on the market; each is a variable an investor should size against Des Moines' affordability and stability.
Section 20Investor Implications
For an accredited investor, Des Moines offers a defensive, income oriented Midwestern market whose appeal is stability and yield rather than rapid appreciation. The fundamentals are attractive for cash flow strategies: exceptional affordability with metro rents near $1,130 and a 16% rent to income ratio, a multifamily supply pipeline that has already corrected to 2.1% of inventory, occupancy near 93.7% that sits below national vacancy, accelerating rent growth forecast at 2.8%, and a diversified insurance and finance anchored economy with 3.2% unemployment. This is a market for investors who prize durable cash flow and low volatility over speculative upside.
The strategies the data most supports are countercyclical multifamily acquisition ahead of the supply driven recovery, single family rental where price to rent math produces genuine yield, and industrial or flex exposure tied to data center and logistics growth. Underwriting must center on three variables above all: the high property tax burden near 1.51% of value, which is the single largest structural cost and must be modeled precisely; rising insurance costs from severe storm exposure; and submarket selection between the growing, higher priced western suburbs and the affordable, higher yielding central city. Des Moines rewards investors who treat it as a yield play in a stable, affordable, supply disciplined market rather than as an appreciation play, and who underwrite the tax and insurance costs honestly against the low entry prices and recovering rents.
Section 21Conclusion
Des Moines is an affordable, stable, insurance and finance anchored Midwestern capital whose real estate market is emerging from a supply driven soft patch into a period of recovering fundamentals. Home prices remain among the most affordable of any metro, with a median near $219,880 and homes selling in 26 days, while the apartment market, with rents near $1,130 and occupancy near 93.7%, is set to strengthen as a construction pipeline that has fallen to 2.1% of inventory gives way to demand outpacing supply. The economy is diversified and defensive, unemployment is a low 3.2%, and the metro is projected to grow 5.3% over five years even as the central city holds flat. The offsetting considerations are a high property tax burden near 1.51% of value, rising insurance costs from severe storm exposure, and office weakness in a downtown carrying roughly 22% vacancy. For the accredited investor, Des Moines is best understood not as a simple yes or no but as a yield oriented, low volatility market where honest modeling of taxes and insurance, disciplined submarket selection, and a cash flow rather than appreciation mindset will separate strong results from ordinary ones. Every figure in this review carries a named public source and an explicit scope so that the reader can verify it independently.
Sources
- US Census Bureau, QuickFacts, Des Moines city, Iowa, population, income, housing, and demographic figures, retrieved August 31, 2026, https://www.census.gov/quickfacts/fact/table/desmoinescityiowa/PST045225
- US Bureau of Labor Statistics, Des Moines West Des Moines IA Economy at a Glance, labor force, unemployment, and nonfarm employment by sector, data extracted August 28, 2026, https://www.bls.gov/eag/eag.ia_desmoines_msa.htm
- MMG Real Estate Advisors, 2025 Des Moines Forecast, citing CoStar and Yardi Matrix for rent, occupancy, absorption, construction pipeline, income and expense, and population projections, https://mmgrea.com/2025-des-moines-forecast/
- CoStar, Apartment rents decline in Des Moines as vacancy reaches new high, multifamily supply and demand, https://www.costar.com/article/1672410841/apartment-rents-decline-in-des-moines-as-vacancy-reaches-new-high
- CoStar, Gradual recovery on tap for US multifamily market, national multifamily vacancy near 8.5% at year end 2025, https://www.costar.com/article/871425367/what-to-watch-in-2026-gradual-recovery-on-tap-for-us-multifamily-market
- Redfin, Des Moines IA Housing Market, median sale price, price per square foot, days on market, and sales velocity for all home types, three months ending June 2026, https://www.redfin.com/city/5415/IA/Des-Moines/housing-market
- Cushman and Wakefield, Des Moines MarketBeat Reports, Q1 2026 industrial vacancy and Q3 2025 office report, https://www.cushmanwakefield.com/en/united-states/insights/us-marketbeats/des-moines-marketbeats
- CoStar, CoStar Projects Steady Decline in U.S. Office Vacancy, national office vacancy below 14% in Q2 2026, https://investors.costargroup.com/news-releases/news-release-details/costar-projects-steady-decline-us-office-vacancy
- Des Moines Register, downtown Des Moines office vacancy over one fifth, late 2024, https://www.desmoinesregister.com/story/money/business/retail/2024/11/21/whats-the-future-of-downtown-des-moines-as-work-patterns-change/72949563007/
- Greater Des Moines Partnership, Major Employers in Greater Des Moines, https://www.dsmpartnership.com/economic-development/economic-climate/major-employers
- SmartAsset, Iowa Property Tax Calculator, Polk County effective property tax rate and median payment, https://smartasset.com/taxes/iowa-property-tax-calculator
- Polk County Iowa County Auditor, Tax Rate and Valuation Information, consolidated tax rates for fiscal year 2025 and 2026, https://www.polkcountyiowa.gov/county-auditor/property-tax/tax-rate-and-valuation-information/
- Iowa Taxpayers Association and ITR Foundation, explanation of Iowa's residential property tax rollback system, https://itrfoundation.org/understanding-iowas-property-tax-rollback-what-it-is-why-it-exists-and-how-it-affects-your-tax-bill/