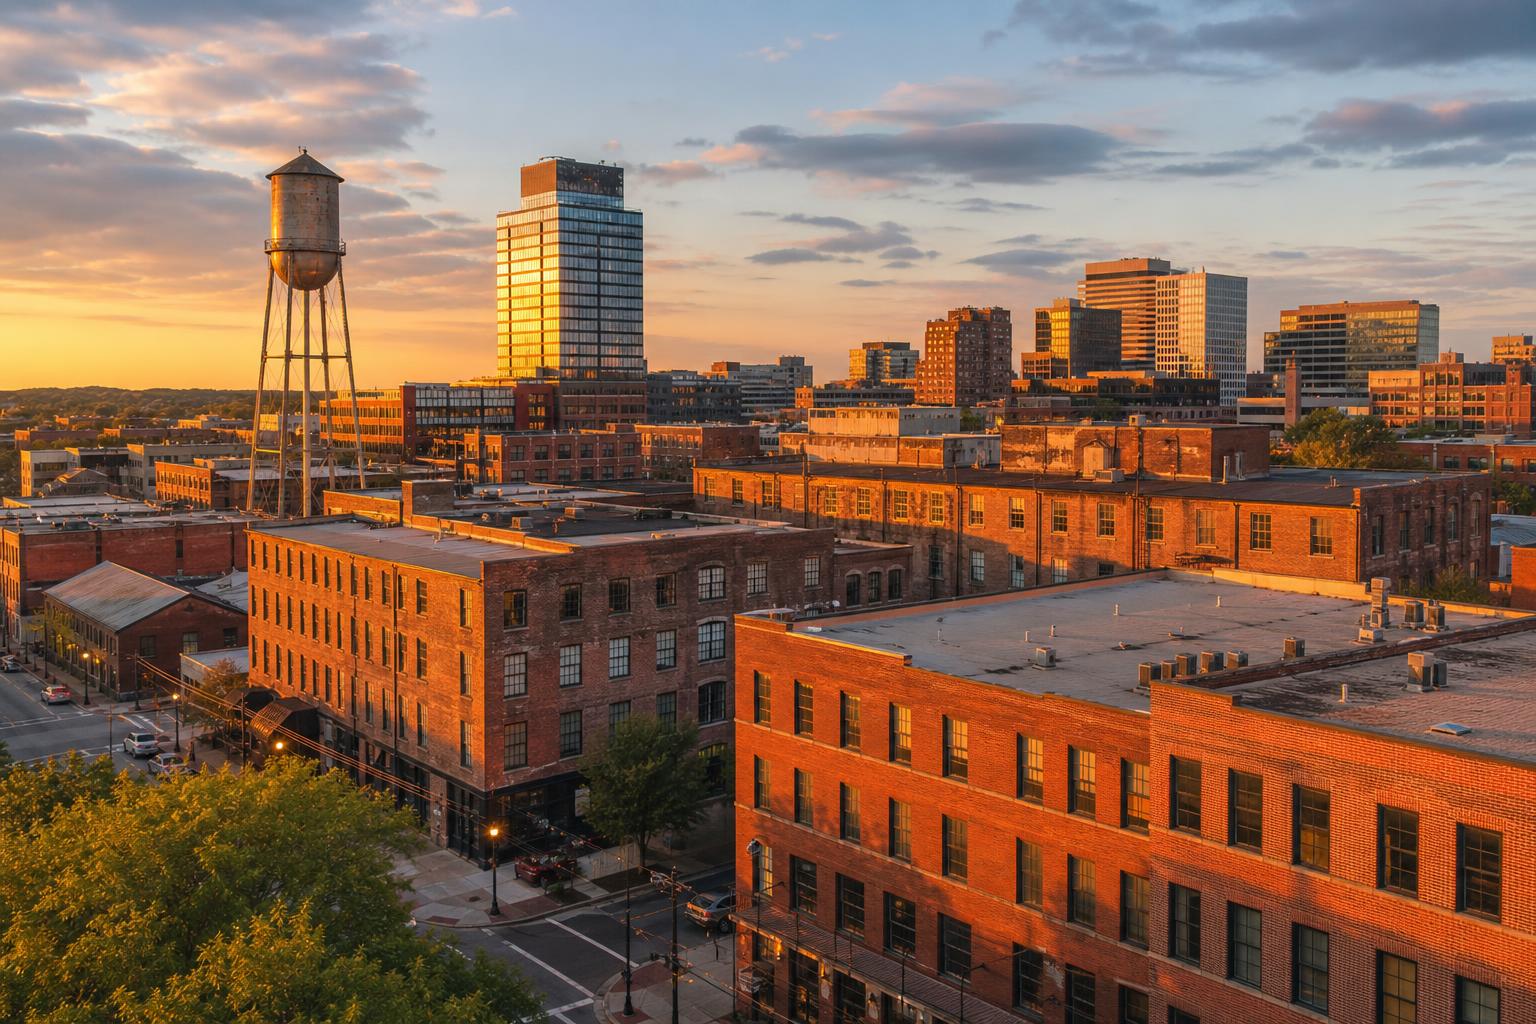
In brief · summary: Durham
Durham is the second largest city in the Raleigh Durham Chapel Hill Research Triangle, and it is a genuinely distinct market from Raleigh even though the two are frequently reported together. The city of Durham had an estimated population of 305,561 in 2025, up from 283,506 at the 2020 census, according to Census Bureau estimates cited by Wikipedia and World Population Review, and Durham County reached an estimated 347,240 residents in 2025. The four county Durham Chapel Hill metropolitan statistical area, which the Federal Reserve Bank of St. Louis put at 625,485 residents in 2025 based on Census Bureau data updated in March 2026, sits inside the much larger Raleigh Durham Cary combined statistical area of roughly 2.37 million people.
Durham's economy is anchored by Duke University and Duke University Health System, the second largest private employer in North Carolina with more than 57,000 workers according to Duke's own community impact reporting, and by Research Triangle Park, which spans 7,000 acres mostly in Durham County and hosts more than 385 companies and 55,000 workers according to RTP.org. That research and biotech base has made Durham's labor market more fragile than Raleigh's over the past year: the Durham Chapel Hill metro lost about 3,800 jobs in the twelve months beginning February 2025, driven partly by federal research funding cuts that triggered a Duke hiring freeze and layoffs at RTI International, Charles River Laboratories, and National Resilience, while the Raleigh Cary metro added 13,300 jobs over the same period, according to the News and Observer's May 2026 analysis of state labor data.
Housing tells a similarly cooling story. Redfin put Durham's median home sale price at roughly $425,000 in the three months ending June 2026, down about 1.2 percent year over year, while Zillow's typical home value for Durham fell about 2.2 to 3.3 percent over the trailing year depending on the reporting month. Durham's apartment market, per Lee and Associates data for the first quarter of 2026, carried vacancy of 11.2 percent, the highest reading of any major Triangle submarket, alongside asking rents of $1,556 per unit. Retail is the outlier, with vacancy near 2.8 percent and positive net absorption returning in late 2025. The investment case rests on Duke, RTP biotech and life sciences, and Research Triangle Park's ongoing 7,000 acre RTP 3.0 redevelopment, weighed against a genuinely soft multifamily and for sale housing cycle and a federal research funding environment that is actively pressuring the region's largest employers.
Section 01Executive Summary
Durham is often described alongside Raleigh as part of a single Triangle market, but the two cities are running on different tracks in 2026, and an investor who treats them as interchangeable will misprice both. Durham's population has grown steadily but not explosively: the city held an estimated 305,561 residents in 2025, up from 283,506 in the 2020 census, a gain of about 7.8 percent over five years, according to Census Bureau data compiled by Wikipedia and World Population Review. Durham County reached roughly 347,240 residents in 2025, and the broader Durham Chapel Hill metropolitan statistical area stood at 625,485 in the same year according to Federal Reserve Bank of St. Louis data sourced from the Census Bureau and updated in March 2026.
The defining feature of Durham's economy is its concentration in research, higher education, and life sciences rather than the broader corporate and government base that anchors Raleigh. Duke University and Duke University Health System together employ more than 57,000 people and are the largest employer in Durham County, according to Duke's own community impact data, while Research Triangle Park, which sits mostly within Durham County, hosts more than 385 companies and 55,000 workers across its 7,000 acres, per RTP.org. That concentration became a liability over the past year: federal cuts to National Institutes of Health funding triggered a Duke hiring freeze in early 2026 and contributed to the Durham Chapel Hill metro losing about 3,800 jobs in the twelve months beginning February 2025, even as the Raleigh Cary metro added 13,300 jobs in the same period, according to the News and Observer's analysis of state employment data published in May 2026. The Bureau of Labor Statistics Economy at a Glance for Durham Chapel Hill, updated through July 2026, put the unemployment rate at 3.4 percent, low in absolute terms but a signal that the labor market has stopped growing on a twelve month basis.
Real estate is cooling in step with employment. Redfin reported Durham home prices down modestly year over year through mid-2026, Zillow showed a steeper decline in its typical home value measure, and Lee and Associates data for the first quarter of 2026 showed Durham apartment vacancy at 11.2 percent, the softest reading among Triangle submarkets and above Raleigh's 10.9 percent. Retail is the clear exception, with vacancy near 2.8 percent and rising net absorption. The supply pipeline is thinning sharply across the Triangle, which Northmarq expects to stabilize vacancy and support rents into 2027, and Research Triangle Park's newly approved RTP 3.0 land use plan opens the door to mixed-use redevelopment across the park's 7,000 acres. The investment case for Durham is built on Duke, biotech and life sciences, and a research park in the midst of reinvention, set against a genuinely soft near term housing and labor cycle that investors should underwrite conservatively rather than assume away.
Section 02Population and Migration
Durham's population growth is real but considerably more modest than the headline numbers for the wider Triangle region suggest. The city of Durham had 283,506 residents at the 2020 census and an estimated 305,561 residents in 2025, a gain of about 7.8 percent, according to Census Bureau data reported by Wikipedia, while World Population Review's 2026 estimate put the city at 310,342 residents, implying continued growth of roughly 1.5 percent per year. Durham County, which includes the city and surrounding unincorporated areas, grew from 324,833 residents in 2020 to an estimated 347,240 in 2025, a 6.9 percent increase, per the same Census Bureau vintage.
| Geography | Population | Scope and source |
|---|---|---|
| City of Durham | 305,561 (2025 est.), 310,342 (2026 est.) | Census Bureau via Wikipedia and World Population Review |
| Durham County | 347,240 | 2025 est., Census Bureau via Wikipedia |
| Durham-Chapel Hill MSA | 625,485 | 2025, Census Bureau via FRED, updated March 2026 |
| Raleigh-Durham-Cary CSA | ~2,368,947 | 2023 est., Census Bureau via Wikipedia |
The four county Durham Chapel Hill metropolitan statistical area, which comprises Durham, Orange, Chatham, and Person counties, reached an estimated 625,485 residents in 2025 according to Census Bureau data as reported through the Federal Reserve Bank of St. Louis and updated March 27, 2026, up from 588,909 at the 2020 census and 504,357 in 2010, a compound rate of growth that is solid but well below the pace Raleigh's Wake County has posted over the same period. Zooming out further, the Research Triangle region, defined as the combined statistical area anchored by Raleigh, Durham, and Cary, had an estimated population of 2,368,947 in 2023, according to Census Bureau data cited in the Durham County Wikipedia entry, underscoring that Durham is one node, not the largest one, in a much bigger regional growth story centered on Wake County.
The practical read for an investor is that Durham's population growth is steady and multi decade in character rather than a recent boom, driven by the enduring pull of Duke University, Duke Health, and Research Triangle Park rather than by the corporate relocation and headquarters wins that have driven faster growth in Raleigh and Wake County's suburbs. That means Durham's housing demand curve is smoother and less prone to sharp swings, but it also means Durham is unlikely to post the outsized population gains that some faster growing Sun Belt metros are recording, a distinction that should inform rent growth assumptions discussed later in this review.
Section 03Jobs and Economic Anchors
Durham's labor market softened over the twelve months through mid-2026, a genuine break from the region's recent trend. The Bureau of Labor Statistics Economy at a Glance for the Durham Chapel Hill metropolitan area, with data extracted September 4, 2026, reported total nonfarm employment of 357,800 in July 2026 on a preliminary basis, flat on a twelve month basis after several months of small declines earlier in 2026. The unemployment rate stood at 3.4 percent in July 2026, not seasonally adjusted, up slightly from 3.1 percent in April but still low in absolute terms, according to the same BLS release and confirmed by Federal Reserve Bank of St. Louis series data. Manufacturing employment fell 3.4 percent year over year to 25,700 jobs in July 2026, while mining, logging, and construction employment rose 2.7 percent to 11,500, per BLS.
| Indicator, Durham-Chapel Hill metro | Value | Change | Scope and source |
|---|---|---|---|
| Total nonfarm employment | 357,800 | 0.0% YoY | July 2026 preliminary, BLS |
| Unemployment rate | 3.4% | +0.3 pts vs April | July 2026 not seasonally adjusted, BLS |
| Manufacturing employment | 25,700 | -3.4% | July 2026 preliminary, BLS |
| Mining, logging and construction | 11,500 | +2.7% | July 2026 preliminary, BLS |
| Metro jobs lost, trailing 12 months | -3,800 | vs +13,300 in Raleigh-Cary | 12 mo. through Feb 2026, News & Observer via state labor data |
Durham's true economic distinctiveness is its concentration in research institutions and life sciences rather than a diversified corporate base. Duke University and Duke University Health System together employ more than 57,000 people, more than half of whom live in Durham County, making Duke both the largest employer in the county and the second largest private employer in North Carolina, according to Duke's own community impact reporting. Research Triangle Park, founded in 1959 and spanning 7,000 acres mostly within Durham County, hosts more than 385 companies, including Fortune 100 research and development operations, biotech firms, and government labs, employing over 55,000 workers and generating an estimated $25.1 billion in annual economic impact, according to RTP.org and coverage by the Research Triangle Regional Partnership. Named biotech and pharmaceutical employers with a Durham or RTP presence include Biogen, which is expanding with a $2 billion facility investment, Novartis, which committed $771 million to create 700 jobs by 2030, bioMerieux, Novo Nordisk, Eli Lilly, GSK, Merck, and Amazon, which operates four facilities in Durham.
The other side of that concentration became visible in 2025 and 2026. Federal funding cuts to the National Institutes of Health prompted Duke to institute a hiring freeze in early 2026, and mass staff reductions hit Durham research organizations including Duke, FHI 360, and RTI International, which fell from the 178th to the 260th largest employer in the state, according to reporting by the News and Observer in May 2026 that tracked the Triangle's largest employers year over year. Separate WARN notices tracked by WRAL and Yahoo Finance showed National Resilience cutting 120 jobs at its Durham gene therapy manufacturing site in early 2025 and Charles River Laboratories closing a Durham pathology facility and eliminating at least 31 positions the same year, both citing broader cost pressure in the contract research and biomanufacturing industry. Wolfspeed, the Durham based semiconductor manufacturer, both entered and emerged from bankruptcy in 2025. For an investor, the conclusion is that Durham's research and biotech base is a genuine long-run asset, but it is also more exposed to federal budget cycles and biotech capital markets than a diversified metro economy, and the 2025 to 2026 slowdown should be read as evidence of that exposure rather than a one-time event.
Section 04Income
Durham households earn modestly above the national median, a reflection of the city's highly educated, institution-heavy workforce. The Census Bureau's American Community Survey 2020-2024 five-year estimate put Durham's median household income at $81,619, about 5 percent above the national median of $77,719, according to compilations by Every City in the USA and North Carolina Demographics that cite the same ACS release. Neilsberg's analysis of the same ACS data found that Durham households aged 25 to 44, the prime renter and first-time buyer cohort, had a notably higher median household income of $86,664.
| Geography | Median household income | Scope and source |
|---|---|---|
| City of Durham, all households | $81,619 | 2020-2024 ACS 5-yr, Census Bureau |
| City of Durham, householders 25-44 | $86,664 | ACS via Neilsberg |
| United States median | $77,719 | 2020-2024 ACS 5-yr, Census Bureau |
The investment implication is that Durham's income base is healthy enough to support market-rate rents in the near term, but it is not rising fast enough to offset the affordability pressure created by property taxes and insurance premiums discussed later in this review, both of which have increased materially since 2024. Because Durham's largest employers are research institutions and universities rather than fast-growing corporate campuses, income growth here is likely to track institutional budget cycles, including the federal research funding environment, more closely than it tracks the broader regional economy centered on Raleigh and Wake County.
Section 05Housing and Multifamily
Durham's apartment market is the softest among the Triangle's major submarkets, and every available data source agrees on the direction even where the exact levels differ. Lee and Associates, in its first quarter 2026 Raleigh-Durham multifamily report, found that Durham vacancy rose to 11.2 percent, up from 10.9 percent the prior quarter, on trailing twelve month net absorption of 2,395 units, down modestly from the prior quarter, while asking rents rose slightly to $1,556 per unit and sale prices per unit held roughly flat at $217,873, with cap rates steady at 5.60 percent. That Durham vacancy reading compares with 10.9 percent in Raleigh over the same period, and Northmarq's research separately noted that in the trailing five years, about 60 percent of Triangle multifamily transactions have occurred in Raleigh and only 40 percent in Durham, in part because Raleigh has recorded higher rents and tighter vacancy.
| Series and scope | Level or reading | Change | Period and source |
|---|---|---|---|
| Durham vacancy rate | 11.20% | +30 bps QoQ | Q1 2026, Lee & Associates |
| Durham asking rent per unit | $1,556 | slight increase | Q1 2026, Lee & Associates |
| Durham cap rate | 5.60% | steady | Q1 2026, Lee & Associates |
| Raleigh-Durham asking rent, regional | $1,539 | +0.1% trailing 3 mo. | Through April 2026, Yardi Matrix |
| Raleigh-Durham occupancy, regional | 93.1% | -70 bps YoY | March 2026, Yardi Matrix |
| Raleigh-Durham construction pipeline | <9,000 units | 2026 deliveries ~5,100, -32% vs. long-term average | Q1 2026, Northmarq |
Regional data from Yardi Matrix, in its June 2026 Raleigh-Durham report, showed the combined market's average advertised asking rent up a modest 0.1 percent on a trailing three month basis through April 2026 to $1,539, with stabilized occupancy of 93.1 percent as of March 2026, down 70 basis points year over year, a sign that softening fundamentals are affecting the region broadly and not just Durham. Northmarq's research, in a market update published in late May 2026, found that only about 1,300 units were delivered across the Triangle in the first quarter of 2026, that the under-construction pipeline had fallen below 9,000 units, and that full year 2026 deliveries were expected to total only about 5,100 units, 32 percent below the region's long-term average, which Northmarq expects will help stabilize vacancy and support rents into 2027, with a year-end 2026 rent forecast of $1,585 and a vacancy forecast of 8.2 percent for the broader Triangle. Durham-specific submarket data compiled by the Cedeno Group, citing Northmarq, put average rents in downtown Durham between $1,624 in the fourth quarter of 2025 and $1,852 in a May 2026 Zumper reading, while RTP and South Durham rents reached $2,295 in the same Zumper data, up 34.24 percent year over year, a jump the Cedeno Group attributed to new lease-up supply tied to the HUB RTP development and nearby Wolfspeed hiring rather than broad-based market appreciation.
The overall conclusion is that Durham's apartment fundamentals are the weakest in the Triangle on a headline basis, largely because of accumulated new supply delivered over the past several years, but that the forward pipeline is thinning sharply across the entire region, which sets up a plausible path toward tightening vacancy and renewed rent growth by 2027, consistent with the pattern already showing up in Northmarq's forecasts.
Section 06Rents
Rent levels in Durham vary widely by submarket, and averaging across the market obscures a meaningful spread that investors should underwrite explicitly. At the metro level, Lee and Associates put Durham's average asking rent at $1,556 per unit in the first quarter of 2026, essentially flat with the prior quarter, while HUD's Fair Market Rent schedule for the Durham-Chapel Hill HUD Metro Fair Market Rent Area, covering Chatham, Durham, and Orange counties, set the fiscal year 2026 one-bedroom rent at $1,507 and the two-bedroom rent at $1,711, both notably above the national average FMR of $959 and $1,175, respectively, but the one-bedroom figure represented a 7.9 percent decrease from the FY2025 level of $1,637, according to HUD data compiled by PlainRent, a decline that reflects the same softening in advertised market rents visible in the private data sources.
Submarket data assembled by the Cedeno Group, drawing on Northmarq and Zumper, showed downtown Durham rents in a range of roughly $1,624 to $1,852 depending on the source and month, reflecting the neighborhood's concentration of older, pre-2000 vintage stock that accounted for about 80 percent of downtown Durham's 2025 apartment sales volume, while the RTP and South Durham submarket, benefiting from new lease-up supply near the HUB RTP development, posted rents around $2,295, up more than 34 percent year over year in that particular reading. The Durham Housing Authority's 2026 payment standards, effective April 1, 2026, ranged from $1,393 for a studio to $2,100 for a three-bedroom unit, providing a useful floor reference for workforce and voucher-supported housing across the market.
For an investor, the practical read is that Durham rent growth should be underwritten conservatively at the metro level, where flat to slightly positive readings are the norm, while newer, well-located product near RTP and Duke can command meaningfully higher rents, provided the investor accounts for lease-up risk given the concentration of new supply in exactly those submarkets.
Section 07Vacancy
Vacancy is the single clearest signal of Durham's position in the current cycle relative to its Triangle neighbors. Apartment vacancy in Durham stood at 11.2 percent in the first quarter of 2026 according to Lee and Associates, the highest reading among the region's major submarkets and up from 10.9 percent the prior quarter, a trend the same report attributed to ongoing pressure from new deliveries relative to demand. That compares with Raleigh's 10.9 percent vacancy over the same period and with the broader Triangle regional occupancy of 93.1 percent, or roughly 6.9 percent vacancy, reported by Yardi Matrix for stabilized properties in March 2026, a discrepancy that reflects Yardi's narrower, stabilized-only sample compared with Lee and Associates' broader Durham-specific data set.
Industrial vacancy in the Durham-Chapel Hill metropolitan statistical area was 9.2 percent in the first quarter of 2026 according to SVN Real Estate Advisors, up from prior quarters as roughly 1.9 million square feet of new industrial product delivered over the trailing twelve months against net absorption of only about 437,000 square feet, well below the market's historical annual average of roughly 1.4 million square feet. Office vacancy across the broader Triangle stood at 15.98 percent in the first quarter of 2026 per the Triangle Market Report, though Newmark's Raleigh-focused office data showed vacancy near 19.5 percent for that submarket specifically, still above the 20-year average of 13.3 percent. Retail is the clear counterpoint: Lee and Associates measured Durham retail vacancy at just 2.80 percent in the first quarter of 2026, among the tightest readings of any property type in the market, though downtown Durham itself carried a notably higher retail vacancy of 7 percent according to CoStar data cited in the 2026 State of Downtown Durham report, above both downtown Raleigh's 6.4 percent and the greater Raleigh-Durham market's 2.7 percent.
The unifying takeaway is that Durham vacancy is elevated and rising in multifamily and industrial, moderately elevated in office, and low and tight in retail outside the specific case of downtown storefronts still absorbing post-pandemic foot traffic changes, a pattern that argues for selectivity by property type rather than a single market-wide read.
Section 08Supply Pipeline
The forward multifamily supply picture is turning favorable across the Triangle, Durham included, after several years of heavy deliveries. Northmarq's research, published in late May 2026, found that the regional under-construction pipeline had fallen below 9,000 units, that only about 1,300 units were delivered Triangle-wide in the first quarter of 2026, and that full-year 2026 deliveries were expected to total roughly 5,100 units, 32 percent below the region's long-term average, a trend Northmarq expects will help stabilize vacancy and support rent growth into 2027. Lee and Associates' first quarter 2026 data showed Durham-specific multifamily construction activity of 4,176 units against a total inventory of 64,965 units, meaning the active pipeline represents about 6.4 percent of existing stock, a still meaningful but clearly decelerating rate of growth.
Individual project data reinforces the picture of a market absorbing a large prior wave before the next one arrives. The 2026 State of Downtown Durham report found that all eleven residential developments completed downtown in 2025 were residential, delivering 1,152 units including 177 affordable units at the Renegade and Vanguard properties, while three additional mixed-income developments remained under construction along with more than 1,100 additional market-rate units in the pipeline, bringing cumulative downtown completions to 7,224 units. Looking further out, The Integral Group announced construction is set to begin in early 2027 on Tribute Rising, a 907-unit apartment and retail development that qualifies for expedited review because its first phase includes more than 100 dedicated affordable units alongside a grocery store and childcare center, with the first 332-unit phase expected to deliver in late 2028.
Industrial supply is moving in the opposite direction from multifamily in the near term. SVN Real Estate Advisors reported that the Durham-Chapel Hill industrial market had an additional 3.2 million square feet under construction as of the first quarter of 2026, on top of 1.9 million square feet delivered over the trailing twelve months, and forecast that industrial vacancy would continue rising through much of 2026 as this pipeline delivers into a market where net absorption remains below the historical average. CBRE's 2026 outlook similarly flagged a wave of new industrial supply set to deliver across the Triangle in the second half of 2026. For an investor, the conclusion is that multifamily supply relief is arriving in Durham on a similar timeline to the rest of the Triangle, while industrial investors should expect vacancy to keep rising through 2026 before the market rebalances.
Section 09Single Family Homes
Durham's for-sale housing market has cooled from its pandemic-era highs and is showing consistent, modest price declines across every major index. Redfin reported that Durham's median sale price across all home types was $424,787 in July 2026, down 2.3 percent year over year, with price per square foot at $223, down 5.5 percent over the same period. Zillow's typical home value measure for Durham stood at $395,976 as of July 31, 2026, down 3.3 percent over the trailing year, while Zillow's separately reported median sale price was $412,833 and median list price was $410,000. A market analysis by Hodge and Kittrell Sotheby's International Realty, examining the three months ending June 2026, found Durham's median sale price at $425,000, down 1.2 percent year over year, with Durham County as a whole at $426,000, down a smaller 0.34 percent, and Zillow's typical home value for the city at $396,191, down 2.2 percent, concluding that three different data sources pointed in the same flat-to-down direction rather than the price surge that Durham's tech and biotech headlines might imply.
| Metric and scope | Value | Change | Period and source |
|---|---|---|---|
| Median sale price, city of Durham | $424,787 | -2.3% YoY | July 2026, Redfin |
| Median price per square foot, city | $223 | -5.5% YoY | July 2026, Redfin |
| Median sale price, Durham County | $427,000 | -1.5% YoY | Through May 2026, Redfin |
| Typical home value, city of Durham | $395,976 | -3.3% YoY | July 2026, Zillow |
HUD's December 1, 2024 market analysis, cited in a Hodge and Kittrell Sotheby's blog post, classified Durham's for-sale housing market as balanced while classifying the rental market as soft, a distinction consistent with the price and vacancy data above. The practical implication for an investor is that Durham's owner-occupied housing market is not distressed, but it is not appreciating either, which combined with soft apartment fundamentals suggests that near-term returns in Durham single family rental and small multifamily strategies should be underwritten on cash flow and expense discipline rather than on assumed price appreciation.
Section 10Commercial Real Estate and Retail Centers
Durham's commercial sectors, like its apartment market, are diverging by property type. Industrial and warehouse space, powered by Research Triangle Park and the broader Triangle's life sciences and logistics base, showed positive but slowing absorption: CBRE reported that the Raleigh-Durham warehouse sector posted 1.2 million square feet of positive net absorption in the second quarter of 2026, with more than 90 percent concentrated in Class A properties, underscoring a flight-to-quality pattern, while flex properties added 114,000 square feet of positive absorption, also led by Class A space. SVN Real Estate Advisors' first quarter 2026 report on the Durham-Chapel Hill MSA specifically found total industrial inventory of 60.3 million square feet, vacancy of 9.2 percent, and asking rents of $11.74 per square foot, with net absorption of only about 437,000 square feet against a historical annual average closer to 1.4 million square feet, as roughly 1.9 million square feet of new product delivered over the trailing year and an additional 3.2 million square feet remained under construction.
| Sector and scope | Vacancy | Asking rent | Net absorption | Period and source |
|---|---|---|---|---|
| Industrial, Durham-Chapel Hill MSA | 9.2% | $11.74/SF | +437,000 SF (12 mo.) | Q1 2026, SVN Real Estate Advisors |
| Industrial, Raleigh-Durham, warehouse | rising, not stated | not stated | +1.2 million SF | Q2 2026, CBRE |
| Retail, Durham | 2.80% | $24.99/SF NNN | +364,905 SF (12 mo.) | Q1 2026, Lee & Associates |
| Retail, downtown Durham | 7.0% | not stated | not stated | 2025, CoStar via State of Downtown Durham |
Retail is Durham's strongest commercial sector by a wide margin. Lee and Associates reported that Durham's retail market strengthened through the first quarter of 2026, with twelve-month net absorption rising to 364,905 square feet after returning to positive territory in late 2025, vacancy of just 2.80 percent, and asking rents holding steady at $24.99 per square foot on a triple-net basis, even as cap rates rose to 9.00 percent, reflecting more cautious investor sentiment despite strong operating fundamentals. Grocery-anchored retail is the dominant driver: a Southeast regional retail report from Cornovus Capital found that the Raleigh-Durham Research Triangle recorded its eighth consecutive quarter of grocery-anchored absorption outpacing new deliveries in the first quarter of 2026, with Publix, Wegmans, Whole Foods, and Harris Teeter anchor commitments continuing to support new development feasibility. Downtown Durham is the exception within retail, where CoStar data cited in the 2026 State of Downtown Durham report put retail vacancy at 7 percent, above both downtown Raleigh's 6.4 percent and the broader Raleigh-Durham market's 2.7 percent, attributable in part to reduced daytime foot traffic and parking constraints even as more than 60,000 square feet of new retail space was delivered downtown in 2025 alone. Office space in Durham is more specialized than in Raleigh, concentrated around lab-capable buildings near RTP and adaptive reuse creative office in the American Tobacco Historic District, where average asking rents of $34.08 per square foot exceed the $28.68 average for the greater Raleigh-Durham market, according to the State of Downtown Durham report.
The unifying commercial conclusion is that grocery-anchored retail and lab or life-science-capable industrial and office space are Durham's strongest commercial categories, that generic suburban industrial faces a near-term supply overhang as 2026 deliveries outpace demand, and that downtown office and retail carry more idiosyncratic risk tied to foot traffic recovery than the market's population and job base alone would suggest.
Section 11Transactions and Capital Markets
Multifamily investment activity in Durham has been consistently smaller than in Raleigh, and 2026 has done little to change that pattern. Northmarq's research found that in the trailing five years, about 60 percent of Raleigh-Durham multifamily transactions closed in Raleigh and only 40 percent in Durham, with sales above $10 million exclusively occurring in Raleigh to begin 2026, reflecting that submarket's higher rents and tighter vacancy relative to Durham. First quarter 2026 sales activity across the region returned to the lighter levels of the prior two years following an uptick in the fourth quarter of 2025, and Northmarq's research suggested that full year 2026 sales volume would likely again lag long-term regional trends.
Pricing has been comparatively stable even as volume has stayed light. Cap rates across the Raleigh-Durham multifamily market averaged between 5.0 and 5.5 percent through 2025 according to Northmarq's research, with Durham specifically landing at 5.5 percent in the fourth quarter of 2025 and holding at 5.60 percent through the first quarter of 2026, per Lee and Associates, alongside a Durham sale price per unit of $217,873, essentially unchanged from the prior quarter. Retail cap rates in Durham moved higher, to 9.00 percent in the first quarter of 2026 according to Lee and Associates, even as retail vacancy and rents remained healthy, a divergence that reflects the broader repricing of retail assets under higher interest rates rather than any weakness in operating fundamentals. Construction activity has slowed markedly across the region: Northmarq's fourth quarter 2025 research found that the pace of new multifamily construction in Raleigh-Durham would slow by more than 60 percent in 2026 compared with the prior two years, a trend that should, with a lag, support both transaction volume and pricing as the supply overhang clears.
For an investor, the takeaway is that Durham offers a smaller, less liquid, but comparably priced multifamily investment market relative to Raleigh, with retail cap rates that have widened even as retail fundamentals have stayed the strongest of any Durham property type, a combination that can represent an attractive entry point for disciplined buyers willing to accept lower transaction volume and less institutional competition than in Raleigh proper.
Section 12Taxes
North Carolina imposes a flat personal income tax, currently among the lowest flat rates of any state that levies one, but property owners in Durham face a combined city and county tax structure that increased twice in quick succession through 2026. Durham County reappraised all property effective January 1, 2025, and adopted a post-reappraisal countywide rate of 55.42 cents per $100 of assessed value, down from 79.87 cents the prior year but above the revenue-neutral rate of 51.92 cents, according to reporting by the News and Observer and confirmed by Durham County Tax Administration data. Combined with the City of Durham's rate of 43.71 cents per $100, itself set 5.48 cents above revenue-neutral to fund a $200 million voter-approved bond and employee compensation increases, the total FY2025-26 rate for properties inside city limits was 99.13 cents per $100 of assessed value, producing a median effective property tax rate of 1.39 percent, above both the national median of 1.02 percent and the North Carolina state median of 0.81 percent, according to an analysis published by Spotlight NC in August 2026.
| Item | Value | Scope and source |
|---|---|---|
| Durham County rate, FY2026-27 | $0.5792 per $100 | Effective July 1, 2026, Durham County |
| City of Durham rate, FY2025-26 and FY2026-27 | $0.4371 per $100 | City of Durham |
| Combined city rate, FY2026-27 | $1.0163 per $100 | Effective July 1, 2026, TriangleTaxMap |
| Median effective property tax rate | 1.39% of value | 2026, Spotlight NC |
| Example annual bill, $400,000 home | ~$4,065/year | FY2026-27 combined rate, TriangleTaxMap |
Rates rose again for the 2026-27 fiscal year: the Durham Board of County Commissioners approved a countywide rate of 57.92 cents per $100 as part of its 2026-2027 budget ordinance, effective July 1, 2026, according to Durham County's own announcement, which combined with the unchanged city rate of 43.71 cents produces a combined rate of $1.0163 per $100 for most City of Durham parcels, or roughly $4,065 per year on a $400,000 assessed home, according to TriangleTaxMap's July 2026 analysis. North Carolina reassesses property values on a four-year cycle, so Durham's next general reappraisal is not due until 2029, meaning near-term tax increases will come primarily through rate changes rather than a broad revaluation. For an investor, the clear conclusion is that Durham property taxes are meaningfully above both the national and state medians on an effective basis, that the combined rate has now risen in back-to-back fiscal years, and that this recurring cost should be modeled explicitly and conservatively rather than assumed to hold flat.
Section 13Insurance
North Carolina homeowners insurance costs are rising steadily under a state-level rate settlement process, and Durham has not been spared. The North Carolina Rate Bureau originally requested an average 42.2 percent statewide homeowners insurance rate increase in a filing made in January 2024, with proposed increases up to 99.4 percent in some coastal territories; Insurance Commissioner Mike Causey negotiated a settlement, announced January 17, 2025, capping the increase at 7.5 percent effective June 1, 2025 and another 7.5 percent effective June 1, 2026, with the Rate Bureau barred from seeking another homeowners increase before June 1, 2027. In Durham and Wake counties specifically, insurers had requested a 39.8 percent increase but settled for the statewide average, according to reporting by the Triangle Business Journal and WRAL, which put the combined two-year increase for Wake, Durham, and several other Triangle counties at between 15 and 15.7 percent.
| Item | Value | Scope and source |
|---|---|---|
| Original statewide homeowners increase request | +42.2% | Jan 2024 filing, NC Rate Bureau |
| Settled statewide base rate increase | +7.5% (2025), +7.5% (2026) | NC DOI settlement, Jan 2025 |
| Two-year combined increase, Durham/Wake | ~15% to 15.7% | WRAL, Jan 2026 |
| New dwelling (investment) policy request | +68.3% over two years | Oct 2025 filing, NC Rate Bureau |
A separate and larger increase is now working through the same regulatory process for dwelling policies, the type typically used to insure rental and investment properties rather than owner-occupied homes. The North Carolina Rate Bureau filed a request on October 30, 2025 for an overall 68.3 percent statewide average increase in dwelling insurance rates over a two-year period, with a proposed 28.5 percent increase effective July 1, 2026 and a further 30.9 percent effective July 1, 2027, according to the North Carolina Department of Insurance's own press release. The Rate Bureau's prior dwelling filing, made in July 2023, requested a 50.6 percent increase and was ultimately settled at 8 percent after negotiation, a pattern that suggests the final 2026-27 dwelling rate increase will likely be negotiated down from the initial request but will still represent a meaningful increase for landlords and rental property investors. For an investor, the clear conclusion is that insurance costs for Durham rental property are rising faster than for owner-occupied homes, that the final dwelling rate increase remains under negotiation as of this writing, and that every Durham underwrite should build in a specific, updated insurance quote rather than relying on last year's premium.
Section 14Landlord Tenant and Regulatory Environment
North Carolina's landlord-tenant framework, codified in Chapter 42 of the North Carolina General Statutes, is comparatively balanced but procedurally efficient for landlords pursuing nonpaying tenants. Eviction in North Carolina proceeds through summary ejectment under Article 3 of Chapter 42, a streamlined court process that begins once a landlord has made demand for surrender of the premises from a holdover tenant, per NCGS 42-26, and Article 4A separately protects tenants from retaliatory eviction, meaning a landlord cannot evict, or refuse to renew, in retaliation for a tenant's good-faith complaint about a habitability issue or similar protected activity.
Security deposits are tightly regulated under the state's Tenant Security Deposit Act, Article 6 of Chapter 42. Deposits are capped at two weeks' rent for a week-to-week tenancy, one and one-half months' rent for a month-to-month tenancy, and two months' rent for any longer lease term, per NCGS 42-51, and permitted uses are limited by statute to items such as unpaid rent, utility costs the tenant was responsible for, property damage, re-renting costs after a tenant breach, and unpaid bills that could become a lien on the property. Landlords must hold deposits in a trust account with a licensed, federally insured depository institution, or alternatively post a bond, per NCGS 42-50, and under NCGS 42-52 a landlord must itemize any damage deductions and refund the remaining balance to the tenant within 30 days of the tenancy's termination; willful failure to comply with these deposit, bond, or notice requirements voids the landlord's right to retain any portion of the deposit. Unlike some coastal and West Coast markets, North Carolina does not impose statewide rent control, and Chapter 42 does not authorize municipalities to adopt local rent stabilization ordinances, so the rent regulation risk that weighs on many gateway metro apartment investments is largely absent for Durham owners.
For an investor, the practical implication is that North Carolina's eviction process is faster and more predictable than in many tenant-favorable states, security deposit handling carries clear statutory guardrails that must be followed precisely to avoid forfeiting deduction rights, and the absence of rent control gives Durham owners more pricing flexibility than owners face in markets such as California or parts of the Northeast, even as the underlying rent growth itself, discussed above, remains modest.
Section 15Infrastructure
Durham's infrastructure advantages flow largely from its position at the center of Research Triangle Park and its access to Raleigh-Durham International Airport. RDU served a record 15.6 million passengers in 2025, up slightly from the prior year's record of 15.5 million, according to Wikipedia's compilation of airport statistics, with the airport's busiest domestic routes connecting the Triangle to Atlanta, Charlotte, Orlando, and Dallas-Fort Worth. GoTriangle provides regional bus service connecting Durham, Raleigh, Chapel Hill, and RTP, including direct service to RDU's regional transit center, but the region's more ambitious transit ambitions have been scaled back: the Durham-Orange Light Rail project, which would have connected Durham and Chapel Hill, was formally discontinued, according to GoRaleigh's own service records, leaving bus rapid transit and conventional bus service as the region's primary public transit backbone for the foreseeable future.
Research Triangle Park itself is the region's defining piece of economic infrastructure. Founded in 1959 and spanning 7,000 acres, most of which lies within Durham County with about one-quarter in Wake County, RTP hosts more than 385 companies and 55,000 workers as of 2026, according to RTP.org, and generates an estimated $25.1 billion in annual economic impact according to reporting on Wake County economic development. In 2026, companies and both Durham and Wake counties unanimously approved land use amendments and zoning updates under an initiative known as RTP 3.0, enabling sustainable, mixed-use development to replace the single-use corporate campus model that has defined the park since the 1960s, according to RTP.org's own reporting on the approval. Duke University, separately, announced in March 2026 a $203 million, three-year commitment called the HomeGrown initiative to expand local hiring, increase spending with Durham and Triangle businesses by $45 million, increase capital project spending with local construction firms by $120 million, and expand affordable housing investment from $22 million to $60 million, alongside raising its own minimum wage to $20 an hour effective July 1, 2026, according to Duke's own announcement and coverage by Forbes.
For an investor, the infrastructure conclusion is that Durham's position inside Research Triangle Park, its access to a growing international airport, and Duke's large, locally reinvesting economic footprint are durable structural advantages, tempered by the reality that regional rail transit has not materialized and that RTP's ongoing redevelopment under RTP 3.0 will take years to convert entitlements into delivered, income-producing mixed-use product.
Section 16Climate and Physical Risks
Durham sits well inland in North Carolina's Piedmont region, which spares it the direct hurricane landfall and storm surge risk that coastal Carolina markets face, but it does not eliminate meaningful climate exposure. A parcel-level climate risk analysis by RiskBeforeBuy, refining FEMA's National Risk Index with FEMA National Flood Hazard Layer and USDA wildfire data and dated June 19, 2026, found that Durham ranks in the 92nd percentile nationally for flood exposure and the 89th percentile for hurricane exposure, both categorized in the index's extreme risk band, while wildfire exposure ranks a comparatively modest 34th percentile. Durham County's overall National Risk Index score of 90 places it in the extreme national risk band, with the dominant local perils identified as extreme heat, flood, and hurricane-related wind and rain rather than storm surge.
The relevant recent precedent is Hurricane Helene, which made landfall in Florida in September 2024 and then tracked inland, causing catastrophic flooding across western North Carolina under a federal disaster declaration that FEMA designated as Disaster 3617, covering the incident period from September 25 through December 18, 2024. Helene's damage was concentrated in the North Carolina mountains around Asheville rather than in the Piedmont around Durham, but the storm exposed a broader, statewide vulnerability that is directly relevant to Durham underwriting: a Washington Post analysis of First Street Foundation flood modeling, and a related Federal Reserve Bank of Richmond research note published in October 2024, both found that FEMA's official flood maps significantly underestimated real flood risk in the areas Helene affected, with only about 2 percent of properties in the hardest-hit mountain counties falling inside FEMA's mapped Special Flood Hazard Areas despite far higher modeled risk, underscoring that inland North Carolina flooding frequently occurs well outside officially mapped floodplains.
The investor implications are direct. First, flood risk for any specific Durham property should be checked against both FEMA's official flood maps and independent modeled risk data such as First Street, rather than relying on FEMA maps alone, given the documented gap between mapped and modeled risk elsewhere in the state. Second, the extreme-heat and hurricane-related wind and rain exposure identified by the National Risk Index should inform reserve assumptions for roofing, drainage, and stormwater infrastructure even for properties well outside any mapped floodplain. Third, rising statewide insurance costs, discussed above, are the most immediate and quantifiable channel through which this physical risk already affects Durham real estate economics today.
Section 17Neighborhoods and Submarkets
Durham's submarkets divide fairly cleanly along the lines of its major institutional anchors. Downtown Durham, encompassing the City Center, American Tobacco, Warehouse and Brightleaf, Central Park, and Golden Belt districts, has undergone the most visible revitalization, converting historic tobacco warehouses into apartments, offices, and retail; the American Tobacco Historic District specifically is described by commercial brokerage CLS Commercial Real Estate as the gold standard for adaptive reuse creative office in the Triangle. Downtown recorded 1,152 new residential units delivered in 2025 alone, per the 2026 State of Downtown Durham report, but also carries the market's highest retail vacancy at 7 percent, and roughly 80 percent of its 2025 apartment sales volume involved pre-2000 vintage buildings, according to data compiled by the Cedeno Group, a combination that points investors toward value-add and capital expenditure planning rather than assuming turnkey stabilized performance.
The Ninth Street and Duke corridor, anchored by Duke University's East and West campuses and Duke Health, supports a distinct rental demand base of students, graduate students, faculty, and medical staff, according to an investment guide published by Hodge and Kittrell Sotheby's International Realty, with smaller single-family homes, duplexes, and townhomes fitting that demand profile better than large-scale apartment product. Nearby historic neighborhoods including Trinity Park, Old West Durham, Duke Park, and Walltown combine walkable, tree-lined streets with proximity to Duke's campuses and Ninth Street's dining and retail district. South Durham and the RTP corridor serve a different renter profile of professionals and corporate relocators, with the HUB RTP development and biotech and semiconductor employers such as Wolfspeed anchoring some of the market's newest and highest-rent apartment supply, per the Cedeno Group's submarket analysis. Southside, near downtown and the American Tobacco Campus, is undergoing active redevelopment with new construction and renovated historic homes, while Carolina Arbors and Forest Hills are frequently cited by local investment guides as stable, established neighborhoods for buy-and-hold single family strategies.
The submarket conclusion for an investor is that downtown Durham offers redevelopment and adaptive reuse upside balanced against older vintage risk and softer retail performance, the Duke and Ninth Street corridor offers durable institutional rental demand that requires higher-touch property management, and South Durham and RTP offer the newest supply and highest rents but with more exposure to the lease-up and hiring cycles of a concentrated set of biotech and technology employers.
Section 18Opportunities
The clearest structural opportunity in Durham is the thinning multifamily supply pipeline meeting a research and biotech employment base that, while currently under pressure, remains one of the deepest concentrations of life sciences activity in the country. With Triangle-wide 2026 deliveries forecast by Northmarq to fall to roughly 5,100 units, 32 percent below the long-term average, investors who acquire well-located Durham apartment assets during the current period of elevated vacancy and flat rents are positioned to benefit as the pipeline continues to thin into 2027, consistent with Northmarq's own year-end 2026 forecast of 8.2 percent vacancy for the broader Triangle. Value-add strategies targeting the pre-2000 vintage stock that dominates downtown Durham's transaction volume represent one expression of this thesis.
Research Triangle Park's approval of the RTP 3.0 land use framework is a second, longer-horizon opportunity, opening 7,000 acres of largely single-use corporate campus land to mixed-use redevelopment for the first time since the park's founding in 1959, a transformation that RTP.org describes as one of the most consequential in the park's history. Grocery-anchored retail is a third, more immediate opportunity, supported by eight consecutive quarters of positive net absorption outpacing deliveries across the Triangle and by Durham's own 2.80 percent retail vacancy, among the tightest of any property type in the market. Finally, Duke University's $203 million HomeGrown initiative, including a $60 million target for affordable housing investment through community development financial institutions and increased capital spending with local construction firms, signals a multi-year commitment of institutional capital into Durham's housing and construction economy that investors partnering with or adjacent to these programs may be able to access.
Section 19Risks
The most immediate risk in Durham is the labor market's dependence on federal research funding and a concentrated set of biotech and life sciences employers. The Durham-Chapel Hill metro lost about 3,800 jobs in the twelve months through February 2026, driven in part by NIH funding cuts that triggered a Duke hiring freeze and layoffs at RTI International, Charles River Laboratories, and National Resilience, a pattern of federal budget exposure that has no clear parallel in Raleigh's more diversified corporate and government employment base. Housing and multifamily fundamentals compound this risk: Durham's 11.2 percent apartment vacancy is the softest in the Triangle, and its for-sale housing prices, per Redfin and Zillow, have posted year-over-year declines through mid-2026, meaning investors should not assume near-term rent or price appreciation to offset elevated carrying costs.
Those carrying costs are themselves rising on two fronts simultaneously. Combined city and county property tax rates increased in both the FY2025-26 and FY2026-27 budget cycles, producing a median effective rate of 1.39 percent that is meaningfully above both national and state medians, while North Carolina homeowners insurance rates are set to rise a cumulative 15 percent or more in Durham and Wake counties through mid-2026 under the current Department of Insurance settlement, with a separate, larger dwelling policy rate increase of up to 68.3 percent over two years still under negotiation for landlords and investment property owners specifically. Sector-specific risks add further texture: industrial vacancy in the Durham-Chapel Hill MSA is forecast to keep rising through 2026 as 3.2 million square feet of additional supply delivers into a market already absorbing below its historical average, and downtown Durham's 7 percent retail vacancy signals that the neighborhood's post-pandemic foot traffic recovery remains incomplete even as the broader Durham retail market stays tight. Physical risk, while not a coastal hurricane threat, still registers in the extreme band of FEMA's National Risk Index for both flood and hurricane-related exposure, a genuine cost driver behind the insurance trends described above.
Section 20Investor Implications
For an investor evaluating Durham, the evidence supports a research and institution-driven long-term thesis paired with near-term operational caution. Duke University and Duke Health's more than 57,000 employees, Research Triangle Park's 385-plus companies and 55,000 workers, and Duke's own $203 million multi-year local reinvestment commitment together represent a genuinely durable, if currently pressured, economic base that has weathered federal funding volatility before and is likely to do so again. The apartment supply picture is turning favorable on a forward-looking basis, with Triangle-wide 2026 deliveries forecast to fall well below the long-term average, a setup that historically precedes tightening vacancy and renewed rent growth, though Durham enters that transition from a softer starting point than Raleigh.
The discipline required is in underwriting costs and near-term fundamentals honestly rather than assuming a quick turnaround. Every Durham deal should model the current combined property tax rate of just over $1.00 per $100 of assessed value, an insurance quote that reflects the ongoing statewide rate increases for both homeowners and dwelling policies, and apartment or single-family rent assumptions that start from today's flat-to-declining base rather than from pre-2024 peak levels. Investors comfortable underwriting Durham's federal research funding exposure and its currently soft multifamily and for-sale housing cycle, while pricing rising carrying costs explicitly, are being offered access to one of the country's most durable life sciences and higher-education-anchored economies at a point in the cycle when both pricing and competition for assets are less intense than in Raleigh. Those seeking immediate rent growth or price appreciation should treat Durham's current data as a clear signal to wait or to underwrite conservatively rather than as a market already positioned for near-term gains.
Section 21Conclusion
Durham in the fall of 2026 is a market defined by its institutions rather than by rapid population or job growth. Duke University, Duke Health, and Research Triangle Park anchor a genuinely world-class research and biotech economy, one now navigating a real, federally-driven employment slowdown that has cost the metro thousands of jobs even as neighboring Raleigh continued to add them. Apartment vacancy in Durham is the softest in the Triangle, home prices are drifting modestly lower across every major index, and industrial vacancy is set to keep rising through 2026 as new supply delivers, while retail remains the market's clear bright spot with tight vacancy and consistent absorption. Against these near-term headwinds stand thinning forward multifamily supply, Research Triangle Park's ambitious RTP 3.0 redevelopment, and Duke's own multi-year local reinvestment commitment, developments that point toward a more constructive setup by 2027 and beyond. Durham rewards investors who separate its durable institutional and research advantages from its currently soft operating fundamentals, underwriting the latter with the same rigor as the former, rather than assuming the market's academic and biotech prestige alone guarantees near-term investment performance.
Sources
- U.S. Census Bureau data via Wikipedia, Durham, North Carolina, https://en.wikipedia.org/wiki/Durham,_North_Carolina
- U.S. Census Bureau data via Wikipedia, Durham County, North Carolina, https://en.wikipedia.org/wiki/Durham_County,_North_Carolina
- World Population Review, Durham, North Carolina Population 2026, https://worldpopulationreview.com/us-cities/north-carolina/durham
- Federal Reserve Bank of St. Louis (FRED), Resident Population in Durham-Chapel Hill, NC (MSA), https://fred.stlouisfed.org/series/RADPOP
- Census Reporter, Durham-Chapel Hill, NC Metro Area Profile, http://censusreporter.org/profiles/31000US20500-durham-chapel-hill-nc-metro-area/
- U.S. Bureau of Labor Statistics, Durham-Chapel Hill, NC Economy at a Glance, https://www.bls.gov/eag/eag.nc_durham_msa.htm
- U.S. Bureau of Labor Statistics, North Carolina Economy at a Glance, https://www.bls.gov/eag/eag.nc.htm
- Federal Reserve Bank of St. Louis (FRED), Unemployment Rate in Durham-Chapel Hill, NC (MSA), https://fred.stlouisfed.org/series/DURH537URN
- The News & Observer, Disruptive year shuffles list of Triangle's biggest employers, https://www.newsobserver.com/news/business/article315754322.html
- Research Triangle Regional Partnership, Life science companies are looking to fill jobs across the Triangle, https://researchtriangle.org/news/life-science-companies-are-looking-to-fill-jobs-across-the-triangle-heres-a-breakdown/
- Yahoo Finance / WRAL, Gene therapy drug developer lays off 120 at Durham facility near Research Triangle Park, https://finance.yahoo.com/news/gene-therapy-drug-developer-lays-221504017.html
- WRAL, Pharma researcher Charles River to close Durham facility, https://www.wral.com/archive/21833234/
- U.S. Census Bureau American Community Survey data via Every City in the USA, Durham, NC Population 2025, https://www.everycityintheusa.com/cities/durham-nc/
- North Carolina Demographics, Durham Demographic Statistics, https://www.northcarolina-demographics.com/durham-demographics
- Neilsberg, Durham, NC Income Statistics, https://www.neilsberg.com/insights/topic/durham-nc-income/
- Lee & Associates, Q1 2026 Raleigh-Durham NC Multifamily Market Report, https://www.lee-associates.com/raleigh/wp-content/uploads/sites/64/2026/04/2026-Q1-Raleigh-Durham-NC-Multifamily.pdf
- Yardi Matrix, Raleigh Multifamily Market Report, June 2026, https://www.yardimatrix.com/blog/raleigh-multifamily-market-report/
- Northmarq, Raleigh-Durham multifamily construction activity falls to a five year low, https://www.northmarq.com/insights/insights/raleigh-durham-multifamily-construction-activity-falls-five-year-low-q1-2026
- Northmarq, Vacancy levels off as new multifamily construction starts decline, Raleigh-Durham, https://www.northmarq.com/insights/insights/vacancy-levels-new-multifamily-construction-starts-decline-raleigh-durham
- Northmarq, Raleigh-Durham's multifamily transaction activity rebounds fourth quarter, https://www.northmarq.com/insights/insights/raleigh-durhams-multifamily-transaction-activity-rebounds-fourth-quarter
- The Cedeno Group, Durham's Cap Rates Look The Same On Paper. The Deals Behind Them Aren't, https://thecedenogroup.com/blog/durhams-cap-rates-look-the-same-on-paper-the-deals-behind-them-arent
- HUD User, FY 2026 Schedule of Fair Market Rents, https://www.huduser.gov/portal/datasets/fmr/fmr2026/FY2026_FMR_Schedule.pdf
- PlainRent, Durham County Fair Market Rents FY 2026, https://plainrent.com/counties/durham-county-nc
- Durham Housing Authority, 2026 Payment Standards, https://www.durhamhousingauthority.org/payment-standards
- Redfin, Durham, NC Housing Market, https://www.redfin.com/city/4909/NC/Durham/housing-market
- Redfin, Durham County, NC Housing Market, https://www.redfin.com/county/2038/NC/Durham-County/housing-market
- Zillow, Durham, NC Home Values, https://www.zillow.com/home-values/24457/durham-nc/
- Hodge & Kittrell Sotheby's International Realty, Durham's Home Prices Didn't Get the Tech Boom Memo, https://hodgekittrellsir.com/blog/durhams-home-prices-didnt-get-the-tech-boom-memo
- Hodge & Kittrell Sotheby's International Realty, Durham Investment Property Guide: Downtown to RTP, https://hodgekittrellsir.com/blog/durham-investment-property-guide-from-downtown-to-rtp
- CBRE, Raleigh-Durham Industrial Figures, Q2 2026, https://www.cbre.com/insights/figures/raleigh-durham-industrial-q2-2026
- CBRE, Raleigh-Durham Industrial Figures, Q1 2026, https://www.cbre.com.sg/insights/figures/raleigh-durham-industrial-q1-2026
- CBRE, Raleigh-Durham 2026 U.S. Real Estate Market Outlook, https://www.cbre.com/insights/reports/raleigh-durham-2026-u-s-real-estate-market-outlook
- SVN Real Estate Advisors, Durham-Chapel Hill MSA Industrial Market Report, Q1 2026, https://www.svn-rea.com/news/durham-chapel-hill-msa-industrial-market-report-q1-2026
- Newmark, 1Q26 Raleigh-Durham North Carolina Office Market Report, https://nmrk.imgix.net/uploads/fields/pdf-market-reports/1Q26-Raleigh-Durham-North-Carolina-Office-Market-Report.pdf
- Lee & Associates, Q1 2026 Durham, NC Retail Market Report, https://www.lee-associates.com/wp-content/uploads/2026/04/2026-Q1-Durham-NC-Retail.pdf
- Cornovus Capital, Southeast Retail Market Report, Q1 2026, https://cornovuscapital.com/q1-2026-southeast-us-retail-market-report/
- Triangle Properties, 1Q 2026 Triangle Market Report, https://www.triprop.com/wp-content/uploads/1Q26-Triangle-Market-Report.pdf
- Downtown Durham, Inc., 2026 State of Downtown Durham Report, https://downtowndurham.com/wp-content/uploads/2026/04/2026StateOfDowntownDurhamReport.pdf
- ConnectCRE, Integral Announces Construction Start for 900-Unit Durham Apartment Development, https://www.connectcre.com/stories/integral-announces-construction-start-for-900-unit-durham-apartment-development/
- CLS Commercial Real Estate, Office Investing in Durham: A Complete Guide, https://clscre.com/blog/office-investing-durham-guide.html
- Spotlight NC, Durham NC Property Taxes Explained, https://spotlightnc.com/blog/durham-nc-property-taxes-explained-what-every-homeowner-and-buyer-needs-to-know
- Durham County Tax Administration / Durham County government, Durham County Residents to Receive 2026 Tax Bills Soon, https://dconc.gov/DurhamCo-News/Durham-County-Residents-to-Receive-Tax-Bills-Soon3.htm
- TriangleTaxMap, City of Durham property taxes (Durham County) FY 2026-27, https://triangletaxmap.com/nc/durham/durham/
- The News & Observer, Durham County's new $1B budget will raise taxes to fund public services, https://www.newsobserver.com/news/local/counties/durham-county/article308218440.html
- Triangle Business Journal, Homeowner's insurance rates to rise in North Carolina, https://www.bizjournals.com/triangle/news/2025/01/17/homeowners-insurance-rates-to-rise-in-north-carol.html
- North Carolina Department of Insurance, Commissioner Causey negotiates settlement on Rate Bureau's homeowners insurance request, https://www.ncdoi.gov/news/press-releases/2025/01/17/commissioner-causey-negotiates-settlement-rate-bureaus-homeowners-insurance-request
- WRAL, North Carolina home insurance premium base rates increasing about 15% by mid-2026, https://www.wral.com/story/north-carolina-home-insurance-premium-base-rates-increasing-about-15-by-mid-2026/21817153/
- North Carolina Department of Insurance, Insurance companies request 68.3% increase for dwelling policies, https://www.ncdoi.gov/news/press-releases/2025/11/03/insurance-companies-request-683-increase-dwelling-policies
- North Carolina General Assembly, General Statutes Chapter 42, Landlord and Tenant, https://www.ncleg.gov/enactedlegislation/statutes/html/bychapter/chapter_42.html
- FindLaw, North Carolina General Statutes Section 42-51, Permitted uses of the deposit, https://codes.findlaw.com/nc/chapter-42-landlord-and-tenant/nc-gen-st-sect-42-51/
- RiskBeforeBuy, Durham, NC Climate Risk Report, https://www.riskbeforebuy.com/city/north-carolina/durham
- FEMA, Disaster 3617 (Hurricane Helene, North Carolina), https://www.fema.gov/disaster/3617
- Federal Reserve Bank of Richmond, Hurricane Helene: Exposing Gaps in Flood Risk and Insurance, https://www.richmondfed.org/research/national_economy/macro_minute/2024/hurricane_helene_flood_risk_and_insurance_20241015
- The Washington Post, FEMA flood maps underestimated the risk in North Carolina, https://www.washingtonpost.com/weather/2024/10/13/fema-flood-maps-hurricane-helene/
- Research Triangle Park (RTP.org), homepage and company directory, https://www.rtp.org/
- RTP.org, Research Triangle Park companies unanimously approve RTP 3.0, https://www.rtp.org/2026/06/research-triangle-park-approves-3-0/
- RTP.org, Wake County Economic Development: Economy and Business Feature, RTP 3.0 and the Future of Research Triangle Park, https://www.rtp.org/2026/01/wake-county-economic-development-economy-business-feature-rtp-3-0-and-the-future-of-research-triangle-park/
- Wikipedia, Research Triangle Park, https://en.wikipedia.org/wiki/Research_Triangle_Park
- Wikipedia, Raleigh-Durham International Airport, https://en.wikipedia.org/wiki/Raleigh%E2%80%93Durham_International_Airport
- GoRaleigh, Service Alerts (Durham-Orange Light Rail discontinued), https://goraleigh.org/service-alerts-1
- Duke University, Duke Commits $203 Million Over Three Years to Expand Economic Opportunity in Durham and the Triangle, https://today.duke.edu/2026/03/duke-commits-203-million-over-three-years-expand-economic-opportunity-durham-and-triangle
- Duke Community Affairs, Our Impact, https://community.duke.edu/our-impact/
- Forbes, Duke University Pledges $203 Million To Durham And The Triangle, https://www.forbes.com/sites/michaeltnietzel/2026/03/19/duke-university-to-invest-203-million-in-durham-and-the-triangle-economy/