In brief · summary: Fort Collins
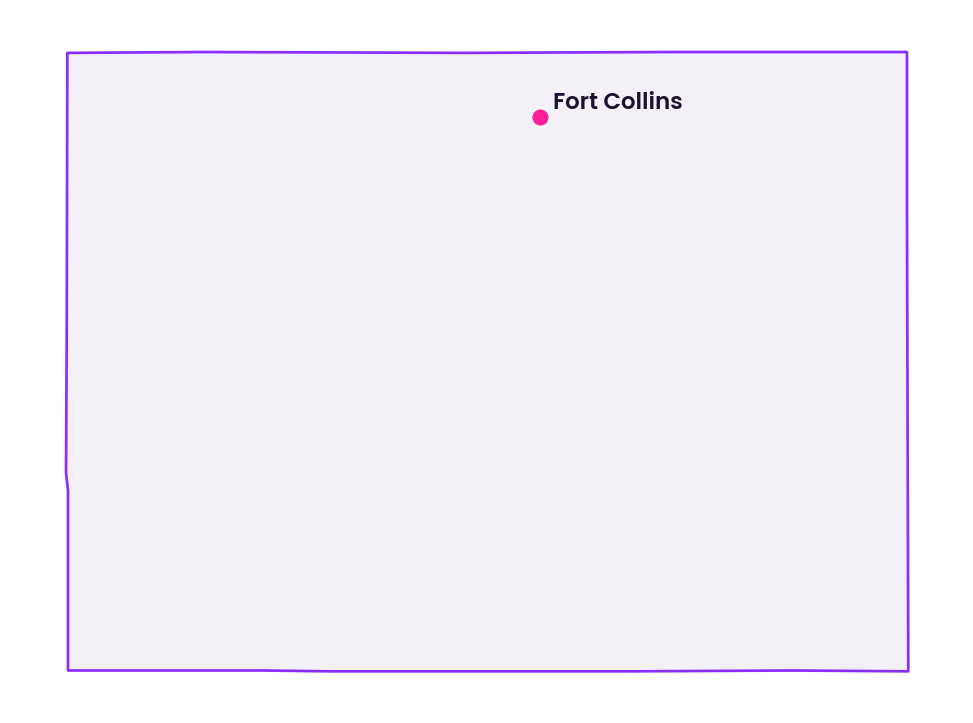
Fort Collins is a university anchored city at the north end of Colorado's Front Range, roughly 65 miles north of Denver, and its real estate profile is shaped above all by Colorado State University and by a diversified base of technology and health care employers. The Census Reporter tabulation of the American Community Survey 2024 one year data places the city population at about 170,927, consistent with the Census Bureau count of 169,810 at the 2020 census and its estimate of 171,500 as of July 1, 2025.
The city grew strongly through the 2010s, from 143,986 in the 2010 census, but the pace has slowed sharply to roughly 1.0% since 2020. The economy is healthy, with a Larimer County unemployment rate of 3.6% in June 2026 per the Bureau of Labor Statistics Local Area Unemployment Statistics series carried on the Federal Reserve Economic Data platform.
The demographic signature is youth and churn: the median age is just 31.8 years per Census Reporter, renters occupy roughly half of all housing units, and about a fifth of residents moved within the prior year, all reflecting the university's outsized role. For real estate in 2026, the story is a market that has stabilized at high price points after the pandemic era surge. Zillow …
Section 01Executive Summary
Fort Collins is a university anchored city at the north end of Colorado's Front Range, roughly 65 miles north of Denver, and its real estate profile is shaped above all by Colorado State University and by a diversified base of technology and health care employers. The Census Reporter tabulation of the American Community Survey 2024 one year data places the city population at about 170,927, consistent with the Census Bureau count of 169,810 at the 2020 census and its estimate of 171,500 as of July 1, 2025. The city grew strongly through the 2010s, from 143,986 in the 2010 census, but the pace has slowed sharply to roughly 1.0% since 2020. The economy is healthy, with a Larimer County unemployment rate of 3.6% in June 2026 per the Bureau of Labor Statistics Local Area Unemployment Statistics series carried on the Federal Reserve Economic Data platform. The demographic signature is youth and churn: the median age is just 31.8 years per Census Reporter, renters occupy roughly half of all housing units, and about a fifth of residents moved within the prior year, all reflecting the university's outsized role.
For real estate in 2026, the story is a market that has stabilized at high price points after the pandemic era surge. Zillow reports an average Fort Collins home value of $568,389, down 1.3% year over year as of mid 2026, while Redfin reports a median sale price of $574,687 in June 2026, up 1.0% year over year, a split that reflects a market moving roughly sideways. On the rental side, apartment vacancy sits in the mid single digits, with Matthews reporting a 5.51% vacancy rate from CoStar data over the trailing twelve months, and rents have grown modestly. Property taxes are among the lowest in the nation thanks to Colorado's assessment structure, but homeowners insurance has become a genuine cost problem statewide, driven by wildfire and hail exposure. What follows is a section by section analysis for educational purposes, with each figure tied to a named public source and its scope stated in the text.
Section 02Population and Migration
Fort Collins is a midsized city whose population is heavily influenced by Colorado State University. Census Reporter, drawing on the American Community Survey 2024 one year data, places the city population at 170,927, while the Census Bureau derived Data USA profile reports a 2024 population of 170,229; the two are effectively consistent and the small difference reflects survey versus estimate methodology. The Census Bureau counted 143,986 residents at the 2010 census and 169,810 at the 2020 census, an increase of about 17.9%, and estimated the city at 171,500 as of July 1, 2025, so the long run growth story is intact but the pace has slowed sharply to roughly 1.0% since 2020. The surrounding Fort Collins Loveland metropolitan area, which is coterminous with Larimer County, contained 161,464 households per Census Reporter.
The age and mobility profile is the single most important demographic fact for investors, and it is driven by the university. The following table sets out the core demographic components from Census Reporter's American Community Survey 2024 tabulation for the city.
| Component | Fort Collins value | Benchmark | Source and scope |
|---|---|---|---|
| Median age | 31.8 years | United States 39.2 years | Census Reporter, ACS 2024 1 year, city |
| Population age 20 to 29 | 24% | Share of city population | Census Reporter, ACS 2024 1 year, city |
| Owner occupied share of occupied units | 51% | Renter occupied 49% | Census Reporter, ACS 2024 1 year, city |
| Persons per household | 2.2 | Colorado 2.4 | Census Reporter, ACS 2024 1 year, city |
| Moved in the prior year | 20.8% | United States 11.8% | Census Reporter, ACS 2024 1 year, city |
| Persons below poverty line | 15% | Metro 10.7% | Census Reporter, ACS 2024 1 year, city |
The conclusion is that Fort Collins behaves like a large college town: a young median age, small households, an almost even split between owners and renters, elevated annual mobility, and a poverty rate lifted well above the surrounding metro by the large student population. For rental housing this is a structural tailwind, since roughly half of occupied units are rented and turnover is high, but it also means headline income and poverty statistics understate the true affluence of the nonstudent, working population.
On migration, Redfin's relocation tracking for the first quarter of 2026 shows the dominant inbound flow into Fort Collins came from Denver, with a net inflow of 649 Redfin users, followed at a distance by Chicago and San Francisco. That pattern reflects Front Range residents moving north for relative value and lifestyle. The same dataset shows only small net outflows to lower cost or warmer metros such as Orlando and Tucson. The net signal is a city that pulls population primarily from the Denver metro to its south, reinforcing its role as the anchor of Northern Colorado.
Section 03Jobs and Economic Anchors
The Fort Collins economy is anchored by education, health care, and advanced manufacturing, and it runs at effectively full employment. The Bureau of Labor Statistics Local Area Unemployment Statistics series reported a Larimer County unemployment rate of 3.6% in June 2026, matching the Fort Collins metropolitan area reading, and the Bureau of Labor Statistics Fort Collins area economic summary was updated on August 3, 2026. Larimer County's own economic development office, in its Northern Colorado labor market profile, describes a human capital based economy rather than a manufacturing dependent one.
Colorado State University is the defining institution and, according to Colorado State University news and media relations, the largest employer in Larimer County, with UCHealth, whose Poudre Valley Hospital serves Fort Collins, ranking among the largest as well. As a land grant research university, Colorado State drives not only direct employment but also a steady pipeline of students, faculty, and research spending that underpins housing demand. The Colorado State University System reports approximately 7,599 total employees at the Fort Collins campus, making the university by far the largest single employer in the county.
The advanced manufacturing base gained a major vote of confidence in 2026. The Colorado Sun reported on July 8, 2026 that Apple's $1.5 billion manufacturing agreement with the chipmaker Broadcom would benefit a Fort Collins facility, where Broadcom has operated a semiconductor plant for years, and that the arrangement is tied to producing 15 billion chips for Apple. Fort Collins also hosts a cluster of technology and consumer products firms including Woodward and OtterBox, along with a nationally known craft brewing sector led by New Belgium and Odell and the large Budweiser brewery operated by Anheuser Busch. The analytical conclusion is that Fort Collins carries a high quality, diversified employment base with a research university at its core and a growing semiconductor anchor, which supports durable long run housing demand, tempered by the reality that a university town's payroll is concentrated in public sector education and health care that grow steadily rather than explosively.
Section 04Income
Measured income in Fort Collins is distorted downward by the student population, a nuance investors must hold in mind. The city and metro income measures from Census Reporter's American Community Survey 2024 one year tabulation are set out below.
| Income measure | Value | Source and scope |
|---|---|---|
| Median household income, city | $81,199 | Census Reporter, ACS 2024 1 year |
| Per capita income, city | $48,392 | Census Reporter, ACS 2024 1 year |
| Median household income, metro | $93,276 | Census Reporter, ACS 2024 1 year |
| Per capita income, metro | $54,178 | Census Reporter, ACS 2024 1 year |
| Median household income, United States | $81,604 | Census Reporter benchmark |
Both city figures sit below the surrounding Fort Collins Loveland metropolitan figures, precisely because tens of thousands of low earning students live inside the city limits and pull the city numbers down relative to the metro. The city median household income is about the same as the national median of $81,604. For context, the Census Bureau QuickFacts ACS 2020 to 2024 five year file reports a somewhat higher city median household income of $85,070, the difference reflecting the one year versus five year measurement window.
The household income distribution, shown below from Census Reporter, illustrates a broad middle rather than the top heavy profile of a wealthy suburb.
| Household income band | Share of Fort Collins households | Source and scope |
|---|---|---|
| Under $50,000 | 27% | Census Reporter, ACS 2024 1 year, city |
| $50,000 to $100,000 | 33% | Census Reporter, ACS 2024 1 year, city |
| $100,000 to $200,000 | 26% | Census Reporter, ACS 2024 1 year, city |
| Over $200,000 | 14% | Census Reporter, ACS 2024 1 year, city |
The conclusion for investors is twofold. First, the large share of households under $50,000, at 27%, is inflated by students and does not by itself indicate a weak consumer base. Second, the deep renter demand pool and the metro level income near $93,276 are the more relevant benchmarks for underwriting workforce and market rate apartments, since the true earning power of the nonstudent population is closer to the metro figure than to the city median.
Section 05Housing and Multifamily
Fort Collins housing tenure is unusually balanced between ownership and renting, which is central to the multifamily thesis. The core housing stock figures for the city are summarized below.
| Housing measure (Fort Collins city) | Value | Source and scope |
|---|---|---|
| Owner occupied share of occupied units | 51% | Census Reporter, ACS 2024 1 year |
| Renter occupied share of occupied units | 49% | Census Reporter, ACS 2024 1 year |
| Households | 74,814 | Census Reporter, ACS 2024 1 year |
| Total housing units | 77,858 | Census Reporter, ACS 2024 1 year |
| Single unit structures share | 59% | Census Reporter, ACS 2024 1 year |
| Median value of owner occupied home | $577,900 | Census Bureau QuickFacts, ACS 2020 to 2024 |
The near even split between owners and renters is rare among cities and reflects the student and young professional base, while a 59% single unit share leaves a substantial multifamily and attached component. The QuickFacts median owner occupied value of $577,900 for the ACS 2020 to 2024 period sits modestly below the metro figure of $610,000 reported by Census Reporter and roughly in line with the Colorado median of $574,600, and it is consistent with the current market readings from Zillow and Redfin in the high $560,000s to mid $570,000s.
On apartment fundamentals, the most useful current reads come from CoStar data republished by brokerages, since city specific vendor detail is otherwise thin and the metro serves as the defensible proxy. Matthews, citing CoStar, reported a Fort Collins multifamily vacancy rate of 5.51% with net absorption of 151 units and rent growth of 1.6% over the trailing twelve months. A separate analysis from NorthPeak, also citing CoStar, described Fort Collins as holding the lowest apartment vacancy rate across the Front Range at 7.4% in an earlier period, with rents projected to rise 1.5% in 2025. The multifamily case rests on the balanced tenure profile, the university driven turnover that keeps demand replenished, and the relatively contained vacancy compared with faster growing Front Range metros to the south.
Section 06Rents
Rent levels in Fort Collins are high relative to the nation and have grown modestly, though published averages vary widely by source and methodology, so they must be read with their scope attached. The most authoritative government benchmark is the Department of Housing and Urban Development Fair Market Rent, which for fiscal year 2026 sets the two bedroom Fair Market Rent for the Fort Collins Loveland metropolitan area at $1,732, a level that ranks the metro among the more expensive markets nationally. Private trackers report a range of averages depending on whether they cover all units or a specific segment. The table below consolidates the available readings.
| Source | Rent measure | Value | Scope and date |
|---|---|---|---|
| HUD Fair Market Rent | Two bedroom Fair Market Rent | $1,732 | Fort Collins Loveland metro, FY2026 |
| Census Bureau QuickFacts | Median gross rent, all renter units | $1,690 | Fort Collins city, ACS 2020 to 2024 |
| Apartments.com | Average rent, all units | $1,636 | Fort Collins city, 2026 |
| Apartments.com | Studio average rent | $1,454 | Fort Collins city, 2026 |
| RentCafe (via BisonRE summary) | Average apartment rent | $1,935 | Fort Collins city, February 2026 |
| Matthews via CoStar | Rent growth, trailing twelve months | +1.6% | Fort Collins, 2026 |
The conclusion is that a defensible central estimate for a typical Fort Collins apartment rent sits somewhere in the range from the mid $1,600s to the mid $1,700s depending on unit mix, with the RentCafe figure near $1,935 likely reflecting a newer or larger unit sample. What matters for underwriting is the direction and pace: rent growth is positive but low, in the range of 1.5% to 2% per recent CoStar based readings, which argues for conservative rent growth assumptions rather than a return to the rapid gains of the early 2020s. Any pro forma assuming faster acceleration should be labeled a scenario value rather than a forecast of fact.
Section 07Vacancy
Apartment vacancy in Fort Collins is moderate and, by Front Range standards, relatively tight. Matthews, citing CoStar, put the trailing twelve month vacancy rate at 5.51%, while NorthPeak, also citing CoStar for an earlier period, described Fort Collins as the lowest vacancy market on the Front Range at 7.4%. The difference between these figures reflects different time windows and unit universes rather than a contradiction, and together they place Fort Collins apartment vacancy in the mid single digits to low seven percent range, healthier than the higher vacancy seen in supply heavy metros such as Denver to the south.
For the for sale market, the inventory picture is looser than it was during the pandemic. Redfin data show homes taking a median of 47 days to sell in June 2026, two days longer than a year earlier, and 30.4% of listings recorded a price drop, up 1.3 percentage points year over year, both signs of a market where buyers have regained some leverage. The conclusion is that vacancy and inventory risk in Fort Collins is currently balanced: apartments remain relatively tight and well occupied, while the resale market has softened at the margin without tipping into oversupply. This equilibrium favors income stability over rapid rent or price gains.
Section 08Supply Pipeline
The supply picture is the area where city specific public data are thinnest, so it must be described with appropriate caution. The clearest available demand signal is Matthews' CoStar based figure of 151 units of net absorption over the trailing twelve months alongside a 5.51% vacancy rate, which together indicate a market absorbing new units without a vacancy spike.
Two structural factors shape Fort Collins supply. First, the city has a long tradition of managed growth and land use control, which constrains how quickly new large scale apartment supply can be entitled and delivered relative to less regulated jurisdictions. Second, the university generates a persistent need for student oriented housing near campus that is somewhat insulated from the broader for sale cycle. The conclusion is that supply appears to be broadly in balance with demand as of 2026, with vacancy contained in the mid single digits, and that Fort Collins is less exposed to the acute oversupply risk facing higher growth Front Range metros, though the absence of a precise public construction pipeline figure means this judgment rests on absorption and vacancy data rather than on a direct count of units.
Section 09Single Family Homes
The Fort Collins for sale market has plateaued at a high level, with the major trackers split between marginally negative and marginally positive readings, which is itself the signal that the market is moving sideways. The table below presents the headline price measures with their scopes.
| Source | Metric | Value | Change year over year | Scope and date |
|---|---|---|---|---|
| Zillow | Average home value | $568,389 | -1.3% | Fort Collins, mid 2026 |
| Redfin | Median sale price | $574,687 | +1.0% | Fort Collins, June 2026 |
| Redfin | Median price per square foot | $265 | -3.6% | Fort Collins, June 2026 |
| Census Bureau QuickFacts (ACS) | Median owner occupied value | $577,900 | Not a year over year measure | Fort Collins, ACS 2020 to 2024 |
Beneath the flat headline, activity has actually picked up, as the Redfin market metrics for June 2026 show.
| Redfin market activity (Fort Collins) | Value | Change year over year | Scope and date |
|---|---|---|---|
| Homes sold | 760 | +9.5% | June 2026 |
| Sale to list price ratio | 99.6% | not stated | June 2026 |
| Homes sold above list price | 25.3% | not stated | June 2026 |
| Redfin Compete Score | 60 | not stated | June 2026 |
The decline in price per square foot of 3.6% alongside a stable median sale price suggests buyers are getting more space per dollar, consistent with a shift in mix and modestly improved affordability. The conclusion is a healthy but no longer frothy resale market: transactions are rising, competition is moderate, and prices are holding near a high plateau rather than climbing.
For the single family rental angle, Fort Collins offers strong renter demand from students, young professionals, and households priced out of ownership at a median owner value near $580,000, but the same high entry prices compress gross rental yields. Investors pursuing single family rentals must also account for the city's rental regulations, discussed in the regulatory section, which limit the number of unrelated occupants per dwelling and therefore constrain the by the room leasing model that would otherwise boost yields near campus. No precise, current Fort Collins only single family rent index from a primary vendor is available here to state an exact figure, so single family rents should be underwritten from comparable listings.
Section 10Commercial Real Estate and Retail Centers
Commercial conditions in Fort Collins are best read through Northern Colorado regional data, since the city's commercial inventory is reported at that scale. The office sector carries the most vacancy. A Northern Colorado commercial overview reported an office vacancy rate of 11.8% across a regional inventory of about 10,422,960 square feet, with modest positive net absorption of 42,626 square feet year to date and no new construction underway, while neighboring Weld County office vacancy sat much lower near 4.5%. Industrial and logistics is tighter than office but softening as new supply arrives. Matthews reported a Northern Colorado industrial vacancy rate of 9.5% in the first quarter of 2026, up from 8.9% a year earlier and nearing a decade high, while a mid 2026 Front Range summary placed the combined Fort Collins, Greeley, and Weld industrial vacancy at 8.1%. The table below consolidates the commercial readings.
| Sector | Vacancy rate | Source and scope |
|---|---|---|
| Office | 11.8% | Northern Colorado commercial overview, regional inventory |
| Office, Weld County | 4.5% | Northern Colorado office update, Weld County |
| Industrial and logistics | 9.5% (Q1 2026) | Matthews, Northern Colorado, up from 8.9% a year earlier |
| Industrial, Fort Collins, Greeley, Weld | 8.1% | Front Range market summary, mid 2026 |
Retail is the sector with the thinnest current public figures, so it is described in words rather than with an invented number. Fort Collins supports a strong retail trade area given its role as the commercial hub of Northern Colorado, its university population, and its affluent surrounding suburbs, and grocery anchored neighborhood centers serving daily needs in growing suburbs have historically posted low vacancy and resilient demand. No precise, current Fort Collins retail vacancy rate from a primary vendor is available here to state a specific figure. The overall conclusion is a clear sector ranking: office carries elevated vacancy near 12% and is a value and repositioning story, industrial is fundamentally sound but working through a supply driven rise toward decade high vacancy, and grocery anchored and daily needs retail serving the region's growing population is the most defensive commercial segment.
Section 11Transactions and Capital Markets
Investment sales activity in Fort Collins multifamily has been thin through the high interest rate environment, and current transaction based pricing is not well captured in public sources. Matthews' CoStar based development report for Fort Collins showed no recorded sales volume in its trailing twelve month snapshot, consistent with a national pattern in which buyers and sellers remained apart on price as financing costs rose from 2023 through 2025.
The directional context investors can rely on is that Fort Collins pairs relatively low vacancy near 5.51% with modest positive rent growth and constrained new supply, a fundamentals profile that supports income durability even in a thin transaction market. As interest rate expectations stabilize, the base case is a gradual reopening of transaction volume, though the pace depends on the trajectory of financing costs, which lies outside the scope of this city level review. The absence of active comparable sales also means that any acquisition underwriting should lean more heavily on income and replacement cost analysis than on recent trade comparables.
Section 12Taxes
Property taxes are one of Fort Collins' clearest structural advantages, because Colorado maintains among the lowest effective residential property tax burdens in the country. Colorado assesses residential property at a low fraction of market value and then applies local mill levies, and for the 2026 tax year the Larimer County Assessor, implementing a 2024 special session law known as House Bill 24B 1,001, applies a bifurcated residential assessment rate: 6.8% for local government purposes, reduced by 10% of the first $700,000 of actual value, and 7.05% for school purposes. The assessor's own 2026 residential example makes the burden concrete, as shown below.
| Step | Local government flow | School flow | Source and scope |
|---|---|---|---|
| Actual value | $496,100 | $496,100 | Larimer County Assessor, 2026 example |
| Adjusted actual value | $446,490 | $496,100 | Larimer County Assessor, 2026 example |
| Assessment rate | 6.8% | 7.05% | Larimer County Assessor, 2026 tax year |
| Final assessed value | $30,361 | $34,976 | Larimer County Assessor, 2026 example |
| Mill levy | 38.6380 | 54.0900 | Larimer County Assessor, illustrative |
| Tax dollars | $1,173.09 | $1,891.85 | Larimer County Assessor, 2026 example |
In that worked example, a home with an actual value of $496,100 generates a total estimated property tax of $3,064.94 at a combined mill levy of 92.7280, which works out to an effective rate of roughly 0.62% of market value. That is far below the effective rates common in high tax states, and it materially improves net operating income and after tax returns for owners. On transfer costs, Colorado does not levy a general real estate transfer tax and instead applies only a nominal documentary fee of one cent per $100 of consideration, equal to 0.01% of price, so closing frictions on transfers are minimal. The conclusion is that Colorado's low assessment based property tax and near absence of transfer tax are durable positives for real estate returns in Fort Collins.
Section 13Insurance
Insurance is the mirror image of taxes: it has become one of the most significant and fastest rising costs of owning Colorado real estate. Multiple sources place Colorado among the most expensive states for homeowners insurance. A Colorado State University research report on homeowners insurance trends found Colorado to be the sixth costliest state, with an average annual premium of $4,072 for $300,000 of coverage, and noted premiums had risen 58% from 2018 to 2023. The Colorado Sun, citing Insurify, reported an estimated 2026 average homeowners premium of $4,164, up 61% compared with 2023, against a United States average of $3,057, and noted that Colorado had recorded one of the largest premium increases in the country since 2020. The table below sets out the comparison.
| Measure | Value | Source and scope |
|---|---|---|
| Colorado average premium, $300,000 coverage | $4,072 | CSU research report, 2025 |
| Colorado estimated average premium | $4,164 | Insurify via Colorado Sun, 2026 |
| United States average premium | $3,057 | Insurify via Colorado Sun, 2026 |
| Colorado increase versus 2023 | +61% | Insurify via Colorado Sun, 2026 |
The drivers are wildfire and hail. The Colorado Division of Insurance has noted that hail accounts for an average of 26% to 54% of an annual homeowners premium and affects rates even in areas that do not experience much hail, and the state has stood up a Fair Access to Insurance Requirements plan, known as the FAIR plan, to provide coverage to property owners rejected by the standard market. The conclusion is that insurance is a rising and material cost line that must be underwritten with meaningful escalation in Fort Collins, and that while the city's wildfire exposure is only moderate, discussed further in the climate section, the statewide pricing environment means insurance will weigh on net operating income more heavily here than in low hazard regions of the country.
Section 14Landlord Tenant and Regulatory Environment
Colorado's landlord tenant environment has shifted meaningfully toward tenants in recent years, and Fort Collins layers its own local rules on top, so the regulatory backdrop demands careful attention. At the state level, Colorado continues to prohibit local rent control by statute, which removes the most severe form of rent regulation, but the legislature has enacted a series of tenant protections in 2023 and 2024 covering habitability standards, limits on late fees, and for cause eviction requirements that restrict a landlord's ability to decline to renew or to remove tenants without an enumerated reason. Because the precise statutory citations and their effective dates change with each legislative session, the specific current provisions should be confirmed with Colorado counsel rather than treated as settled here.
At the local level, Fort Collins enforces an occupancy ordinance that limits the number of unrelated persons who may share a dwelling unit, a rule with direct investment consequences because it constrains the by the room and by the bed leasing strategies that would otherwise maximize revenue in a university market. Investors targeting properties near campus must underwrite to the legal occupancy limit rather than to the number of bedrooms. The conclusion is that Fort Collins is a more regulated rental environment than the Colorado prohibition on rent control alone would suggest: the combination of recent state tenant protections and the local occupancy cap means that owners should underwrite conservatively on both revenue and operating flexibility and should verify the current text of both the state statutes and the city ordinance before acquiring.
Section 15Infrastructure
Fort Collins sits on the Interstate 25 corridor at the north end of the Front Range, giving it strong highway connectivity south to Denver and the Denver International Airport roughly 65 miles away, while the Northern Colorado Regional Airport between Fort Collins and Loveland provides regional air service. Within the city, the MAX bus rapid transit line runs along the Mason corridor connecting the downtown and the Colorado State University campus to the south of the city, and the university itself functions as a major generator of trips, jobs, and housing demand. The road and transit network is oriented to a car dependent pattern, with Redfin reporting a Walk Score of 37 and a Transit Score of 28 for the city, though a Bike Score of 78 reflects Fort Collins' nationally recognized cycling infrastructure.
Water infrastructure deserves specific mention because it is a defining constraint and asset for Front Range real estate. Fort Collins draws on the Cache la Poudre River and on the Colorado Big Thompson transmountain diversion project stored in Horsetooth Reservoir, and water availability and the cost of water rights are material considerations for new development across Northern Colorado. The conclusion is that Fort Collins offers solid infrastructure anchored by the university, the interstate corridor, and a well regarded active transportation network, with water supply representing the key long run constraint on the pace and cost of new construction.
Section 16Climate and Physical Risks
Fort Collins sits in a semiarid climate at the base of the Rocky Mountains, and its physical risk profile is dominated by wildfire and hail rather than by the flood and wind hazards that drive losses in coastal markets. Redfin, drawing on First Street data, characterizes the city's flood risk as minor, with about 1% of properties, or 429 in total, facing severe flood risk over the next 30 years, and it rates wind risk as minimal. Wildfire is the more consequential hazard: First Street data reported by Redfin classify wildfire risk as moderate, with 42,465 properties, or about 72% of the city, carrying some degree of wildfire risk over 30 years, a reflection of the city's position along the wildland urban interface. The 2020 Cameron Peak Fire, the largest in Colorado history, burned in the mountains west of Fort Collins and underscored the regional exposure.
Hail is the other defining risk and, as noted in the insurance section, is a primary driver of Colorado's elevated premiums, since the northern Front Range lies within a corridor of frequent damaging hailstorms. Heat risk is rated moderate by First Street, with a projected increase in very hot days over the coming decades, though from a low base given the city's elevation and dry climate. The conclusion is that Fort Collins carries a manageable but real physical risk profile centered on wildfire at the mountain interface and hail across the plains, that flood and wind exposure are low, and that these hazards express themselves financially through insurance cost rather than through the catastrophic single event losses seen in hurricane and coastal flood markets. Parcel level wildfire exposure can and should be diligenced using First Street and local mapping before acquisition.
Section 17Neighborhoods and Submarkets
Fort Collins is organized into distinct submarkets that carry different price points, tenant profiles, and investment theses, generally identifiable by ZIP code. The historic core around Old Town, in the 80,521 area, is the city's premium walkable district, blending restored historic homes, the university's western edge, and a vibrant downtown, and it commands the strongest prices and the deepest student and young professional rental demand. Newer master planned neighborhoods on the southeast side, in the 80,525 and 80,528 areas including Fossil Lake, Rigden Farm, and Bucking Horse, offer larger single family product and family oriented demand at scale. The northern and eastern sections, in the 80,524 area, provide relatively more affordable entry points, while University Park near campus is defined by student rental demand.
Because the university sits toward the south central part of the city, proximity to campus is the key value driver for student oriented rental investment, while the southeast growth corridors are the locus of new single family and family rental demand. The Census Bureau QuickFacts places the citywide median owner occupied value at $577,900 for the ACS 2020 to 2024 period, and submarket values range above and below that figure with Old Town and the newer southeast neighborhoods generally at the higher end. The conclusion is that submarket selection materially shapes both strategy and yield: the Old Town core and near campus areas favor student and young professional rentals subject to the occupancy ordinance, while the southeast corridors favor single family and family oriented rental and for sale investment.
Section 18Opportunities
Several durable opportunities emerge from the data. First, the university anchored economy and the 3.6% June 2026 unemployment rate provide a stable demand floor for housing that is relatively insulated from ordinary business cycles, since public education and health care payrolls grow steadily. Second, the balanced tenure profile, with renters occupying 49% of units, combined with mid single digit apartment vacancy near 5.51%, supports a resilient multifamily income thesis with contained vacancy risk relative to faster growing Front Range metros. Third, the advanced manufacturing base is strengthening, with the Broadcom semiconductor facility positioned to benefit from Apple's $1.5 billion investment, adding high wage employment that broadens the demand base beyond the university. Fourth, Colorado's low assessment based property tax, illustrated by the roughly 0.62% effective rate in the county's own 2026 example, and the near absence of transfer taxes, materially benefit net operating income. Fifth, the plateau in for sale prices, with Zillow down 1.3% and Redfin up only 1.0% year over year, offers a more patient entry environment than the frenzied pandemic era market.
Section 19Risks
The risks are equally concrete. First, insurance cost is a serious and rising headwind, with Colorado premiums among the highest in the nation near $4,072 to $4,164 per year and up more than 60% since 2023, driven by wildfire and hail, which compresses margins unless aggressively underwritten. Second, the regulatory environment has tightened, combining recent Colorado tenant protections with the Fort Collins occupancy ordinance that limits unrelated occupants and constrains the highest yielding student leasing strategies. Third, income and yield math is challenged by high entry prices, with a median owner value near $580,000 against modest rents growing only about 1.5% to 2%, which compresses cap rates and cash yields. Fourth, industrial vacancy has risen to 9.5% and is nearing a decade high, and office vacancy near 11.8% is structurally elevated, so commercial strategies must be selective. Fifth, wildfire exposure at the wildland urban interface affects about 72% of city properties to some degree and expresses itself through both insurance cost and physical risk. Finally, the thin transaction market means price discovery is difficult and exit liquidity may be constrained until financing costs stabilize.
Section 20Investor Implications
Read together, the data describe a stable, university anchored market that rewards income focused, conservatively underwritten strategies rather than appreciation bets. For multifamily, the implication is to underwrite to the contained vacancy near 5.51% and to modest rent growth in the 1.5% to 2% range, treating faster growth as a scenario rather than a base case, while crediting the balanced tenure and steady university demand as sources of occupancy durability. For single family rental strategies, Fort Collins offers strong tenant demand but compressed yields at entry prices near $580,000, and the occupancy ordinance must be built into revenue assumptions for any near campus property. For commercial capital, the sector ranking is clear: favor grocery anchored and daily needs retail serving the region's growth, approach industrial selectively given rising vacancy, and treat office as a value or repositioning play given vacancy near 12%. Across every strategy, the low property tax burden is a structural positive to credit explicitly, while rising insurance costs and a tightening regulatory environment are structural headwinds that must be escalated in every underwriting model. None of the foregoing is a recommendation; it is a framing of what the public data imply, with decisions reserved to the reader and their advisors.
Section 21Conclusion
Fort Collins is a stable, well educated, university anchored city whose real estate fundamentals favor durability over rapid growth. Its population expanded strongly through the 2010s off a base swollen by Colorado State University and has been roughly flat since 2020, its economy runs at full employment with a strengthening semiconductor anchor, and its housing market is split almost evenly between owners and renters, giving multifamily a resilient demand base. In 2026 the market has settled into a high plateau: for sale prices are moving sideways, apartment vacancy is contained in the mid single digits, rents are growing slowly, and commercial conditions vary from a defensive retail segment to an oversupplied office sector. The investment character of Fort Collins is defensive and income oriented, supported by exceptionally low property taxes and steady demand, and constrained by high entry prices, a rising insurance burden, and a tightening regulatory regime. Every figure above is tied to a named public source with its scope stated, and where reliable city level data do not exist, that gap is stated plainly rather than filled with an estimate.
Sources
- Census Reporter, Fort Collins, CO profile (ACS 2024 1 year and 5 year estimates), http://censusreporter.org/profiles/16000US0827425-fort-collins-co/
- United States Census Bureau QuickFacts, Fort Collins city, Colorado (ACS 2020 to 2024 and V2025 population estimate), https://www.census.gov/quickfacts/fact/table/fortcollinscitycolorado
- Data USA, Fort Collins, CO profile (2024 population and income), https://datausa.io/profile/geo/fort-collins-co
- GeoStat, Trends and Changes in Fort Collins, Colorado, https://www.geostat.org/data/fort-collins-co/trends
- Colorado State University System, Campuses page (Fort Collins campus total employees), https://csusystem.edu/campuses/
- Bureau of Labor Statistics via Federal Reserve Economic Data, Unemployment Rate in Larimer County, CO, https://fred.stlouisfed.org/series/COLARI1URN
- Bureau of Labor Statistics via Federal Reserve Economic Data, Unemployment Rate in Fort Collins, CO (MSA), https://fred.stlouisfed.org/series/FORT608UR
- Bureau of Labor Statistics, Fort Collins Area Economic Summary, August 2026, https://www.bls.gov/regions/mountain-plains/summary/blssummary_fortcollins.pdf
- Larimer County, Northern Colorado Workforce Analysis and Labor Market Profile, https://www.larimer.gov/ewd/northern-colorado-workforce-analysis
- Colorado State University News and Media Relations, CSU and UCHealth among Larimer's largest employers, https://newsmediarelations.colostate.edu/inthenews/csu-uc-health-top-list-of-larimers-largest-employers/
- The Colorado Sun, Colorado manufacturing plant to produce 15 billion chips for Apple, July 8, 2026, https://coloradosun.com/2026/07/08/fort-collins-apple-billion-manufacturing-broadcom/
- Zillow, Fort Collins, CO Home Values, https://www.zillow.com/home-values/4764/fort-collins-co/
- Redfin, Fort Collins, CO Housing Market, https://www.redfin.com/city/7006/CO/Fort-Collins/housing-market
- Matthews, Multifamily Development Report, Fort Collins, CO (CoStar data), https://www.matthews.com/insights/multifamily-development-report-fort-collins-co
- NorthPeak Commercial Advisors, Front Range apartment rent and vacancy projections (CoStar data), https://northpeakcre.com/news/heres-where-apartment-rents-are-projected-to-hold-up-best-across-colorados-front-range/
- Apartments.com, Average Rent in Fort Collins, CO, https://www.apartments.com/rent-market-trends/fort-collins-co/
- PlainRent, HUD Fair Market Rent, Fort Collins Loveland, CO MSA FY2026, https://plainrent.com/metros/fort-collins-loveland-co-msa
- BisonRE Group, Fort Collins Investment Real Estate Trends for 2026 (RentCafe reference), https://bisonregroup.com/blog/fort-collins-investment-property-trends-to-watch
- Matthews, Northern Colorado Industrial Market Report Q1 2026, https://www.matthews.com/insights/northern-colorado-industrial-q1-2026
- VidTech, The Northern Colorado Commercial Real Estate Market (office data), https://vidtech.com/blog/the-northern-colorado-commercial-real-estate-market/
- Affinity Real Estate Partners, Northern Colorado Office and Industrial Market Update, https://affinityrepartners.com/news-insights/article/northern-colorado-office-and-industrial-markets/
- Larimer County Assessor, 2026 Residential Account Value Flow Example (House Bill 24B 1,001), https://www.larimer.gov/sites/default/files/account-value-flow-2026.pdf
- Larimer County, Property Tax Calculation, https://www.larimer.gov/performance-budget-and-strategy/Budget/HowIsMyPropertyTaxCalculated
- Colorado Division of Insurance, action to lower homeowners insurance rates (hail share of premium), https://doi.colorado.gov/news-releases-consumer-advisories/division-of-insurance-colorado-takes-further-action-to-lower
- The Colorado Sun, How Colorado home insurance rose to one of highest in US, July 11, 2026, https://coloradosun.com/2026/07/11/colorado-homeowners-insurance-expensive/
- Colorado State University Regional Economic Development Institute, Homeowners Insurance Trends in Colorado, https://csuredi.org/redi_reports/homeowners-insurance-trends-in-colorado-implications-of-natural-hazard-dynamics/
- Colorado Housing and Finance Authority, Colorado Statewide Apartment Survey (4th Quarter 2025), https://www.chfainfo.com/rental-housing/colorado-statewide-apartment-survey