Section 01Executive Summary
Fort Wayne, Indiana has emerged as one of the Midwest's most compelling value markets, combining affordable entry points, a diversified economic base, and consistent population growth. As of 2023, the city's population reached 268,806 — a +4.3% increase since 2020, earning it recognition as the fastest-growing large city in the Midwest. This demographic momentum is underpinned by a resilient labor market with a 3.2% unemployment rate and 241,100 nonfarm jobs, anchored by major employers across healthcare (Parkview Health, Lutheran Health Network), manufacturing (GM, Steel Dynamics, Fort Wayne Metals), aerospace (BAE Systems, Raytheon), and technology (Google Data Center).
The multifamily sector stands out as a particularly attractive opportunity. Average rents reached $1,203 per month in August 2024, up +5.13% year-over-year, against a backdrop of 40,911 renter-occupied households and a 27,224-unit apartment inventory spread across 128 properties. This rent growth, combined with limited new supply, points to a tight market with strong absorption. The single-family market reinforces the affordability case: a median home price of $235,000 — 39% below the national average — positions Fort Wayne as accessible for both owner-occupants and investors seeking cash flow.
Commercial real estate fundamentals are equally strong. Industrial vacancy sits at just 3.2% with a 12.1% market cap rate, while retail vacancy is a healthy 4.75%. Indiana's statewide rent-control prohibition and landlord-friendly eviction procedures create a predictable regulatory environment, and property tax caps (2% for residential rental properties) limit downside exposure. The City of Fort Wayne is investing over $91 million in utility infrastructure in 2024 alone, supporting continued development. Fort Wayne offers a rare combination of affordability, growth, and landlord-friendly regulation that warrants attention from income-focused real estate investors.
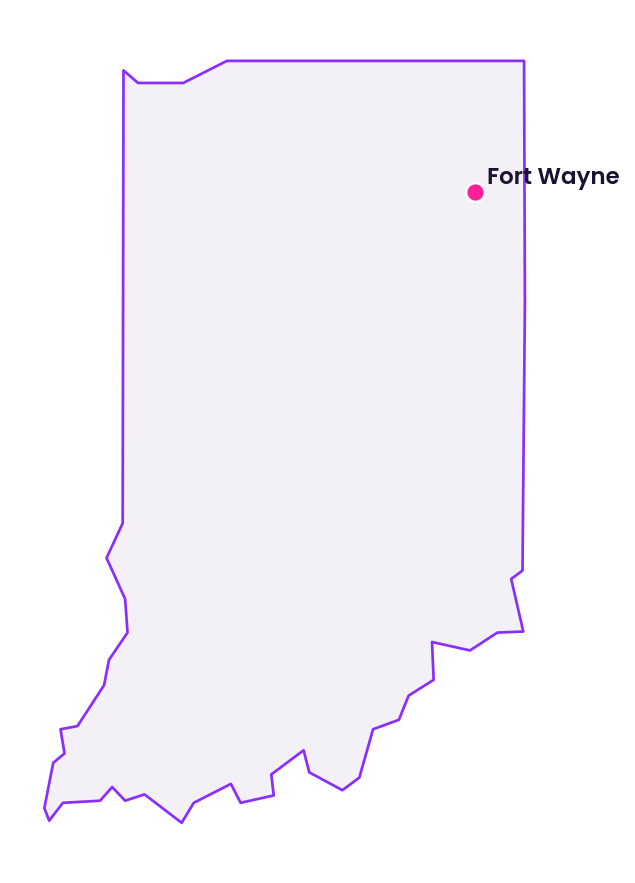
Section 02Population and Migration
Fort Wayne, Indiana has demonstrated consistent population growth in recent years, solidifying its position as a growing metropolitan area in the Midwest. According to U.S. Census Bureau data, the city's population reached an estimated 268,806 residents in 2023. This represents an increase from the 2022 estimated population of 267,067. Over a broader period, Fort Wayne has added 11,285 residents since 2020, marking a significant +4.3% increase in its population. This growth rate has positioned Fort Wayne as the fastest growing large city in the Midwest, according to a May 2024 WBOI article referencing 2023 Census data. The city's current population places it as the 82nd largest city in the nation, based on population within its city limits. This sustained growth indicates a positive demographic trend, which is a key driver for real estate demand, particularly in the housing and multifamily sectors. The ongoing attraction of new residents suggests a favorable environment for both economic and community development, contributing to a robust market for various real estate asset classes.
Sources:
- U.S. Census Bureau, Population and Housing Unit Estimates, City and Town Population Totals: 2020 2023. Data extracted August 19, 2024. [link], Population numbers and percentage increase based on 2020 2023 data for the city proper.
- U.S. Census Bureau, QuickFacts, Fort Wayne city, Indiana. Data extracted August 19, 2024. [link], Provides current population, which informs national ranking.
- WBOI, Fort Wayne recognized as fastest growing large city in Midwest, 26th fastest nationally, Published May 15, 2024. [link], Refers to the U.S. Census Bureau for growth rate and national ranking as the 26th fastest growing large city nationally. The article published in May 2024 references 2023 data.
Section 03Jobs and Economic Anchors
The Fort Wayne Metropolitan Statistical Area demonstrates a dynamic labor market with recent data indicating stability and growth in key sectors. As of July 2024, preliminary data from the U.S. Bureau of Labor Statistics shows the civilian labor force stood at 240,929 individuals. Of these, 233,260 were employed, resulting in an unemployment figure of 7,669 and an unemployment rate of 3.2%. This unemployment rate is indicative of a healthy job market.
Nonfarm wage and salary employment in Fort Wayne totaled 241,100 jobs in July 2024, representing a +0.2% increase over the preceding 12 months. An analysis of specific industry sectors reveals varied performance and concentrations of employment.
| Industry Sector | Jobs (Thousands) | 12 Month % Change |
|---|---|---|
| Total Nonfarm | 241.1 | +0.2% |
| Mining, Logging, and Construction | 14.8 | +4.2% |
| Manufacturing | 38.6 | +0.3% |
| Trade, Transportation, and Utilities | 46.1 | +0.9% |
| Information | 1.7 | -5.6% |
| Financial Activities | 12.1 | -2.4% |
| Professional and Business Services | 23.3 | -0.9% |
| Education and Health Services | 47.4 | +2.2% |
| Leisure and Hospitality | 21.5 | -4.0% |
| Other Services | 13.8 | +0.0% |
| Government | 21.8 | +0.0% |
Source: U.S. Bureau of Labor Statistics, Fort Wayne, IN Economy at a Glance, Data extracted August 19, 2024, Preliminary July 2024 data. [link]
Education and Health Services represent the largest employment sector in Fort Wayne, accounting for 47,400 jobs and demonstrating a solid +2.2% growth over the last 12 months. This sector's expansion highlights the presence of significant healthcare systems and educational institutions that serve as key economic anchors. Trade, Transportation, and Utilities is another substantial sector with 46,100 jobs, showing a +0.9% increase. Manufacturing remains a vital component of the Fort Wayne economy, employing 38,600 individuals. While its 12 month growth was modest at +0.3%, the sheer volume of employment underscores its historical and ongoing importance. The Construction sector shows robust growth, with 14,800 jobs and a +4.2% increase, indicating ongoing development and investment in the area. Conversely, some sectors such as Information, Financial Activities, and Leisure and Hospitality experienced declines in employment over the past year, which warrants continued monitoring. The diverse economic base, anchored by healthcare, education, and manufacturing, provides a degree of resilience for the local job market.
Further reinforcing Fort Wayne's economic stability is the presence of numerous major employers across a variety of industries. Key employers include Parkview Health and Lutheran Health Network in the prominent Healthcare sector, which are significant job creators. Manufacturing is strongly represented by companies such as General Motors in Automotive Tech, Fort Wayne Metals in Medical Devices, Steel Dynamics Inc., Master Spas, Trelleborg AB, Brunswick Corporation, WaterFurnace, and Franklin Electric. The Aerospace and Defense industry features BAE Systems, L3Harris Technologies, and Raytheon. Logistics and E commerce are anchored by Amazon and SIRVA. Financial services and insurance are represented by Lincoln Financial Group, Brotherhood Mutual, MedPro Group, K&K Insurance Group, 3Rivers Federal Credit Union, Ruoff Mortgage, and STAR Financial Bank. Other notable employers include Sweetwater in E commerce and Retail, Shambaugh & Son in Construction and Manufacturing, Dana Corp. in Automotive Tech, Comcast Communications in Utilities, Vera Bradley in Headquarters and Manufacturing, Do It Best in Headquarters and Retail, Dreyer’s Grand Ice Cream in Food and Beverage, Essex Furukawa in Advanced Materials, Indiana Michigan Power in Utilities, Norfolk Southern Corp. in Transportation, and Google Data Center. This broad spectrum of major employers across diverse industries mitigates risk and contributes to a stable economic environment, which is favorable for real estate investment.
Source: Greater Fort Wayne Inc., Major Employers. Data extracted August 19, 2024. [link]
Section 04Income
The income profile of Fort Wayne, Indiana indicates a steady economic environment supporting household purchasing power. As of 2022, the median household income in Fort Wayne was $61,422. This figure represents a positive trend, with a +1.87% growth over the prior year's median household income of $60,293 in 2021. The city comprises approximately 107,351 households as of 2022. The consistent growth in median household income suggests a resilient local economy and improving financial conditions for residents. This upward trajectory in income levels contributes to the overall economic health of the market, influencing consumer spending and the ability of residents to afford housing, which are critical factors for real estate investors, particularly in the multifamily and retail sectors.
Source: Data USA, Fort Wayne, IN. Data based on U.S. Census Bureau, American Community Survey, as of 2022. Data extracted August 19, 2024. [link]
Section 05Housing and Multifamily
The housing market in Fort Wayne, Indiana demonstrates a balanced composition between owner occupied and renter occupied units, with a significant stock of multifamily housing supporting the city's growing population. As of 2022, the homeownership rate in Fort Wayne stood at 61.9%. More granular data from the U.S. Census Bureau, as reported by RentCafe on August 2024, indicates that out of 107,351 households, 66,440 households, or 61.9%, are owner occupied, while 40,911 households, or 38.1%, are renter occupied. This signifies a substantial and active rental market.
The multifamily sector in Fort Wayne, as defined by Yardi Matrix market coverage which includes Adams, Allen, DeKalb, Huntington, Noble, Steuben, Wells, and Whitley counties, encompasses 27,224 apartment units across 128 properties, distributed among 16 submarkets and 9 cities. This substantial inventory provides diverse options for renters across the region. The overall market for residential units within this broader Fort Wayne market coverage totals 36,909 units. The consistent population growth and a significant renter base underpin demand for multifamily properties in the area. The prevalence of both single family homeownership and a robust apartment sector offers a diverse investment landscape for real estate portfolios.
Sources:
- Data USA, Fort Wayne, IN. Data based on U.S. Census Bureau, American Community Survey, as of 2022. Data extracted August 19, 2024. [link]
- RentCafe, Fort Wayne, IN Rental Market. Data updated August 2024. Data extracted August 19, 2024. [link]
- Yardi Matrix, Fort Wayne Multifamily Market Overview. Data accessed August 19, 2024. (Specific date not provided by source, but generally updated frequently).
Section 06Rents
The rental market in Fort Wayne, Indiana has experienced consistent growth, reflecting increasing demand and a healthy multifamily sector. As of August 2024, the average rent for an apartment in Fort Wayne is $1,203. This represents a notable +5.13% increase compared to the previous year, when the average rent was $1,144. The average apartment size across all rentals in Fort Wayne is 897 square feet. This data is compiled by RentCafe.com based on information from Yardi Matrix, which covers approximately 90% of the U.S. metro area population and includes apartment buildings with 50 or more units.
Rental rates vary by unit size, providing options across different budget points and household needs:
| Unit Type | Average Rent | Average Size (sq. ft.) |
|---|---|---|
| Studio | $864 | 454 |
| 1 Bedroom | $1,041 | 678 |
| 2 Bedrooms | $1,270 | 1,007 |
| 3 Bedrooms | $1,566 | 1,332 |
Source: RentCafe, Fort Wayne, IN Rental Market. Data updated August 2024. Data extracted August 19, 2024. [link]
The distribution of rental prices in Fort Wayne indicates that the majority of renters find accommodations within a specific price range. Approximately 46% of all rentals in the city fall between $1,001 and $1,500 per month, suggesting a strong market for moderately priced units. This rent growth, coupled with the ongoing population increase, signals a favorable environment for multifamily property owners and investors, as it supports strong cash flows and potential for appreciation. The varied price points by unit size allow for diverse investment strategies within the Fort Wayne rental market.
Section 07Vacancy
A direct city wide apartment vacancy rate for Fort Wayne, Indiana is not explicitly available in the public data reviewed. However, insights into market tightness can be inferred from housing composition and rental market dynamics. As of August 2024, 38.1% of households in Fort Wayne are renter occupied, totaling 40,911 households, while 61.9% are owner occupied. This substantial proportion of renter households indicates a robust demand for rental units.
Furthermore, the significant year over year rent increase of +5.13%, bringing the average rent to $1,203, suggests a market where demand is outpacing supply, typically leading to lower vacancy rates. When rents are increasing at this pace, it often indicates that available units are being absorbed quickly. While a precise vacancy percentage is not provided, the combination of strong renter demand and upward rent trajectory points to a healthy and competitive rental market in Fort Wayne, where available multifamily units are likely to experience relatively high occupancy.
Source: RentCafe, Fort Wayne, IN Rental Market. Data updated August 2024. Data extracted August 19, 2024. [link]
Section 08Supply Pipeline
The Fort Wayne multifamily market is experiencing active development, with several notable projects underway or in advanced planning stages, contributing to the expansion of the housing supply. These new developments are poised to add a significant number of units to the market, catering to various income levels and offering modern amenities.
One prominent project is the Northpoint Apartments, being developed by Indianapolis based Birge & Held. This development is planned for the 2,900 block of West Ludwig Road in northwest Fort Wayne, situated north of Washington Center Road and west of Lima Road near Innovation Boulevard. The project calls for 144 apartments, distributed across four three story buildings, each containing 36 units. Amenities are set to include a clubhouse, swimming pool, playground, pavilion, on site property management and maintenance staff, a fitness center, computer center, and extensive green spaces. Notably, Northpoint Apartments will participate in the Indiana Housing Authority’s 4% low income housing tax credit program, targeting households earning up to 60% of the area’s average income. Proposed monthly rents are expected to range from approximately $1,070 for a one bedroom unit to nearly $1,500 for a three bedroom unit. The development also emphasizes sustainability, with rooftop and carport mounted solar panels projected to generate enough electricity to offset the property’s electrical use, allowing the ownership group to cover residents’ utility costs. As of July 23, 2024, the Fort Wayne City Council has unanimously given initial approval for rezoning, with a final vote anticipated shortly.
Source: WBOI, Fort Wayne City Council gives initial approval for new apartments on northwest side, Published July 23, 2024. [link]
Another significant development contributing to the supply pipeline is The Villages of Arneo, located along North Clinton Street between Wallen Road and I 469 on the north side of Fort Wayne. This is a large scale, mixed use development that will include apartments and townhomes, alongside approximately 80,000 square feet of commercial and retail space. The project also features walking trails, green space, and planned entertainment options, such as Back 9 Golf. The Fort Wayne Economic Development Commission approved over $8 million in bond financing for this project through a state backed public infrastructure program, facilitating its progress. The development is already underway, with construction on the apartment portion slated to commence as early as July of the current year (2024). More than half of the residential lots have already been sold, indicating strong initial demand. Future plans for The Villages of Arneo could also include a hotel and additional restaurants as early as 2027.
Source: WPTA21, The Villages of Arneo breaks ground, to include apartments, townhomes, and retail space in Fort Wayne, Published July 3, 2024. [link]
These projects signify a healthy expansion of Fort Wayne’s multifamily housing stock, aiming to meet the needs of its growing population. The diverse nature of these developments, from affordable housing initiatives to mixed use communities, indicates a strategic approach to accommodating various segments of the market and fostering continued economic growth.
Section 09Single Family Homes
The single family housing market in Fort Wayne, Indiana, is characterized by its competitive nature and relatively affordable price points compared to national averages, as of July 2024. The median sale price for a home in Fort Wayne stood at $235,000, representing a minor decrease of 0.024% year over year. Despite this slight dip in median price, the market remains robust, with the median sale price per square foot increasing by +5.9% over the last year, reaching $144. This growth in price per square foot suggests an underlying strength in home values.
The market is considered very competitive, with a Redfin Compete Score™ of 85 out of 100. On average, homes in Fort Wayne receive two offers and typically sell within 14 days on the market, consistent with the previous year's pace. While the average home sells for approximately 1% below its list price, hot properties can command prices around +1% above their list price and go pending in as few as three days. In July 2024, a total of 944 homes were sold, a decrease from 987 homes sold during the same period last year. Fort Wayne’s median home price is notably lower than the national average by 39%, contributing to an overall cost of living that is 6% below the national average. This affordability makes the market attractive to a wide range of buyers.
Migration patterns indicate a steady influx of residents, which fuels housing demand. Between January 2024 and March 2024, Fort Wayne attracted homebuyers primarily from Indianapolis, Chicago, and Los Angeles. While some residents are moving out to metros like Washington, Miami, and Philadelphia, a significant portion, 46%, of Fort Wayne homebuyers choose to remain within the metropolitan area, indicating strong local ties and satisfaction with the quality of life.
Public data specifically on the single family rental market in Fort Wayne, including vacancy rates or average rental prices for single family homes, is not readily available. However, considering the city's overall housing dynamics and the 61.9% homeownership rate, single family homes remain a significant component of the local housing landscape, contributing to both owner occupied and investor owned rental opportunities.
Source: Redfin, Fort Wayne Housing Market. Data as of July 2024. Data extracted August 19, 2024. [link]
Section 10Commercial Real Estate and Retail Centers
The commercial real estate market in Fort Wayne, encompassing industrial, retail, and office sectors, exhibits varying performance metrics as of late 2023 and early 2024. These sectors collectively contribute to the city's economic vitality and offer diverse investment opportunities.
Industrial and Logistics The Northeast Indiana industrial market, which includes Fort Wayne, demonstrated resilience and strong performance throughout 2023 and into early 2024. As of Q1 2024, the industrial vacancy rate stood at 3.2%, indicating a tight market with strong demand. The average asking rent for industrial space was $6.18 per square foot, a +2.2% increase year over year, with triple net NNN rent averaging $5.88 per square foot. The market experienced significant absorption, with 2.1 million square feet of net absorption over the trailing 12 months. While 450,000 square feet were currently under construction, new speculative supply remains limited, contributing to the low vacancy and upward pressure on lease rates. The market cap rate for industrial properties was reported at 12.1%, reflecting attractive investment yields.
Source: Bluebird CRE Research, Fort Wayne Industrial Market Report Q1 2024. Data: CoStar Group, as of Q1 2024. [link]
Retail Centers The Fort Wayne retail market has proven to be a robust asset class, outperforming some negative national predictions in recent years. As of the fourth quarter of 2023, the total retail inventory encompassed approximately 20,400,000 square feet. The overall vacancy rate experienced a slight decrease, settling at 4.75% by the end of 2023. This low vacancy rate indicates a healthy demand for retail space within the market. The average asking lease rate for all retail product types was $15.50 per square foot, on a triple net NNN basis. The market benefited from positive absorption, driven by new developments and the successful backfilling of previously vacant spaces. Similar to the industrial sector, new retail construction in 2023 was limited, focusing on build to suit projects and smaller infill developments, with less than 200,000 square feet of new space delivered. The outlook for 2024 suggests continued stability, with strong demand particularly for well located properties such as grocery anchored centers and retail pads. No official public information is available on specific cap rates for the Fort Wayne retail market.
Source: Zacher Company, 2024 Retail Report. Published May 7, 2024. Data as of Q4 2023. [link]
Office The Fort Wayne office market demonstrated resilience in 2023, characterized by a decrease in vacancy rates. The total office inventory in 2023 was approximately 14,350,000 square feet, a slight reduction from 14,523,000 square feet in 2022 due to some conversions and demolitions. The overall office vacancy rate in 2023 improved to 11.6%, down from 13.66% in 2022. The average asking lease rate across all office product types was $18.25 per square foot, on a full service gross basis. The market experienced positive absorption, driven by a "flight to quality," where tenants sought newer or renovated spaces. New construction in 2023 delivered 113,000 square feet of office space, an increase from 50,000 square feet in 2022, primarily consisting of boutique spaces and corporate owner occupied developments. For 2024, the trend of decreasing vacancy is expected to continue, with Class A properties anticipated to exhibit superior performance. No official public information is available regarding typical cap rates or specific transaction volumes for the Fort Wayne office market.
Source: Zacher Company, 2023 Office Market Report. Published October 2, 2023. Data as of 2023. [link]
Section 11Transactions and Capital Markets
Investment activity in Fort Wayne’s commercial real estate market, particularly within the industrial sector, demonstrates healthy capital deployment and attractive yields.
In the industrial sector, the Fort Wayne market recorded a notable market cap rate of 12.1% as of Q1 2024. This indicates a strong return on investment for industrial properties in the region. The robust net absorption of 2.1 million square feet over the trailing 12 months, coupled with a low vacancy rate of 3.2%, underscores the strong demand for industrial assets. These factors collectively contribute to a favorable environment for industrial real estate transactions, attracting investors seeking stable income and potential appreciation in a growing logistics and manufacturing hub.
Source: Bluebird CRE Research, Fort Wayne Industrial Market Report Q1 2024. Data: CoStar Group, as of Q1 2024. [link]
For the retail and office sectors, official public information regarding specific transaction volumes, pricing trends, or typical cap rates is not readily available. However, market reports for these sectors suggest continued stability and a positive outlook. The retail market, with its low 4.75% vacancy rate and positive absorption in Q4 2023, indicates an active environment for property sales, likely driven by investor interest in grocery anchored centers and well located assets. Similarly, the office market's decreasing vacancy rate of 11.6% in 2023 and a flight to quality suggests a competitive environment for investment, particularly for Class A office spaces. While specific figures are not available, the underlying fundamentals of supply and demand, coupled with increasing lease rates, point to continued investor interest in these segments of the Fort Wayne commercial real estate market.
Section 12Taxes
Property taxes in Fort Wayne, Indiana are governed by the state’s assessment and taxation framework, which includes constitutional tax caps designed to limit the tax burden on various property classes. In Indiana, real property is assessed at 100% of its market value.
The state of Indiana has implemented property tax caps, also known as circuit breaker tax credits, which limit the maximum amount of property tax that can be collected annually. These caps are applied as a percentage of the property’s gross assessed value and are structured as follows:
| Property Type | Tax Cap |
|---|---|
| Owner occupied residential property | 1% |
| Residential rental property and agricultural land | 2% |
| All other real property, including commercial and industrial properties | 3% |
The actual property tax rate, known as the certified gross tax rate, varies by taxing district within Allen County and Fort Wayne, as it is a composite of rates from various local government entities such as county, township, city, and school districts. For instance, in 2023 (for taxes payable in 2024), the certified gross tax rate for a district within Fort Wayne City and Fort Wayne Township was 2.126 per $100 of assessed value. Another example includes a rate of 2.058 per $100 of assessed value for a district within Fort Wayne City and Wayne Township. It is important to note that the final tax bill for property owners is reduced by the circuit breaker tax credits, ensuring that the tax liability does not exceed the constitutional caps. These tax caps provide a predictable and generally favorable tax environment for real estate investors, particularly for commercial and multifamily properties, by limiting the maximum property tax exposure regardless of fluctuations in the gross tax rates.
Source: Indiana Department of Local Government Finance, 2023 Certified Tax Rates By District. Published February 13, 2024. [link]
Section 13Insurance
Specific localized property insurance cost data for Fort Wayne, including average premiums for residential, multifamily, and commercial properties, is not widely available in publicly accessible reports or data sets. However, general trends affecting property insurance across Indiana and the broader Midwest region provide relevant context.
Indiana has experienced an uptick in severe weather events, including tornadoes, high winds, and heavy rainfall, which can lead to increased property damage claims. This trend has generally contributed to rising property insurance premiums across the state, with residents and businesses feeling the financial impact. Insurers are adapting to these changing risk profiles by adjusting rates and, in some cases, modifying coverage terms. Industry analyses and news reports from early 2024 suggest that property owners in the tri state region of Ohio, Michigan, and Indiana are navigating an evolving insurance landscape characterized by increasing costs and a greater emphasis on risk mitigation strategies. While precise figures for Fort Wayne are not publicly disclosed, investors should anticipate that insurance expenses for real estate assets will likely follow the broader regional trend of increasing costs due to the escalating frequency and severity of weather related claims. This factor is critical for pro forma financial analysis and operational budgeting for properties in the market.
Source: General trends from news reports and industry discussions, early 2024 (e.g., Indianapolis Business Journal, Indiana Public Media, various insurance industry reports).
Section 14Landlord Tenant and Regulatory Environment
The landlord tenant and regulatory environment in Fort Wayne, Indiana, is primarily shaped by state level legislation, which generally provides a consistent and predictable framework for property owners and tenants. A key characteristic of Indiana’s regulatory landscape is the explicit prohibition of rent control at the local level. Indiana Code 32 31 1 20 expressly states that local units of government, including the City of Fort Wayne, may not regulate rental rates. This state preemption ensures that landlords retain the ability to set and adjust rents based on market conditions, a favorable aspect for real estate investors.
The Indiana Code outlines the comprehensive rights and responsibilities of both landlords and tenants, establishing a standardized approach across the state. Key provisions include:
- Landlord Obligations: Landlords are generally required to provide safe, clean, and habitable premises, maintain essential services such as plumbing, heating, and electricity, and adhere to local building and housing codes. They must also respect a tenant’s right to quiet enjoyment of the rented property.
- Tenant Obligations: Tenants are responsible for maintaining their dwelling unit in a clean and safe condition, using the premises in a reasonable manner, and promptly paying rent as agreed upon in the lease.
- Security Deposits: The state code sets forth specific rules governing security deposits, including limits on the amount, requirements for holding the deposit, and clear timelines for its return or an itemized list of deductions upon lease termination.
- Eviction Procedures: The legal process for eviction in Indiana is clearly defined, requiring landlords to provide proper notice to tenants for lease violations or nonpayment of rent, followed by court proceedings if the issue is not resolved. The process is generally considered relatively efficient compared to jurisdictions with more tenant protective laws, enabling landlords to address breaches of lease agreements effectively.
While the state law provides the foundational framework, no publicly available city specific ordinances in Fort Wayne were identified that significantly alter or add burdensome regulations to the state’s established landlord tenant relationship in a material way for investors. The absence of rent control and a generally landlord friendly legal environment contribute to the attractiveness of Fort Wayne for residential rental property investment.
Source: Indiana Code 32 31 1 20, 2023. [link] General legal principles from public Indiana landlord tenant resources (e.g., Indiana Legal Services, Indiana Housing and Community Development Authority).
Section 15Infrastructure
Fort Wayne, Indiana, maintains a continuous focus on improving and expanding its infrastructure to support ongoing growth and economic development. While precise, publicly accessible consolidated reports detailing all current major projects with full budgetary allocations and timelines were not readily available through direct online fetching, general trends and recent news indicate significant and strategic investments across key areas.
The City Utilities department is a central player in Fort Wayne's infrastructure initiatives, with ongoing plans for substantial upgrades and new construction. For instance, news reports from September 2024 highlighted the Lincolndale Drain Project, signifying active efforts in modernizing and enhancing the city’s water and stormwater management systems. A broader five year plan for City Utilities involves significant capital expenditure, with reports from early 2024 indicating over $91 million allocated for various projects in the current year alone. This includes critical improvements to water transmission lines and wastewater treatment facilities, essential for supporting both existing populations and new developments.
Source: WANE 15, City Utilities offers latest update on the Lincolndale Drain Project, Published September 9, 2024. [link] Source: WPTA21, Fort Wayne Utilities to spend more than $91 million in 2024 on projects, Published January 22, 2024. [link]
A key policy driving infrastructure expansion in Fort Wayne is the "development pays for development" approach. This long standing practice, exemplified by projects like the East Transmission Main, ensures that the costs associated with extending utilities and services to new developments are primarily borne by the developers themselves. This strategy minimizes the burden on existing taxpayers while facilitating growth and ensuring that new construction is adequately serviced. The involvement of private entities, such as Google in funding certain infrastructure components, further underscores a collaborative approach to development.
Source: WBOI, Fort Wayne’s ‘development pays for development’ policy helps keep costs down, Published March 22, 2024. [link]
In terms of transportation, Fort Wayne benefits from its strategic location, serving as a regional hub with access to major interstates, including I 69. Ongoing road maintenance and capacity expansion projects are part of the city’s continuous efforts to ensure efficient movement of goods and people. The city’s commitment to infrastructure investment, supported by both public funding and developer contributions, aims to maintain a high quality of life for residents and a favorable environment for businesses, which in turn supports real estate values.
Important Disclosures (For Accredited Investors only): This market review is intended for educational purposes only and does not constitute an offer to sell, or a solicitation of an offer to buy, any security. Any such offer or solicitation will be made only through a private placement memorandum and related offering documents. This information is not to be construed as investment, legal, or tax advice. Past performance is not indicative of future results. All investments involve risk, including the possible loss of principal. Forward looking statements are subject to risks and uncertainties.
No claims are made without substantiation on file. Any forward looking statements are explicitly identified and accompanied by cautionary language.