In brief · summary: Houston
Houston enters the second half of 2026 as one of the largest and fastest growing metropolitan economies in the United States, and its real estate markets are in the early stages of a supply led normalization. The metropolitan area, officially the Houston, Pasadena, The Woodlands statistical area, added roughly 1.2 million residents over the last decade according to the Greater Houston Partnership Economy at a Glance published in April 2026, and it recorded the largest numeric population gain of any United States metropolitan area in the estimates the Census Bureau released in March 2026, as reported by the Houston Chronicle and CultureMap.
That demographic engine is the single most important fact for a real estate investor, because it continuously refills demand for apartments, single family homes, warehouses, and neighborhood retail even when national conditions soften. The apartment market is the clearest example of the current turn.
After a multi year wave of new supply pushed vacancy up and held rents flat, deliveries are now receding while renter demand is accelerating. Northmarq reported that Houston multifamily vacancy fell 40 basis points during the second quarter of 2026, to 7.1 percent, the largest single quarter improvement in nearly five years, on net absorption of more than 6,500 units, up more than 60 …
Section 01Executive Summary
Houston enters the second half of 2026 as one of the largest and fastest growing metropolitan economies in the United States, and its real estate markets are in the early stages of a supply led normalization. The metropolitan area, officially the Houston, Pasadena, The Woodlands statistical area, added roughly 1.2 million residents over the last decade according to the Greater Houston Partnership Economy at a Glance published in April 2026, and it recorded the largest numeric population gain of any United States metropolitan area in the estimates the Census Bureau released in March 2026, as reported by the Houston Chronicle and CultureMap. That demographic engine is the single most important fact for a real estate investor, because it continuously refills demand for apartments, single family homes, warehouses, and neighborhood retail even when national conditions soften.
The apartment market is the clearest example of the current turn. After a multi year wave of new supply pushed vacancy up and held rents flat, deliveries are now receding while renter demand is accelerating. Northmarq reported that Houston multifamily vacancy fell 40 basis points during the second quarter of 2026, to 7.1 percent, the largest single quarter improvement in nearly five years, on net absorption of more than 6,500 units, up more than 60 percent from the same period a year earlier. Rents, however, remain essentially flat and only slightly above year ago levels, so this is a recovery in occupancy and absorption first, and in pricing power later. Single family home prices are mixed, with the Redfin measure for the city of Houston up modestly and the Zillow and Realtor.com measures showing softer or declining values, a divergence that reflects a buyer friendly market with rising days on market. Commercial performance is bifurcated: industrial and logistics remain strong, office is slowly healing but still carries availability above 26 percent, and retail fundamentals are tight even as quarterly absorption turned slightly negative.
The offsetting risks are concrete and local. Property taxes are high because Texas has no personal income tax, homeowners and commercial insurance costs have risen sharply after repeated severe weather, and the region carries genuine hurricane and flood exposure that FEMA is actively remapping in 2026. The investment case for Houston rests on affordability, job and population growth, and a light forward supply pipeline, weighed against carrying costs and physical risk that must be underwritten explicitly rather than assumed away.
Section 02Population and Migration
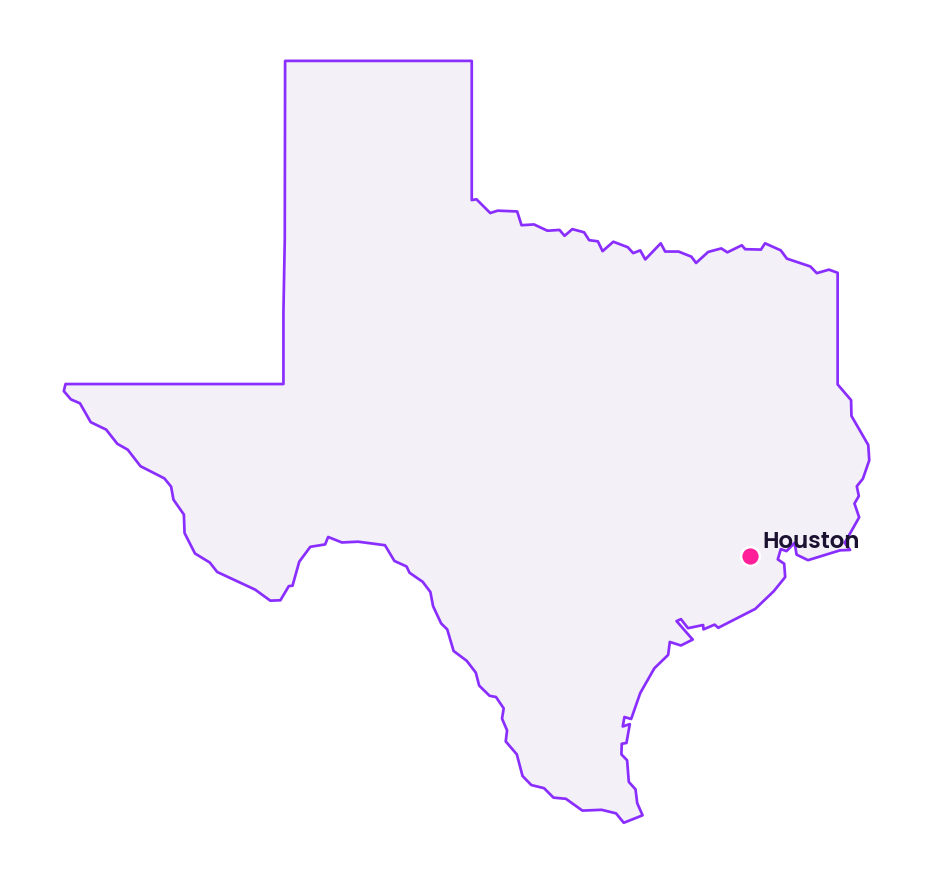
Population growth is Houston's defining advantage. The Greater Houston Partnership Economy at a Glance for April 2026 placed the metropolitan population at roughly 7.9 million and reported that the region added about 1.2 million residents over the prior decade. A separate demographic dataset from Oxford Economics, published inside the Matthews retail market report for the second quarter of 2026, put the current metropolitan population at 7,996,188 and the number of households at 2,858,087. These two figures are close and mutually reinforcing, and the small differences reflect different vintages and estimation methods rather than a real disagreement. Harris County, the urban core county, had a population of roughly 4.84 million in 2024 according to Census Bureau estimates as compiled by Data USA.
The composition of that growth matters for real estate. Census Bureau estimates released in March 2026, as reported by the Houston Chronicle and CultureMap, showed Houston leading the nation in numeric population gain, with the strongest increases occurring in the suburban ring rather than the urban core. Coverage of the same release by KWTX, citing the Census Bureau, noted that Waller County, on Houston's northwest edge, was the second fastest growing county in the entire United States on a percentage basis. This suburban tilt is a direct signal for where household formation, and therefore rental and for sale housing demand, is concentrating: the FM 1960 corridor, Katy and Cypress to the west, Conroe and The Woodlands to the north, and Pearland and the southeast. Reporting by the Houston Chronicle and the Kinder Institute at Rice University also flagged that slower international migration in 2025 tempered the pace of gains, which is a variable worth watching because Houston has historically drawn heavily on immigration.
| Geography | Population | Scope and source |
|---|---|---|
| Houston metropolitan area | ~7,996,188 | Current, Oxford Economics via Matthews Q2 2026 |
| Houston metropolitan area | ~7.9 million | 2026, Greater Houston Partnership, April 2026 |
| Harris County | ~4.84 million | 2024, Census Bureau via Data USA |
| Metro decade change | +1.2 million | 10 years to 2026, Greater Houston Partnership |
The conclusion for an investor is that Houston is adding population at a scale few markets can match, that the growth is disproportionately suburban, and that the one caution is the sensitivity of the total to immigration policy.
Section 03Jobs and Economic Anchors
Employment continues to expand, though at a moderate pace and with a rising unemployment rate. The Bureau of Labor Statistics Economy at a Glance for the Houston metropolitan area, updated August 3, 2026, reported total nonfarm employment of about 3,497,700 in July 2026 on a preliminary basis, up 1.5 percent from a year earlier. The same source showed the not seasonally adjusted unemployment rate at 5.2 percent in June 2026, up from 4.3 percent in April, a seasonal and cyclical uptick that bears watching. Construction employment stood at roughly 267,300 in July 2026, up 5.2 percent year over year, a notable strength that also foreshadows continued building activity. Mining and logging, the category that best proxies the energy extraction sector, was about 73,400 and down 0.8 percent year over year, confirming that energy is no longer the growth driver it once was even though it remains a high wage anchor.
| Indicator, Houston metro | Value | Change | Scope and source |
|---|---|---|---|
| Total nonfarm employment | 3,497,700 | +1.5% | July 2026 preliminary, BLS |
| Unemployment rate | 5.2% | +0.9 pts vs April | June 2026 not seasonally adjusted, BLS |
| Construction employment | 267,300 | +5.2% | July 2026 preliminary, BLS |
| Mining and logging | 73,400 | -0.8% | July 2026 preliminary, BLS |
The economic anchors behind these numbers are diversified in a way they were not a generation ago. Energy remains central, but the Texas Medical Center, described by its own institutions as the largest medical complex in the world, anchors a vast healthcare and life sciences employment base, while the Port of Houston, logistics along the interstate corridors, advanced manufacturing, and professional services broaden the base further. The Matthews retail report for the second quarter of 2026, drawing on Oxford Economics, cited a metropolitan unemployment rate of 4.6 percent for its demographic snapshot, close to the BLS reading and consistent with a still healthy labor market. For real estate, the takeaway is that job growth is positive and broad based, which supports rent paying capacity across property types, but the rising unemployment rate is a reminder that underwriting should not assume acceleration from here.
Section 04Income
Household income in Houston is moderate by national standards, which is central to both the affordability advantage and the ceiling on rent growth. The Census Bureau American Community Survey estimate for Harris County, as published through the Federal Reserve Bank of St. Louis, placed median household income at $74,682 in 2024. The broader metropolitan figure runs higher because it includes wealthier suburban counties: the Oxford Economics data in the Matthews second quarter 2026 report put metropolitan median household income at $83,624.
| Geography | Median household income | Scope and source |
|---|---|---|
| Harris County | $74,682 | 2024 ACS, Census Bureau via FRED |
| Houston metropolitan area | $83,624 | 2026, Oxford Economics via Matthews |
The investment implication is twofold. On one hand, moderate incomes combined with home prices below the national average keep Houston relatively affordable, which sustains in migration and a deep renter pool. On the other hand, moderate incomes cap how quickly landlords can push rents before hitting affordability limits, which is part of why the current apartment recovery is showing up in occupancy before it shows up in rent. Investors should also note that rising property taxes and insurance costs, discussed below, erode the real disposable income of Houston households and therefore their capacity to absorb rent increases.
Section 05Housing and Multifamily
The apartment market is the sector where the supply cycle is most visible and where the near term opportunity is clearest. Yardi Matrix, in its Houston report dated July 15, 2026, reported that advertised asking rents inched up 0.1 percent on a trailing three month basis through May 2026 to $1,359, the first such gain since May 2025, while still sitting 1.2 percent below the year earlier level, and it recorded occupancy of 91.6 percent in April 2026, down 110 basis points year over year. Northmarq, in its market insights published August 19, 2026, described a more decisive turn in the second quarter: vacancy fell 40 basis points to 7.1 percent, the largest quarterly improvement in nearly five years, driven by net absorption of more than 6,500 units, up more than 60 percent year over year, while rents were mostly flat. MMG Real Estate Advisors, tracking a somewhat different property set, reported an average rent of $1,307 and occupancy of 88.7 percent for the second quarter of 2026 with trailing four quarter net absorption of 9,307 units.
| Series and scope | Level or reading | Change | Period and source |
|---|---|---|---|
| Yardi advertised asking rent, metro | $1,359 | +0.1% trailing 3 mo, -1.2% YoY | Through May 2026, Yardi Matrix |
| MMG average rent, metro sample | $1,307 | not stated | Q2 2026, MMG |
| Yardi occupancy, metro | 91.6% | -110 bps YoY | April 2026, Yardi Matrix |
| MMG occupancy, metro sample | 88.7% | not stated | Q2 2026, MMG |
| Northmarq vacancy, metro | 7.1% | -40 bps in quarter, largest in ~5 years | Q2 2026, Northmarq |
The spread between these readings, for example an occupancy of 91.6 percent from Yardi versus 88.7 percent from MMG, is a function of different property samples and definitions rather than a contradiction, and a careful investor treats the direction, which is consistently improving, as more reliable than any single level. The core story is that demand has re accelerated while the flood of new supply is draining away, and that this sequence historically restores landlord pricing power with a lag of several quarters. Houston's long run vacancy average is approximately 6 percent according to Northmarq, so current vacancy in the seven to eleven percent range across sources still sits above normal, which is precisely why rent growth remains muted even as occupancy firms.
Section 06Rents
Houston rents are among the most affordable of any major United States metropolitan area, and that affordability is both the market's ballast and its constraint. At roughly $1,359 in the Yardi advertised series through May 2026, the average Houston asking rent is well below the national advertised average, which supports steady demand from households priced out of coastal markets. The trajectory has flattened out at a low level rather than climbing: Yardi's 0.1 percent trailing three month gain marked a first move up after a year of declines, and Northmarq characterized second quarter rents as mostly flat and only slightly higher than a year earlier.
The submarket pattern within the metro is the actionable detail. Rent softness has been concentrated in the neighborhoods that absorbed the most new construction, while supply constrained pockets have held up better. As deliveries fall through 2026 and into 2027, the supply heavy submarkets should see the fastest swing from concessions toward renewals with positive trade outs, which is the classic late cycle recovery pattern. For an investor, the practical read is that Houston is not a market to underwrite for outsized near term rent spikes, but rather one where flat to low single digit rent growth, high absorption, and a light forward pipeline can combine to drive net operating income through occupancy gains and the burning off of concessions.
Section 07Vacancy
Vacancy is the metric that best captures where Houston sits in its cycle. The apartment vacancy rate, whether the 7.1 percent reported by Northmarq for the second quarter of 2026, the roughly 8.4 percent implied by Yardi's 91.6 percent occupancy in April 2026, or the higher figure implied by the MMG sample, remains above Houston's long run average of about 6 percent cited by Northmarq, but it is now falling rather than rising. The 40 basis point second quarter decline reported by Northmarq is meaningful because it is the largest improvement in nearly five years and because it was demand driven rather than the result of withheld supply.
Commercial vacancy tells a more divided story that is covered in detail in the commercial section: office availability remains elevated near 26.6 percent according to Savills for the second quarter of 2026, industrial vacancy remains moderate against very strong absorption, and retail vacancy is low and tight. The unifying theme across property types is that Houston's vacancy is improving or stable everywhere except office, and that the office overhang is concentrated in older, commodity quality buildings rather than in the newest towers.
Section 08Supply Pipeline
The forward supply picture is the most bullish single element of the Houston multifamily thesis. After deliveries peaked in the 2023 to 2024 window, the pipeline is thinning rapidly. Northmarq reported that much of 2026's anticipated supply had already delivered by midyear and forecast that only about 5,600 units would be completed in 2027, which would be the lowest annual total in nearly fifteen years, with light multifamily permitting suggesting that subdued completions could extend into 2028. That is a structurally favorable setup: demand from a growing population meeting a shrinking flow of new competition is the condition under which occupancy tightens and rents eventually rise.
The same dynamic is visible in commercial construction, though with more nuance. The Matthews retail report for the second quarter of 2026 noted a sizable retail construction pipeline reflecting developer confidence in suburban demographic growth, which means retail investors should watch for localized new supply in fast growing suburbs even as the metro wide vacancy stays low. Construction employment up 5.2 percent year over year in July 2026, per BLS, confirms that building activity overall remains robust, so the supply relief is specific to multifamily and does not extend uniformly to every sector.
Section 09Single Family Homes
The single family market has shifted decisively toward buyers, with prices mixed depending on the geography and index used. Redfin reported that the median sale price for the city of Houston was $357,805 in June 2026, up 2.2 percent year over year, with homes selling in a median of 42 days compared with 36 days a year earlier, and 5,691 homes sold in the month, down slightly from 5,763 a year earlier. Redfin's median price per square foot was $181, up 1.1 percent, and its competition score of 49 placed the market in somewhat competitive territory with homes typically selling around 3 percent below list price. Realtor.com, measuring list prices for June 2026, reported a median list price of about $362,000, down 3.4 percent year over year, with days on market up 8.8 percent to 50 days. Zillow's typical home value measure for the Houston area was about $265,062, a lower figure that reflects a different and broader geographic definition and a different methodology.
| Metric and scope | Value | Change | Period and source |
|---|---|---|---|
| Median sale price, city of Houston | $357,805 | +2.2% YoY | June 2026, Redfin |
| Median price per square foot, city | $181 | +1.1% YoY | June 2026, Redfin |
| Days on market, city | 42 days | +6 days YoY | June 2026, Redfin |
| Median list price, Houston area | $362,000 | -3.4% YoY | June 2026, Realtor.com |
| Typical home value, Houston area | $265,062 | not comparable | 2026, Zillow |
These figures should be read together rather than in isolation: sold prices in the core city are holding or rising modestly, list prices are being cut, and inventory is taking longer to clear, which collectively describe a cooling, buyer friendly market rather than a declining one. The defensible investor conclusion is that moderate and softening for sale prices, elevated mortgage rates, and long days on market keep a large share of households renting, which supports both the apartment and single family rental demand pools, while the same high carrying costs that pressure buyers also pressure rental operators through taxes and insurance.
Section 10Commercial Real Estate and Retail Centers
Houston's commercial sectors are moving on different tracks, and the divergence is the central fact for a commercial investor. Office remains the laggard. Savills reported that the Houston office availability rate declined to 26.6 percent in the second quarter of 2026, still very elevated, while Newmark reported that the average full service asking rent rose 8.2 percent year over year to a record $31.07 per square foot, with sublease rents climbing even faster. Partners reported positive office net absorption of 590,137 square feet in the second quarter of 2026, a sharp reversal from negative 195,190 square feet the prior quarter. The combination of record asking rents and still high availability is the signature of a flight to quality: tenants are concentrating in the best buildings and paying up for them, while older commodity space sits empty and drags the average vacancy higher.
Industrial and logistics is the strongest sector, powered by the Port of Houston, interstate distribution, and population driven consumption. Partners reported industrial net absorption of 7,693,443 square feet in the second quarter of 2026, up about 75 percent from the prior quarter, and CBRE had earlier reported 3.2 million square feet of net absorption in the first quarter of 2026. Retail is tight but showing early softening at the margin. The Matthews report for the second quarter of 2026, using CoStar data, described relatively tight retail fundamentals alongside slightly negative quarterly net absorption and elevated cap rates, while Lee and Associates characterized the retail market as fundamentally stable with positive trailing twelve month absorption. Grocery anchored neighborhood centers in the growing suburbs remain the most defensible retail format because they are tied directly to the household growth documented in the population section.
| Sector and scope | Vacancy or availability | Asking rent | Net absorption | Period and source |
|---|---|---|---|---|
| Office, metro | 26.6% availability | $31.07/SF, +8.2% YoY | +590,137 SF | Q2 2026, Savills, Newmark, Partners |
| Industrial, metro | moderate, not stated | not stated | +7,693,443 SF | Q2 2026, Partners |
| Industrial, metro | not applicable | not applicable | +3.2 million SF | Q1 2026, CBRE |
| Retail, metro | tight, low | not stated | slightly negative | Q2 2026, Matthews via CoStar |
The unifying commercial conclusion is that an investor should be selective in office and favor only the highest quality assets, can underwrite industrial and grocery anchored retail with more confidence, and should treat the suburban retail construction pipeline as the main risk to otherwise tight retail conditions.
Section 11Transactions and Capital Markets
Investment activity is recovering off a low base. Northmarq reported that year to date multifamily sales through the second quarter of 2026 were 31 percent above the same period in 2025, even though sales slowed from the first quarter to the second, and it expected transaction volume to accelerate in the second half with full year sales likely to exceed the lighter levels of the prior two years. Buyers have concentrated in Northwest Houston, where transaction velocity nearly matched that submarket's full year 2025 total and accounted for 16 percent of all sales, tying Southeast Houston for the regional lead, with activity clustered along the FM 1960 corridor. Northmarq also noted that buyer interest is broadening to newer properties, with nearly a dozen assets built in the 2020s trading year to date, a sign that institutional appetite for Class A Houston product is returning.
The one directional public signal is from Matthews, which described retail capitalization rates as elevated in the second quarter of 2026, consistent with a national environment of higher interest rates and disciplined underwriting. The practical implication is that entry pricing has reset lower than the 2021 and 2022 peaks, that transaction volume is rising, and that an investor underwriting Houston today is doing so at more conservative valuations than were available three years ago, which is generally favorable for new capital.
Section 12Taxes
Texas imposes no personal state income tax, a fact confirmed by the Texas Comptroller of Public Accounts and a genuine advantage for both residents and property owners, but the state funds itself substantially through property taxes, which are correspondingly high. The authoritative source for local rates is the Harris County Tax Office truth in taxation schedule published under Section 26.16 of the Texas Property Tax Code, which lists each taxing jurisdiction's rate. Aggregating those jurisdictions, tax advisory analyses place the effective residential property tax rate in Harris County at approximately 2.0 percent of value, with one such analysis by Ballard citing about 2.03 percent based on 2025 rates. A separate compilation reported a median annual property tax bill of about $4,489 on a median home value of $276,600 for 2024.
| Item | Value | Scope and source |
|---|---|---|
| Texas personal income tax | none | Texas Comptroller |
| Harris County effective property tax rate | ~2.03% of value | 2025 rates, Ballard analysis |
| Median annual property tax | $4,489 | 2024, on median value $276,600, tax compilation |
For an investor, high property taxes are the single largest recurring operating cost after debt service and must be modeled explicitly, including the near certainty of reassessment as values change and the availability of homestead exemptions for owner occupants that do not apply to investment property. The absence of a state income tax nonetheless improves after tax returns for individual investors and is part of why Texas attracts both people and capital.
Section 13Insurance
Insurance is the fastest rising cost in the Houston ownership equation and a genuine underwriting risk. Analysis by the Kinder Institute at Rice University of Texas Department of Insurance data found that Harris County homeowners paid an average of roughly $3,325 in property insurance premiums in 2023, an increase of about 43 percent from 2015, driven by rising property values and repeated severe storms, and that premiums rose another 19 percent in 2024. The Kinder analysis found average annual premiums ranging from $5,000 to $9,500 in the wealthiest neighborhoods down to less than $2,500 in many lower income areas. The Houston Chronicle reported in April 2026 that rates were set to rise again in 2026.
| Item, Harris County | Value | Scope and source |
|---|---|---|
| Average homeowners premium | $3,325 | 2023, TDI via Kinder Institute |
| Change 2015 to 2023 | +43% | TDI via Kinder Institute |
| Premium change in 2024 | +19% | TDI via Kinder Institute |
Flood insurance is a separate and material cost given Houston's exposure. Most flood coverage flows through the National Flood Insurance Program administered by FEMA, and FEMA released draft updated flood maps for Houston and Harris County under the MAAPNext initiative in February 2026, a remapping that will move some properties into higher risk designations and raise their required coverage. The clear investor conclusion is that both windstorm and flood insurance must be quoted specifically for each asset and stress tested for further increases, because rising premiums directly reduce net operating income and can materially change a deal's return.
Section 14Landlord Tenant and Regulatory Environment
Texas is among the most landlord friendly regulatory environments in the country, which is a structural positive for owners. State law preempts local rent control: under the Texas Local Government Code, a municipality generally may not establish rent control except in a narrowly defined housing emergency that requires the governor's approval, so the rent regulation risk that weighs on coastal markets is effectively absent in Houston. Residential tenancies are governed by Chapter 92 of the Texas Property Code, and the eviction process, formally a forcible detainer action, is comparatively fast and predictable, which reduces the cost and duration of dealing with nonpaying tenants relative to tenant friendly states.
Houston is also distinctive for having no formal zoning code, the only major United States city without one, which the city itself acknowledges. Land use is instead governed by deed restrictions, subdivision and development ordinances, and parking and setback rules administered through the city and county planning and permitting offices. For a developer or value add investor, the practical effect is faster and more flexible development in many cases, offset by the need to conduct careful diligence on deed restrictions and the surrounding uses that no zoning map guarantees. The overall regulatory conclusion is favorable for owners on rent and eviction policy and flexible on land use, with diligence shifted onto private restrictions rather than public zoning.
Section 15Infrastructure
Houston's infrastructure is a core demand driver, particularly for industrial and logistics real estate. Port Houston operates along the Houston Ship Channel and is consistently ranked as the leading United States port by foreign waterborne tonnage and a national leader in total tonnage, and it anchors an enormous petrochemical and distribution complex that generates warehouse and manufacturing demand across the eastern and southeastern submarkets. The region is served by two major airports, George Bush Intercontinental and William P. Hobby, and by an extensive interstate network including Interstate 10, Interstate 45, and the Grand Parkway outer loop, the last of which has opened large tracts of suburban land to residential and commercial development along its arc.
The Texas Medical Center, which its member institutions describe as the largest medical complex in the world, is both an employment anchor and a driver of specialized demand for housing, office, and lab space in the central city. The main infrastructure caution is resilience: the same storms that drive insurance costs have repeatedly stressed the electric grid, most visibly in the prolonged outages that followed the 2024 windstorms, and grid resilience is a real operating consideration for any Houston asset. For an investor, the infrastructure conclusion is that Houston's port, highways, airports, and medical complex create durable, location specific demand that favors well positioned industrial and centrally located assets.
Section 16Climate and Physical Risks
Physical risk is the factor an out of state investor is most likely to underestimate. Houston sits on the Gulf Coast in a hurricane exposed, flood prone basin. Hurricane Harvey in 2017 was one of the costliest weather disasters in United States history, with damage estimated by NOAA at roughly $125 billion and rainfall totals exceeding fifty inches in parts of the region, and the metro has since experienced additional damaging events including severe convective storms and hurricane force winds that caused prolonged power outages in 2024. The flood risk is being formally reassessed: FEMA's MAAPNext draft maps released in February 2026 update the floodplain boundaries for Harris County and will change insurance requirements for many parcels.
The investor implications are direct and should be built into every Houston underwrite. First, flood zone status must be verified parcel by parcel against the newest FEMA mapping, not the older effective maps, because a property outside the historical floodplain may fall inside the revised one. Second, windstorm and flood insurance costs, already rising as documented above, should be stress tested for further storm driven increases. Third, capital reserves and business interruption assumptions should reflect the real probability of a major storm during a typical hold period. Physical risk does not disqualify Houston, given that its population and economy keep growing despite these events, but it must be priced rather than ignored, and assets with elevation, drainage, and modern construction warrant a premium.
Section 17Neighborhoods and Submarkets
Houston is a collection of distinct submarkets, and capital is flowing unevenly among them. On the investment side, Northmarq identified Northwest Houston, particularly the FM 1960 corridor from Route 290 toward Westfield, and Southeast Houston as the most active multifamily trading areas in 2026, each accounting for about 16 percent of sales, with much of the traded stock built between the 1970s and the 1990s alongside a growing share of assets built in the 2020s. On the demand side, the fastest population growth is in the suburban ring: Waller County to the northwest, identified by the Census Bureau as one of the fastest growing counties in the nation, along with Katy and Cypress to the west, Conroe and The Woodlands to the north in Montgomery County, Fort Bend County to the southwest, and Pearland to the south.
Within the core, the picture is more mixed. The Inner Loop neighborhoods such as the Heights, Montrose, and the Museum District command the region's highest for sale prices and steady rental demand, the Energy Corridor and Westchase on the west side are tied to the fortunes of the energy and office sectors and therefore carry more office overhang, and the Texas Medical Center and Downtown submarkets are driven by institutional employment. The submarket conclusion for an investor is that suburban growth corridors offer the strongest demographic tailwinds and land for new product, that older Northwest and Southeast apartment stock is where current transaction liquidity is deepest, and that core neighborhoods offer stability and pricing power at higher entry costs.
Section 18Opportunities
The clearest opportunity is multifamily positioned for the supply recovery. With deliveries forecast by Northmarq to fall to roughly 5,600 units in 2027, the lowest in nearly fifteen years, and demand supported by national leading population growth, investors who acquire during the current period of soft rents and elevated but falling vacancy stand to benefit as occupancy tightens and concessions burn off. Value add strategies on the 1980s and 1990s vintage stock that dominates current transaction volume in Northwest and Southeast Houston are one expression of this thesis, and Class A assets built in the 2020s, now beginning to trade, are another for investors seeking newer product at reset pricing.
Industrial and logistics is a second opportunity, underpinned by Port Houston, distribution demand, and consumption from a growing population, with second quarter 2026 net absorption of more than 7.6 million square feet reported by Partners demonstrating the depth of demand. Grocery anchored neighborhood retail in the high growth suburbs is a third, tied directly to household formation, provided investors underwrite the localized construction pipeline. Across all of these, Houston's affordability, its landlord friendly and zoning free regulatory environment, and the absence of a state income tax combine to make it a market where operational execution can drive returns even without aggressive assumptions about rent growth.
Section 19Risks
The risks are equally concrete. Carrying costs are the first: property taxes near 2 percent of value and homeowners insurance premiums that rose 43 percent from 2015 to 2023 and another 19 percent in 2024, per the Kinder Institute analysis of Texas Department of Insurance data, together consume a large share of gross income and are rising faster than rents. Physical risk is the second: genuine hurricane and flood exposure, with FEMA actively expanding mapped flood zones through the MAAPNext process in 2026, which raises both insurance costs and the probability of storm related capital losses. The third risk is the pace of rent growth itself: with rents essentially flat and only slightly above year ago levels, and moderate household incomes capping affordability, an investor counting on rapid rent increases would be underwriting against the current evidence.
Sector specific risks round out the picture. Office carries availability above 26 percent and a deep divide between winning and losing buildings, making it unsuitable for any but the most selective and well capitalized investors. Retail, though tight, showed slightly negative quarterly absorption and faces a sizable construction pipeline in the growing suburbs. The energy sector, while diversified away from, still influences the regional economy and the office market, and the recent rise in the unemployment rate to 5.2 percent in June 2026 is a reminder that the labor market is cooling at the margin. Each of these risks is manageable with disciplined underwriting, but none should be assumed away.
Section 20Investor Implications
For an accredited investor evaluating Houston, the evidence supports a constructive but disciplined stance. The demographic and supply setup for multifamily is genuinely favorable: a metropolitan area of roughly eight million people growing faster in absolute terms than any other in the nation, meeting a forward apartment pipeline that Northmarq projects will fall to a fifteen year low in 2027. That combination historically produces tightening occupancy and, with a lag, renewed rent growth, and the current period of flat rents and reset transaction pricing is arguably an attractive entry window rather than a warning sign. Industrial and grocery anchored retail offer additional, more stable avenues tied to the same population and consumption growth.
The discipline required is in the underwriting of costs and risk rather than in the demand thesis. Every Houston deal should carry an explicit, asset specific model of property taxes near 2 percent of value, insurance premiums that are rising and must be quoted rather than assumed, and flood exposure verified against the newest FEMA maps and reserved for accordingly. Return expectations should be built on occupancy gains, expense discipline, and modest rent growth, not on aggressive appreciation. Investors comfortable with Gulf Coast physical risk and high carrying costs, and who underwrite them honestly, are being offered a large, liquid, affordable, and growing market at pricing well below the last cycle's peak. Those unwilling to price storm and insurance risk explicitly should look elsewhere, because in Houston those factors are not tail risks but recurring line items.
Section 21Conclusion
Houston at the midpoint of 2026 is a growth market in the early innings of a supply led recovery. Population growth leads the nation, the economy is expanding across energy, healthcare, logistics, and services, and the apartment market has just posted its largest quarterly vacancy improvement in nearly five years as a thinning construction pipeline meets accelerating demand. Home prices are cooling into buyer friendly territory, industrial and grocery anchored retail are healthy, and office remains the one clearly troubled sector, concentrated in older buildings. Against this stand high property taxes, sharply rising insurance costs, and real hurricane and flood exposure that FEMA is remapping this year. The market rewards investors who embrace the demand story while pricing the cost and risk story with equal rigor. Houston's scale, affordability, favorable regulation, and demographic momentum make it one of the more compelling large markets in the country for patient capital, provided the underwriting is honest about what it costs to own and operate there.
Sources
- Greater Houston Partnership, Houston: The Economy at a Glance, April 2026, https://wpb.houston.org/app/uploads/2026/04/Glance-April-2026-Final.pdf
- U.S. Census Bureau, Metropolitan and Micropolitan Statistical Area Population Totals and Components of Change, 2020 to 2025, https://www.census.gov/data/tables/time-series/demo/popest/2020s-total-metro-and-micro-statistical-areas.html
- U.S. Census Bureau QuickFacts, Harris County, Texas, https://www.census.gov/quickfacts/fact/table/harriscountytexas
- Data USA, Harris County, TX profile (Census and ACS data), https://datausa.io/profile/geo/harris-county-tx
- Houston Chronicle, Houston and Harris County led U.S. population growth, https://www.houstonchronicle.com/news/houston-texas/article/houston-census-population-immigration-22080175.php
- CultureMap Houston, Houston leads America in population growth for 2025, https://houston.culturemap.com/news/city-life/houston-harris-county-population-grown/
- KWTX, Texas suburbs lead U.S. for population growth, https://www.kwtx.com/2026/03/27/texas-suburbs-lead-us-population-growth-international-migration-slows-census-finds/
- U.S. Bureau of Labor Statistics, Houston Economy at a Glance, updated August 3, 2026, https://www.bls.gov/eag/eag.tx_houston_msa.htm
- U.S. Bureau of Labor Statistics, Houston Area Economic Summary, https://www.bls.gov/regions/southwest/summary/blssummary_houston.pdf
- Federal Reserve Bank of St. Louis, Estimate of Median Household Income for Harris County, TX, https://fred.stlouisfed.org/series/MHITX48201A052NCEN
- Yardi Matrix, Matrix Multifamily Houston Report, July 2026, https://www.yardimatrix.com/multifamily-metro/matrix-multifamily-houston-report-july-2026/
- Northmarq, Houston Multifamily Market Insights, Q2 2026, https://www.northmarq.com/insights/insights/houston-multifamily-vacancies-trend-lower-midyear-q2-2026
- MMG Real Estate Advisors, Houston Q2 2026 Market Report, https://mmgrea.com/houston-q2-2026-market-report/
- Redfin, Houston, TX Housing Market, https://www.redfin.com/city/8903/TX/Houston/housing-market
- Realtor.com, Houston, TX real estate market, June 2026, https://www.realtor.com/news/local/houston-tx/real-estate-market-houston-tx-june-2026-2/
- Zillow, Houston, TX Home Values, https://www.zillow.com/home-values/91791/houston-tx-77249/
- CBRE, Houston Office Figures, Q2 2026, https://www.cbre.com/insights/figures/houston-office-figures-q2-2026
- Newmark, Houston Office Market Report, Q2 2026, https://nmrk.imgix.net/uploads/fields/pdf-market-reports/2Q26-Houston-Texas-Office-Market-Report.pdf
- Savills, Houston Office Market in Minutes, Q2 2026, https://pdf.euro.savills.co.uk/usa/market-reports/houston-mim-office-q2-2026.pdf
- Partners Real Estate, Houston Office Q2 2026 Quarterly Report, https://partnersrealestate.com/wp-content/uploads/2026/08/Houston-Office-Q2-2026-Quarterly-Report.pdf
- Partners Real Estate, Houston Industrial Q2 2026 Quarterly Report, https://partnersrealestate.com/wp-content/uploads/2026/04/Houston-Q2-26-Industrial.pdf
- CBRE, Houston Industrial Figures, Q1 2026, https://www.cbre.com/insights/figures/houston-industrial-figures-q1-2026
- Matthews, Houston, TX Retail Market Report, Q2 2026 (CoStar and Oxford Economics data), https://www.matthews.com/insights/houston-retail-market-report-q2-2026
- Lee and Associates, Houston Retail Market Report, Q2 2026, https://www.lee-associates.com/wp-content/uploads/2026/07/2026-Q2-Houston-TX-Retail.pdf
- Harris County Tax Office, Truth in Taxation Summary (Texas Property Tax Code Section 26.16), https://www.hctax.net/Property/JurisdictionTaxRates
- Ballard Property Tax, Harris County Property Tax Rate 2025, https://www.ballardpropertytaxprotest.com/post/harris-county-property-tax-rate
- Property Tax By State, Harris County, TX Property Tax Rate, https://propertytaxbystate.com/texas/harris-county
- Kinder Institute for Urban Research, Rice University, Harris County homeowners insurance costs (Texas Department of Insurance data), https://kinder.rice.edu/urbanedge/harris-county-homeowners-insurance-cost
- Houston Chronicle, Houston home insurance rates set to rise again in 2026, https://www.houstonchronicle.com/business/article/home-insurance-rates-houston-2026-22192206.php
- FEMA MAAPNext flood mapping program for Harris County, https://www.maapnext.org
- NOAA National Centers for Environmental Information, Billion Dollar Weather and Climate Disasters (Hurricane Harvey), https://www.ncei.noaa.gov/access/billions/