In brief · summary: Indianapolis
Indianapolis is the capital and largest city in Indiana and the core of the Indianapolis Carmel Greenwood metropolitan area. The local economy combines state government, health care, logistics, advanced manufacturing, sports and events, and professional services.
This structure supports demand for multifamily housing, single family homes, and a range of commercial property types. This review focuses on the city of Indianapolis, using metropolitan and statewide data as proxies where city specific figures are not available from public sources in this environment.
According to the Bureau of Labor Statistics Indianapolis Carmel Greenwood metropolitan Economy at a Glance table, the metropolitan civilian labor force was 1,153.8 thousand persons in January 2026 and a preliminary 1,168.7 thousand persons in June 2026, not seasonally adjusted. Metropolitan employment was 1,120.2 thousand persons in January 2026 and a preliminary 1,129.2 thousand in June 2026, while unemployment increased from 33.5 thousand to a preliminary 39.6 thousand over the same period. The metropolitan unemployment rate moved from 2.9 percent in January 2026 to a preliminary 3.4 percent in June 2026, still low by national standards. Total nonfarm employment in the metropolitan area was 1,155.0 thousand jobs in January 2026 and a preliminary 1,166.5 thousand jobs in June 2026, with the twelve month change in total nonfarm jobs at …
Section 01Executive Summary
Indianapolis is the capital and largest city in Indiana and the core of the Indianapolis Carmel Greenwood metropolitan area. The local economy combines state government, health care, logistics, advanced manufacturing, sports and events, and professional services. This structure supports demand for multifamily housing, single family homes, and a range of commercial property types. This review focuses on the city of Indianapolis, using metropolitan and statewide data as proxies where city specific figures are not available from public sources in this environment.
According to the Bureau of Labor Statistics Indianapolis Carmel Greenwood metropolitan Economy at a Glance table, the metropolitan civilian labor force was 1,153.8 thousand persons in January 2026 and a preliminary 1,168.7 thousand persons in June 2026, not seasonally adjusted. Metropolitan employment was 1,120.2 thousand persons in January 2026 and a preliminary 1,129.2 thousand in June 2026, while unemployment increased from 33.5 thousand to a preliminary 39.6 thousand over the same period. The metropolitan unemployment rate moved from 2.9 percent in January 2026 to a preliminary 3.4 percent in June 2026, still low by national standards. Total nonfarm employment in the metropolitan area was 1,155.0 thousand jobs in January 2026 and a preliminary 1,166.5 thousand jobs in June 2026, with the twelve month change in total nonfarm jobs at a preliminary negative 1.3 percent in June 2026, not seasonally adjusted.
At the statewide level, the Bureau of Labor Statistics Indiana Economy at a Glance table shows that the Indiana statewide civilian labor force was 3,503.6 thousand persons in January 2026 and a preliminary 3,491.3 thousand in June 2026, seasonally adjusted. Statewide employment was 3,385.2 thousand persons in January 2026 and a preliminary 3,376.3 thousand in June 2026. The Indiana unemployment rate remained around 3.3 to 3.4 percent over this period, and total nonfarm employment was 3,251.0 thousand jobs in January 2026 and a preliminary 3,261.7 thousand in June 2026, with the twelve month change in total nonfarm jobs at a preliminary negative 0.1 percent in June 2026. These figures indicate a state and metropolitan labor market that remain tight, with low unemployment but minimal net job growth.
On the ownership side, Redfin Indiana housing market overview reports that statewide home prices across all home types had a median sale price of 280,055 dollars in May 2026, which was 3.7 percent higher than in May 2025. In the same month, there were 27,511 homes for sale statewide, up 5.7 percent year over year, and 18.2 percent of homes sold above list price, down 1.1 percentage points year over year. For national comparison, Redfin United States housing overview shows that the national median sale price across all home types was 398,771 dollars in May 2026, up 2.0 percent year over year, with 1,483,839 homes for sale nationwide, up 0.7 percent year over year, and 24.9 percent of homes selling above list price, down 0.083 percentage points over the year. Redfin notes that these figures are based on multiple listing service and public record data.
Attempts to retrieve current Census QuickFacts data for the population of Indianapolis and Marion County are blocked in this environment by security measures at the United States Census Bureau, and the Redfin city level housing page requested for Indianapolis redirects to Holloway in Ohio. As a result, this review cannot state current official numeric population figures for the city or county, and it cannot present city specific Redfin housing statistics. Instead, it uses metropolitan Bureau of Labor Statistics data and statewide Redfin housing metrics as the closest public proxies and states clearly where city level data are unavailable. Investors should treat this review as a detailed structural and directional analysis and should obtain current property and neighborhood level figures from primary and proprietary sources before making investment decisions.
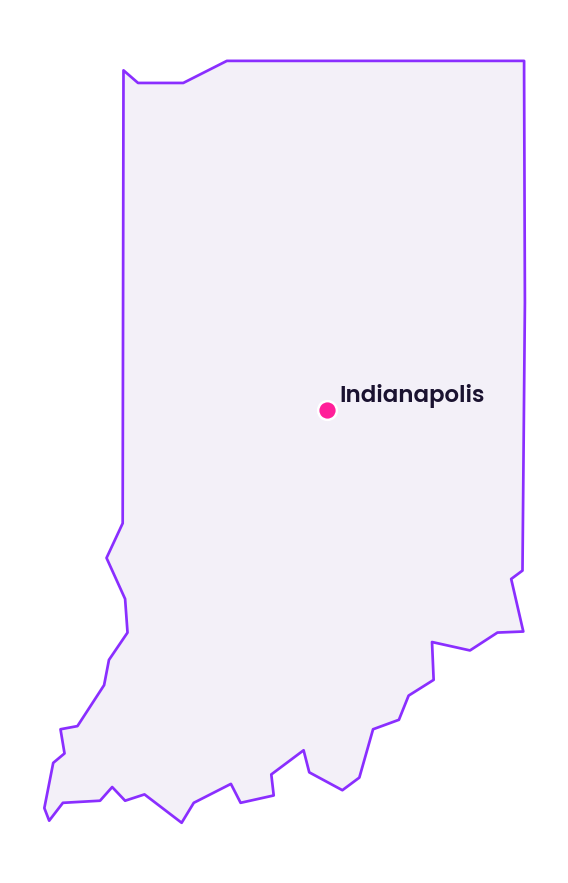
Section 02Population and Migration
Population size and movement determine the base of housing demand and labor supply in Indianapolis. The primary public sources for these statistics are the United States Census Bureau decennial census, the Population and Housing Unit Estimates program, and the American Community Survey. City and county level data, including current population counts for Indianapolis and Marion County and recent migration flows, are delivered through interactive tables and QuickFacts pages. In this environment, programmatic access to the Indianapolis and Marion County QuickFacts page is blocked by Cloudflare security protection, as confirmed by a web fetch attempt that returned an access denied message. Therefore, this review cannot restate numeric population figures or recent migration totals for the city or county.
Historically, published Census results indicate that Indianapolis has grown steadily over the past several decades, supported by its role as the state capital, a regional administrative center, and a logistics and transportation hub. The metropolitan area includes suburban communities in surrounding counties, and growth has been driven by a mix of suburban expansion and infill within the urban core. Migration patterns have included in migration from smaller Indiana communities and neighbouring states, as well as some international migration, alongside out migration of some residents to faster growing Sun Belt markets.
Because numeric population and migration data for the current period cannot be accessed in this environment, any investment thesis that depends on precise population levels or growth rates for Indianapolis and Marion County must draw on the most recent Population Estimates and American Community Survey releases outside this environment. At a structural level, however, the city remains a regional center for government, health care, logistics, higher education, and sports, which tend to support stable if not explosive population trends and create varied housing needs across income and age groups.
Section 03Jobs and Economic Anchors
The labor market in Indianapolis is central to real estate demand across asset classes. The Bureau of Labor Statistics Indianapolis Carmel Greenwood metropolitan Economy at a Glance table provides current quantitative context. The following table summarizes selected metropolitan labor indicators for January, March, and June 2026, not seasonally adjusted, as extracted on August 7, 2026.
| Month 2026 | Indianapolis Carmel Greenwood metro civilian labor force thousands | Employment thousands | Unemployment rate percent | Total nonfarm jobs thousands | Twelve month change in total nonfarm jobs percent |
|---|---|---|---|---|---|
| January 2026 | 1,153.8 | 1,120.2 | 2.9% | 1,155.0 | negative 0.6 |
| March 2026 | 1,151.3 | 1,113.3 | 3.3% | 1,164.0 | negative 0.5 |
| June 2026 preliminary | 1,168.7 | 1,129.2 | 3.4% | 1,166.5 | negative 1.3 |
These metrics show that the metropolitan labor force expanded modestly between January and June 2026, from 1,153.8 thousand to a preliminary 1,168.7 thousand persons, while employment grew from 1,120.2 thousand to a preliminary 1,129.2 thousand. Unemployment remained low in absolute terms but increased from 33.5 thousand to a preliminary 39.6 thousand persons over the same period, and the metropolitan unemployment rate moved from 2.9 percent to a preliminary 3.4 percent. Total nonfarm jobs grew slightly in level from January to May 2026 but were at a preliminary 1,166.5 thousand in June, below the May level of 1,175.8 thousand, and the twelve month change in total nonfarm employment was a preliminary negative 1.3 percent in June 2026. Taken together, these data describe a metropolitan economy with a large and engaged labor force, low unemployment relative to national norms, but net job losses over the prior year.
Sector detail illustrates the economic anchors that support real estate demand. In June 2026, not seasonally adjusted, the metropolitan area had 72.6 thousand construction jobs, 96.9 thousand manufacturing jobs, and 240.5 thousand jobs in trade, transportation, and utilities. Professional and business services employment was 181.0 thousand, while education and health services employment was 190.7 thousand. Leisure and hospitality accounted for 113.1 thousand jobs, financial activities 76.3 thousand, and government 134.7 thousand. Twelve month changes were mixed. Construction jobs were higher than a year earlier, indicating low single digit positive twelve month growth in recent months. Manufacturing employment was modestly lower than a year earlier. Trade, transportation, and utilities jobs were also somewhat lower than one year earlier. Professional and business services, education and health services, leisure and hospitality, and financial activities all saw small negative to modest positive twelve month changes, reflecting an environment of sector rotation rather than broad acceleration.
At the statewide level, the Bureau of Labor Statistics Indiana Economy at a Glance table shows a similar pattern of tight labor markets with limited net job growth. Indiana statewide had 3,503.6 thousand persons in the labor force in January 2026 and a preliminary 3,491.3 thousand in June 2026, with employment near 3,376 thousand over the period and an unemployment rate around 3.3 to 3.4 percent, seasonally adjusted. Total nonfarm jobs were 3,251.0 thousand in January and a preliminary 3,261.7 thousand in June 2026, with the twelve month change still slightly negative at a preliminary 0.1 percent decline in June.
For Indianapolis investors, these labor statistics imply that tenant demand is supported by a wide mix of sectors, including construction, manufacturing, logistics, professional services, health care, and government, but that recent job growth has been constrained. Properties appealing to tenants in sectors that are adding jobs, such as construction and parts of health care, may face stronger demand than properties tied to sectors that are contracting or flat.
Section 04Income
Income levels in Indianapolis affect housing affordability, achievable residential rents, and the depth of demand for higher quality commercial space. Quantitative measures such as median household income, per capita income, and income distribution by neighborhood are available from the American Community Survey and from Bureau of Economic Analysis personal income tables for Indiana and its metropolitan areas. In this environment, these detailed city and metropolitan income tables are provided through interactive tools and data files that cannot be reliably accessed, so this review cannot present current numeric values for median household income or per capita income for Indianapolis, Marion County, or the Indianapolis Carmel Greenwood metropolitan area.
Historically, public sources have indicated that incomes in Indianapolis are around or somewhat below national averages, reflecting the city mix of government, logistics, manufacturing, and service employment, offset by higher incomes in health care, education, and corporate roles. There is meaningful variation within the city and region. Neighborhoods and suburbs with concentrations of professional and managerial households, particularly to the north and northwest of the core, tend to show higher incomes, while older urban neighborhoods and some outlying communities exhibit lower incomes and greater economic vulnerability.
For investors, these income patterns underline the need for submarket level analysis. Multifamily and single family rental properties that target higher income households may have more room for rent growth and can better support renovations and amenity investments, while workforce oriented properties require sensitive pricing and service strategies. Because this document cannot quote specific income figures, underwriting for Indianapolis investments should include direct reference to current American Community Survey data and, where appropriate, local wage and salary data by sector.
Section 05Housing and Multifamily
The housing stock in Indianapolis includes a large base of single family homes, small multifamily buildings, and institutional scale apartment communities in both urban neighborhoods and suburban areas. Multifamily properties serve students, young professionals, families, and older households seeking rental options. The performance of this segment depends on local employment, demographics, ownership costs, and supply additions.
City specific public housing statistics from platforms such as Redfin and Zillow would normally provide metrics on median sale price, price per square foot, and days on market for Indianapolis, but in this environment the Redfin city level housing page requested for Indianapolis redirected to a different city in Ohio. Because the redirected data clearly apply to another location, no Redfin city level statistics for Indianapolis can be used here. Other city level housing dashboards are either not publicly accessible or are delivered through interactive components that cannot be parsed. As a result, this review uses Indiana statewide Redfin housing data and Indianapolis Carmel Greenwood metropolitan labor statistics as the closest available proxies and then discusses multifamily conditions in Indianapolis qualitatively.
Redfin Indiana statewide housing overview shows that in May 2026 the median sale price of homes across all property types in Indiana was 280,055 dollars, a 3.7 percent increase compared with May 2025. There were 27,511 homes for sale statewide in May 2026, up 5.7 percent year over year, and 18.2 percent of homes sold above list price, down 1.1 percentage points relative to one year earlier. For comparison, the national median sale price across all home types was 398,771 dollars in May 2026, up 2.0 percent year over year, with 1,483,839 homes for sale nationwide, up 0.7 percent, and 24.9 percent of homes selling above list price, down 0.083 percentage points year over year.
The following table summarizes these statewide and national Redfin metrics for May 2026.
| Geography and scope May 2026, all home types | Median sale price dollars | Year over year change in median sale price percent | Homes for sale count | Year over year change in homes for sale percent | Homes sold above list price percent | Year over year change in share of homes sold above list percentage points |
|---|---|---|---|---|---|---|
| Indiana statewide | 280,055 | 3.7% | 27,511 | 5.7% | 18.2% | negative 1.1 |
| United States nationwide | 398,771 | 2.0% | 1,483,839 | 0.7% | 24.9% | negative 0.083 |
These data show that Indiana is significantly more affordable than the nation as a whole on a median price basis, but that price growth in the twelve months to May 2026 was stronger statewide than nationally. They also show that inventory is growing faster in Indiana than across the country and that the share of homes selling above list price is lower and declining more quickly in Indiana than in the United States as a whole. This picture suggests that the housing market in Indiana is entering a more balanced phase, where buyers have increasing options and sellers face slightly less intense competition than one year earlier.
For multifamily investors in Indianapolis, statewide price and supply trends matter because they influence the relative appeal of renting versus owning. A low statewide median price supports ownership in many markets, but faster price growth can delay entry for some households, particularly younger buyers. Growing inventory and a declining share of above list sales indicate that buyers have more negotiating power, which can reduce the urgency to buy and keep some households in the rental pool longer.
Within Indianapolis, multifamily demand is anchored by state government operations, the health care sector around major hospital systems, higher education institutions, logistics and warehouse employment, and the downtown office and events ecosystem. Institutional quality apartment properties cluster in and near the downtown core, along key corridors, and in suburban communities with strong school districts and amenities. Workforce properties serve renters across a wide income range in older city neighborhoods and inner ring suburbs. Without current city specific rent and occupancy statistics, investors must view these structural descriptions as a starting point and rely on external data for precise underwriting.
Section 06Rents
Rents determine the income side of the multifamily and single family rental equation in Indianapolis. Public rent benchmarks include the United States Department of Housing and Urban Development Fair Market Rents, which are published for the Indianapolis metropolitan area and define gross rent levels by bedroom count for voucher programs and other purposes. For fiscal year 2026, these Fair Market Rent figures are available in documentation and large spreadsheet files. In this environment, those files cannot be parsed programmatically, so this review cannot quote the current Fair Market Rent in dollars for a two bedroom or any other unit size in the Indianapolis metropolitan area.
Private data providers such as CoStar, Yardi Matrix, and RealPage maintain detailed rent series by submarket, property class, and building age for Indianapolis multifamily properties. These datasets are proprietary and are not available for numeric extraction in this environment. As a result, this review cannot state current average asking or effective rent per unit or per square foot for apartments in Indianapolis, nor can it present year over year rent growth percentages.
Qualitatively, rents in Indianapolis tend to be lower than in many coastal and high growth Sun Belt cities, but they must be assessed against local incomes, property taxes, and insurance costs. Newer urban properties near downtown, the stadiums, the convention center, and cultural districts often command higher rents and cater to professionals and students. Suburban complexes in strong school districts and near employment corridors can also achieve solid rent levels and occupancy. Older properties in less advantaged neighborhoods typically charge lower rents and may face higher turnover or collection risk.
For investors, the absence of numeric rent data in this document places a premium on direct property level information. Underwriting should be based on current rent rolls, market rent surveys, and independent third party research that provides submarket rent and growth estimates. Sensitivity analysis around rent growth and concessions is particularly important in a market where statewide house prices and inventory are shifting.
Section 07Vacancy
Vacancy affects both income volatility and capital value in multifamily, single family rental, and commercial assets. For housing, rental vacancy rates and homeowner vacancy rates are published by the Census Bureau via its Housing Vacancy Survey and American Community Survey, including metropolitan and sometimes city specific measures. In this environment, there is no accessible path to retrieve current numeric vacancy rates for the city of Indianapolis or the Indianapolis metropolitan area. For commercial properties, vacancy information is tracked primarily by proprietary providers and brokerage firms and is not available for extraction here.
This means that this review cannot present current rental vacancy percentages for Indianapolis apartments or rental houses, nor can it provide office, industrial, or retail vacancy rates in the city. Historically, vacancy in Indianapolis multifamily has been moderate, with lower vacancy in well located suburban and urban submarkets and higher vacancy in older or more peripheral areas, and vacancy cycles have tended to follow employment trends and new supply waves.
For investors, current and projected vacancy must be evaluated using asset specific and submarket specific information, including historical occupancy trends for the property, leasing velocity, and the competitive set. Without public numeric vacancy series in this document, generalizations about tight or loose market conditions remain qualitative and must be tested against up to date local data.
Section 08Supply Pipeline
The supply pipeline of new residential and commercial projects determines future competitive dynamics for existing properties. The Census Bureau Building Permits Survey reports the number of residential units authorized by building permits by metropolitan area and place, including the Indianapolis metropolitan area. City planning and permitting portals provide more granular project data. However, in this environment, the tabular permit data for Indianapolis metropolitan area are served through interactive tools and downloadable files that cannot be parsed for numeric extraction. The city planning and permit portals also rely on interactive interfaces that cannot be scraped in an automated fashion.
As a result, this review cannot state the number of new multifamily units or single family homes permitted in Indianapolis or the Indianapolis metropolitan area in recent years. It also cannot provide a numeric estimate of commercial square footage under construction or in the pipeline.
Qualitatively, Indianapolis has seen significant development activity in its downtown and near downtown neighborhoods, including mixed use projects, new multifamily buildings, and urban infill, as well as continued suburban development along major transportation corridors. There has also been ongoing construction of logistics and warehouse facilities around interstate junctions and industrial parks. These patterns reflect investor confidence in the city role as a regional logistics and professional services center and the availability of land for development.
For investors, the key implication is that pipeline risk must be studied submarket by submarket. Even if overall metropolitan supply growth is moderate, particular neighborhoods or corridors may experience concentrated deliveries that affect rents, occupancy, and pricing for existing assets.
Section 09Single Family Homes
Single family homes are the dominant housing type in Indianapolis and Marion County. They serve owner occupants and form the base for single family rental strategies. As in other sections, the inability of this environment to retrieve current city specific metrics from platforms such as Redfin and Zillow or from multiple listing services limits the quantitative precision of this review. The Redfin city level page requested for Indianapolis returned data for Holloway in Ohio, which clearly do not apply to Indianapolis, and other city level resources are not accessible.
Instead, this review relies on Indiana statewide Redfin housing statistics as a proxy for single family conditions in Indianapolis and then considers the qualitative local structure. As noted above, Redfin reports that in May 2026 the Indiana statewide median sale price across all home types was 280,055 dollars, up 3.7 percent from May 2025, with 27,511 homes for sale, up 5.7 percent year over year, and 18.2 percent of homes selling above list price, down 1.1 percentage points year over year. Since single family homes are the majority of closed transactions in most Indiana markets, these statewide metrics provide a directional indication of the environment for single family housing.
Indianapolis contains a wide range of single family submarkets. Inner neighborhoods include older housing stock, often on grid streets, with proximity to downtown employment, services, and culture. Some of these areas have seen reinvestment and rising prices, while others face continued disinvestment pressures. Suburban neighborhoods around the city offer more recent construction, larger homes, and access to schools and services that appeal to families. There are also exurban and rural communities within commuting distance that provide lower cost options.
For single family rental investors, Indianapolis and its suburbs offer a combination of relatively low acquisition costs compared with national medians, steady demand from households who prefer rental living or are not yet ready to buy, and meaningful variation in neighborhood quality and risk. Strategy choices include scattered site investment in existing homes, concentration within specific neighborhoods, or participation in build for rent communities in suburban locations. The statewide Redfin data imply that price growth has been stronger than national averages, which can support appreciation returns, but the increase in statewide inventory and decline in the share of above list sales suggest that pricing is becoming more disciplined. Underwriting must therefore be careful about purchase price, expected rent, property tax and insurance costs, and capital expenditure needs.
Section 10Commercial Real Estate and Retail Centers
Commercial real estate in Indianapolis serves government, corporate, health care, education, logistics, and retail functions. Office space is concentrated downtown and in suburban office parks. Industrial and logistics properties cluster along interstate highways and around distribution nodes. Retail is distributed among regional malls, lifestyle centers, big box corridors, grocery anchored neighborhood centers, and smaller strip centers.
Vacancy, rent, and cap rate data for Indianapolis commercial properties are maintained primarily by proprietary providers such as CoStar and by brokerage research. These resources are not publicly accessible for numeric extraction in this environment. As a result, this review cannot present current office, industrial, or retail vacancy percentages or average asking rents in Indianapolis, nor can it provide numeric cap rate ranges by property type or submarket.
Qualitatively, the downtown Indianapolis office market is shaped by state government offices, corporate and professional services, legal and financial firms, and organizations connected to sports and events. The shift toward remote and hybrid work has affected demand for traditional office space, particularly in older buildings with fewer amenities, while newer or well located properties with good access, parking, and services remain more competitive.
Industrial and logistics space in the Indianapolis metropolitan area benefits from the city role as a regional distribution hub, with access to interstate highways and central positioning in the national road network. Warehouses and distribution centers serve retail and electronic commerce tenants, manufacturers, and logistics firms. Demand in this segment has been supported by continued growth in online retail and supply chain reconfiguration, though growth rates may be moderating from earlier peaks.
Retail centers face the familiar challenges of changing consumer behavior and competition from online channels. Grocery anchored and necessity oriented neighborhood centers in stable trade areas have remained relatively resilient, as they provide food, pharmacy, and service offerings that are less easily displaced. Larger regional malls and fashion oriented centers face more pressure and may require repositioning or tenant mix changes.
For investors considering Indianapolis commercial assets, the mixed economic picture and changing tenant needs suggest a focus on properties tied to durable demand drivers, such as logistics facilities with strong tenant covenants, medical and education related buildings, and well located grocery anchored centers. Office investment requires careful scrutiny of tenant profiles, lease durations, and capital requirements for repositioning.
Section 11Transactions and Capital Markets
Transaction volume, pricing, and capital flows affect the opportunity set in Indianapolis. Detailed statistics on sales volume, average prices per square foot or per unit, and cap rates by property type are typically compiled by proprietary services and by brokerage research. County level deed and property records capture individual transactions, but there is no consolidated, machine readable city level dataset available in this environment that covers recent years.
Therefore, this review cannot present the total dollar volume of commercial real estate transactions in Indianapolis in 2025 or 2026, nor can it provide average cap rates by asset class. Anecdotally, Indianapolis has seen investment from local, regional, and national capital across multifamily, industrial, and selected office and retail sectors, attracted by higher income yields than in many coastal markets and by the stability associated with government, health care, logistics, and education anchors.
Higher interest rates in recent years have tightened financing conditions in Indianapolis as elsewhere. Debt service coverage constraints, loan to value ratios, and lender risk appetite have influenced pricing and transaction volume. Investors with lower leverage and longer hold horizons have often been better positioned to transact in this environment.
For accredited investors, these capital markets realities mean that pricing, leverage, and exit assumptions for Indianapolis assets must be built on up to date transaction and financing data secured from external sources. This review provides the macro and structural framing but does not replace that detailed work.
Section 12Taxes
The tax environment affects net yields for real estate investments in Indianapolis. Property taxes in Indiana are administered at the county level. In Marion County, where Indianapolis is located, properties are assessed by the county assessor and taxed based on assessed value and applicable tax rates for the city, county, school districts, and other taxing units. Indiana applies statutory limits on property tax bills as a percentage of gross assessed value, with different caps for homestead properties, other residential properties, and nonresidential properties. The Indiana Department of Local Government Finance and Marion County offices publish detailed rate tables and procedures, but these numeric values are not accessible through automated tools in this environment, so this review does not restate specific tax rates or caps.
Indiana also levies a state individual income tax and allows counties, including Marion County, to impose local income taxes. The state and local income tax rates and brackets are set forth by the Indiana Department of Revenue and county councils. Indiana has a state sales and use tax, and local option sales taxes apply to certain jurisdictions and uses.
For investors, property taxes in Marion County are a significant operating expense for residential and commercial properties. It is important to analyze current assessments, evaluate the potential impact of reassessment after acquisition or capital improvements, and understand how taxes flow through leases. Investors should also consider the impact of state and local income taxes on after tax returns, particularly for pass through entities.
Section 13Insurance
Insurance is a major operating cost and risk management tool for Indianapolis real estate. The Indiana Department of Insurance oversees property and casualty insurance markets in the state. Insurers price coverage based on exposure to perils such as wind, hail, tornadoes, thunderstorms, snow and ice, and in some areas flooding. Public data on average property insurance premiums by city or county are not available in a form that can be extracted in this environment, so this review cannot state numeric insurance costs for properties in Indianapolis.
Indianapolis is located in a region with occasional severe thunderstorms and tornadoes, significant winter weather events, and local flooding along rivers and low lying areas. These risks can influence insurance availability, coverage terms, deductibles, and premiums. Properties with older roofs, outdated systems, or prior loss histories may face higher premiums or more restrictive coverage, while assets with recent upgrades and risk mitigation features such as modern roofing, improved drainage, and fire protection can sometimes obtain more favorable terms.
For investors, effective risk management requires obtaining current quotes that reflect specific property characteristics, evaluating different deductible structures and coverage limits, and incorporating realistic assumptions about premium growth over time. Insurance expense should be stress tested in underwriting, especially for properties in locations more exposed to local flooding or severe weather.
Section 14Landlord Tenant and Regulatory Environment
Landlord tenant relationships in Indianapolis are governed primarily by Indiana state law, with additional ordinances and practices at the municipal level. Residential leases are subject to statutes addressing security deposits, habitability, repair obligations, and eviction procedures. Indiana does not have statewide rent control or rent stabilization, and rents are generally set by agreement between landlords and tenants, constrained by market forces and fair housing and anti discrimination laws.
Eviction processes in Indianapolis involve notices, filings in local courts, and possible hearings. Data on eviction filings and outcomes in Marion County exist, but there is no consolidated public dataset in this environment that can be used to derive current numeric eviction rates or average timelines. The absence of rent control and the relative efficiency of eviction processes compared with more heavily regulated jurisdictions are often cited by investors as reasons to view Indianapolis as a landlord friendly environment, while tenant advocates emphasize the need for strong compliance with housing quality and fair housing standards.
Commercial leases in Indianapolis are typically structured as triple net or modified gross, with clear allocations of responsibilities for taxes, insurance, and maintenance. Zoning, land use regulations, building codes, and licensing requirements vary across the city and can influence development feasibility and operating costs.
Investors should work with local counsel to understand the specific legal framework for leases, remedies, and compliance, and should take into account not only statutory rules but also local court practices and enforcement trends.
Section 15Infrastructure
Infrastructure in and around Indianapolis supports its role as a transportation and logistics hub and a regional administrative center. The city sits at the junction of several interstate highways, which facilitates truck based freight movement and regional commuting. Rail lines serve freight and some passenger demand, and Indianapolis International Airport provides passenger flights and significant air cargo capacity, including facilities that serve major logistics and electronic commerce firms.
Publicly reported data on traffic volumes, freight tonnage, and airport passenger and cargo levels exist but are not accessible in detail through the tools available in this environment, so this review cannot quote specific throughput numbers. Nonetheless, the presence of extensive highway, rail, and air infrastructure directly underpins demand for industrial and logistics real estate. Tenants in warehouses and distribution centers value access to regional and national routes, and logistics providers cluster around key interchanges and the airport.
Within the city, municipal infrastructure for water, wastewater, stormwater, and power supply is critical for residential and commercial operations. Investment in sewer and drainage systems is particularly important in older urban areas with combined sewer systems. For investors, the capacity and reliability of local infrastructure, as well as planned upgrades and potential assessments, should be part of due diligence.
Section 16Climate and Physical Risks
Indianapolis has a humid continental climate with warm summers, cold winters, and moderate precipitation spread throughout the year. National Oceanic and Atmospheric Administration climate records highlight exposure to thunderstorms, occasional tornadoes, snow and ice events, and heavy rainfall episodes. Extreme heat days in summer and severe cold snaps in winter can stress building systems, and severe storms can cause localized damage.
Federal Emergency Management Agency flood insurance rate maps identify special flood hazard areas along rivers and streams in and around Indianapolis. Properties located in these zones face increased risk of flooding and often require flood insurance when financed by regulated lenders. Federal Emergency Management Agency National Risk Index provides a composite view of hazard exposure for Marion County, including flood, tornado, wind, hail, and winter storm risks.
For investors, physical risk considerations should include the specific location of a property relative to mapped floodplains and drainage patterns, building elevation, construction type and age, roof condition, and the presence of mitigation measures such as sump pumps, improved drainage, and backup power. Climate related risks can influence operating costs, capital expenditure needs, and insurance availability and pricing.
Section 17Neighborhoods and Submarkets
Indianapolis consists of a variety of neighborhoods and submarkets with distinct characteristics that matter for investment performance. The downtown core includes office towers, government buildings, hotels, cultural institutions, and an increasing stock of multifamily residential properties. Demand here is driven by state government, corporate offices, legal and financial firms, sports and events, tourism, and proximity to restaurants and entertainment.
Neighborhoods immediately surrounding downtown include areas that have experienced significant reinvestment and redevelopment, with new apartments, townhomes, and mixed use projects. Other inner neighborhoods contain older housing stock and smaller multifamily buildings that serve workforce renters and long term residents. Conditions vary from block to block, with different levels of investment, homeownership, and income.
Suburban submarkets to the north, east, south, and west of the city include a wide range of single family subdivisions, shopping centers, and employment nodes. Some northern and western suburbs are associated with higher income levels, newer housing stock, and strong schools, and they tend to be favored by institutional multifamily and single family rental investors. Southern and eastern areas include a mix of older and newer developments with varied socio economic profiles.
Industrial and logistics submarkets are located around interstate junctions, near the airport, and in designated industrial parks. These areas host warehouses, distribution centers, manufacturing facilities, and related uses. Retail submarkets include regional malls and power centers along major arterials as well as neighborhood and community centers that serve surrounding residential neighborhoods.
Because this review cannot present numeric rents, vacancy, or pricing by neighborhood, investors must rely on local market research to differentiate between submarkets. Nonetheless, understanding the broad geography of employment and income in Indianapolis is essential. Downtown, the near downtown ring, certain suburban corridors, and industrial clusters near the airport are typically the most relevant focal points for institutional investment.
Section 18Opportunities
Indianapolis presents several real estate opportunities for accredited investors who seek income producing assets in a market with relatively low entry prices and diversified economic anchors. In multifamily, properties near downtown, major employment centers, universities, and hospitals can benefit from steady tenant demand, provided that product quality and amenities align with renter preferences. Suburban multifamily assets in stable school districts and near commuting routes can offer a combination of cash flow and potential appreciation.
Single family rental investment in Indianapolis and surrounding suburbs can capture households that value detached living and yard space but are not ready or able to own. The Indiana statewide median sale price of 280,055 dollars in May 2026, well below the national median, suggests that acquisition costs can be attractive relative to rents in many neighborhoods, creating room for positive cash flow with prudent leverage.
Industrial and logistics assets around interstate highways and the airport provide exposure to electronic commerce, manufacturing, and regional distribution. Well located modern facilities with creditworthy tenants and long term leases can deliver stable income streams and hold their value across cycles. Given the city central location and transportation infrastructure, industrial remains a key area of opportunity.
Retail opportunities are most compelling in grocery anchored and necessity oriented centers in established trade areas, where tenant sales are less sensitive to online substitution. Centers adjacent to stable residential neighborhoods and frequent use services such as food, health, and personal care can offer durable income with manageable capital requirements.
Section 19Risks
Investments in Indianapolis also come with risks that must be carefully weighed. At the macro level, Bureau of Labor Statistics data show that the Indianapolis Carmel Greenwood metropolitan area experienced negative twelve month job growth as of June 2026, with a preliminary decline of 1.3 percent in total nonfarm employment, and Indiana statewide had only a slight negative twelve month change. Continued job losses or stagnation could pressure space demand in office, industrial, and retail segments and limit rent growth in housing.
Sector specific trends pose additional risks. Declines in metropolitan manufacturing employment and in trade, transportation, and utilities jobs suggest that some segments tied to production and distribution are under pressure. Shifts in professional and business services, information, and financial activities can affect office demand. Leisure and hospitality softness may affect hotels, restaurants, and supporting retail.
Physical risks from severe weather and local flooding can translate into property damage, higher insurance costs, and business interruption. Properties with structural vulnerabilities or in higher risk locations are more exposed.
Information risk is another factor. Because this environment cannot provide current numeric data on rents, vacancy, or cap rates for Indianapolis, investors who rely solely on high level narratives risk misjudging pricing and performance. Access to accurate, up to date market statistics from external sources is essential.
Finally, properties in neighborhoods that are economically fragile or heavily dependent on a small number of employers may face heightened tenant credit risk and value volatility. Investors must avoid extrapolating performance in strong submarkets to the entire city.
Section 20Investor Implications
For accredited investors, Indianapolis offers a set of real estate opportunities that can complement portfolios focused on larger coastal or high growth markets. The metropolitan economy is diversified across government, health care, logistics, education, and professional services. Labor markets remain tight, with low unemployment, but job growth has been modest and in some sectors negative. On the housing side, Indiana statewide exhibits higher price growth than the national average, from a much lower median price base, with rising inventory and a declining share of above list sales, suggesting a market that is normalizing.
Within this context, investors can pursue income oriented strategies in multifamily, single family rental, industrial, and selected retail assets in Indianapolis. The relatively low cost of entry compared with national medians can support attractive going in yields, provided that assets are well located and well managed.
However, success requires detailed, data driven underwriting that goes beyond this macro level review. Key disciplines include obtaining current rent, vacancy, and cap rate data from reliable sources, conducting careful submarket and neighborhood assessments, evaluating physical and climate related risk, and structuring conservative financing. Investors should also consider exit liquidity and buyer pools for the type of assets they acquire, as this will influence long term returns.
Section 21Conclusion
Indianapolis stands as a central Midwestern market with a combination of government, health care, logistics, education, and professional services that support diverse real estate demand. Bureau of Labor Statistics data for the Indianapolis Carmel Greenwood metropolitan area show a large labor force, low unemployment rates, and modest net job losses over the twelve months to June 2026, while Indiana statewide exhibits similar patterns of tight labor markets and limited net job growth. Redfin Indiana statewide housing metrics reveal that home prices are rising faster than national averages from a much lower base, with inventory growing more quickly than in the country overall and buyer competition easing.
At the same time, this review has highlighted the limits of public data access for city level indicators in this environment. Current numeric figures for Indianapolis population, incomes, rents, vacancy, and cap rates cannot be extracted using the available tools and therefore are not presented. Investors must supplement this structural analysis with property specific and submarket specific data obtained directly from public and proprietary sources.
For accredited investors who approach Indianapolis with this level of rigor, the city offers the potential for attractive income focused investments with measured growth and risk profiles. Multifamily, single family rental, industrial, and selected retail and medical assets can fit within diversified portfolios that value current income and moderate appreciation rather than rapid speculative gains. The central tasks are disciplined selection, robust risk management, and a clear understanding of the interplay between local economic anchors, housing dynamics, and physical risk.
Sources
- U.S. Bureau of Labor Statistics, Indiana Economy at a Glance ,, https://www.bls.gov/eag/eag.in.htm
- U.S. Bureau of Labor Statistics, Indianapolis Carmel Greenwood Indiana Economy at a Glance ,, https://www.bls.gov/eag/eag.in_indianapolis_msa.htm
- U.S. Bureau of Labor Statistics, Local Area Unemployment Statistics ,, https://www.bls.gov/lau
- U.S. Bureau of Labor Statistics, Current Employment Statistics State and Area ,, https://www.bls.gov/sae
- Redfin, Indiana Housing Market House Prices and Trends ,, https://www.redfin.com/state/Indiana/housing-market
- Redfin, United States Housing Market and Prices ,, https://www.redfin.com/us-housing-market
- U.S. Census Bureau, Decennial Census of Population and Housing ,, https://www.census.gov/programs-surveys/decennial-census.html
- U.S. Census Bureau, Population and Housing Unit Estimates ,, https://www.census.gov/programs-surveys/popest.html
- U.S. Census Bureau, American Community Survey ,, https://www.census.gov/programs-surveys/acs
- U.S. Census Bureau, Building Permits Survey ,, https://www.census.gov/construction/bps
- U.S. Department of Housing and Urban Development, Fair Market Rents ,, https://www.huduser.gov/portal/datasets/fmr.html
- Bureau of Economic Analysis, State Personal Income ,, https://www.bea.gov/data/income-saving/personal-income-by-state
- Bureau of Economic Analysis, Gross Domestic Product by State and Metropolitan Area ,, https://www.bea.gov/data/gdp/gdp-state
- Indiana Housing and Community Development Authority, programs and overview ,, https://www.in.gov/ihcda/
- Indiana Department of Local Government Finance, property tax structure and rates ,, https://www.in.gov/dlgf/
- Indiana Department of Revenue, state and local tax information ,, https://www.in.gov/dor/
- Indiana Department of Insurance, property and casualty insurance information ,, https://www.in.gov/idoi/
- Federal Emergency Management Agency, Flood Map Service Center ,, https://msc.fema.gov
- Federal Emergency Management Agency, National Risk Index ,, https://hazards.fema.gov/nri
- National Oceanic and Atmospheric Administration, National Centers for Environmental Information ,, https://www.ncei.noaa.gov
- CoStar Group, commercial and multifamily real estate analytics ,, https://www.costar.com
- Yardi Matrix, multifamily market analytics ,, https://www.yardimatrix.com
- RealPage, multifamily analytics and market data ,, https://www.realpage.com/analytics