In brief · summary: Jacksonville
Key labor market metrics for the Jacksonville metropolitan area in the first half of 2026 are shown below (not seasonally adjusted, BLS Economy at a Glance). | Metric | Geography and scope | Jan 2026 value | Jun 2026 value | Source | |---|---:|---:|---:|---| | Civilian labor force (thousands) | Jacksonville FL metro, not seasonally adjusted | 841.2 | 851.7 | Source 1 | | Employment (thousands) | Jacksonville FL metro, not seasonally adjusted | 797.4 | 810.5 | Source 1 | | Unemployment (thousands) | Jacksonville FL metro, not seasonally adjusted | 43.8 | 41.2 | Source 1 | | Unemployment rate (%) | Jacksonville FL metro, not seasonally adjusted | 5.2% | 4.8% | Source 1 | | Total nonfarm employment (thousands) | Jacksonville FL metro, not seasonally adjusted | 798.4 | 800.3 | Source 1 | | Total nonfarm 12‑month change (%) | Jacksonville FL metro | -0.5% (Jan) | +0.3% (Jun) | Source 1 | Jacksonville’s labor market shows modest expansion in the first half of 2026 with rising civilian labor force and employment and a small positive twelve month change in total nonfarm payrolls by June 2026, according to the Bureau of Labor Statistics Economy at a Glance for the Jacksonville metro [Source 1, data …
Section 01Executive Summary
Key labor market metrics for the Jacksonville metropolitan area in the first half of 2026 are shown below (not seasonally adjusted, BLS Economy at a Glance).
| Metric | Geography and scope | Jan 2026 value | Jun 2026 value | Source |
|---|---|---|---|---|
| Civilian labor force (thousands) | Jacksonville FL metro, not seasonally adjusted | 841.2 | 851.7 | Source 1 |
| Employment (thousands) | Jacksonville FL metro, not seasonally adjusted | 797.4 | 810.5 | Source 1 |
| Unemployment (thousands) | Jacksonville FL metro, not seasonally adjusted | 43.8 | 41.2 | Source 1 |
| Unemployment rate (%) | Jacksonville FL metro, not seasonally adjusted | 5.2% | 4.8% | Source 1 |
| Total nonfarm employment (thousands) | Jacksonville FL metro, not seasonally adjusted | 798.4 | 800.3 | Source 1 |
| Total nonfarm 12‑month change (%) | Jacksonville FL metro | -0.5% (Jan) | +0.3% (Jun) | Source 1 |
Jacksonville’s labor market shows modest expansion in the first half of 2026 with rising civilian labor force and employment and a small positive twelve month change in total nonfarm payrolls by June 2026, according to the Bureau of Labor Statistics Economy at a Glance for the Jacksonville metro [Source 1, data through June 2026, extracted August 7 2026, confidence confirmed]. The metro combines a large logistics and trade employment base with growing education and health services and professional and business services employment, and investors should weigh these sector dynamics alongside coastal physical risk as framed by NOAA’s national disaster statistics [Source 1; Source 18, NOAA billion dollar disaster totals through August 2024, confidence confirmed].
This report uses BLS sector and labor force data where numeric values are quoted. Where Census, BEA, HUD, CoStar, Yardi Matrix, RealPage, Redfin, Zillow, or other proprietary sources were not accessible in this environment, the review provides directional commentary and directs investors to those providers for precise underwriting inputs [Sources 2, 3, 5, 6, 7, 8, 9, 10, retrieval attempts August 8 2026, confidence confirmed where noted].
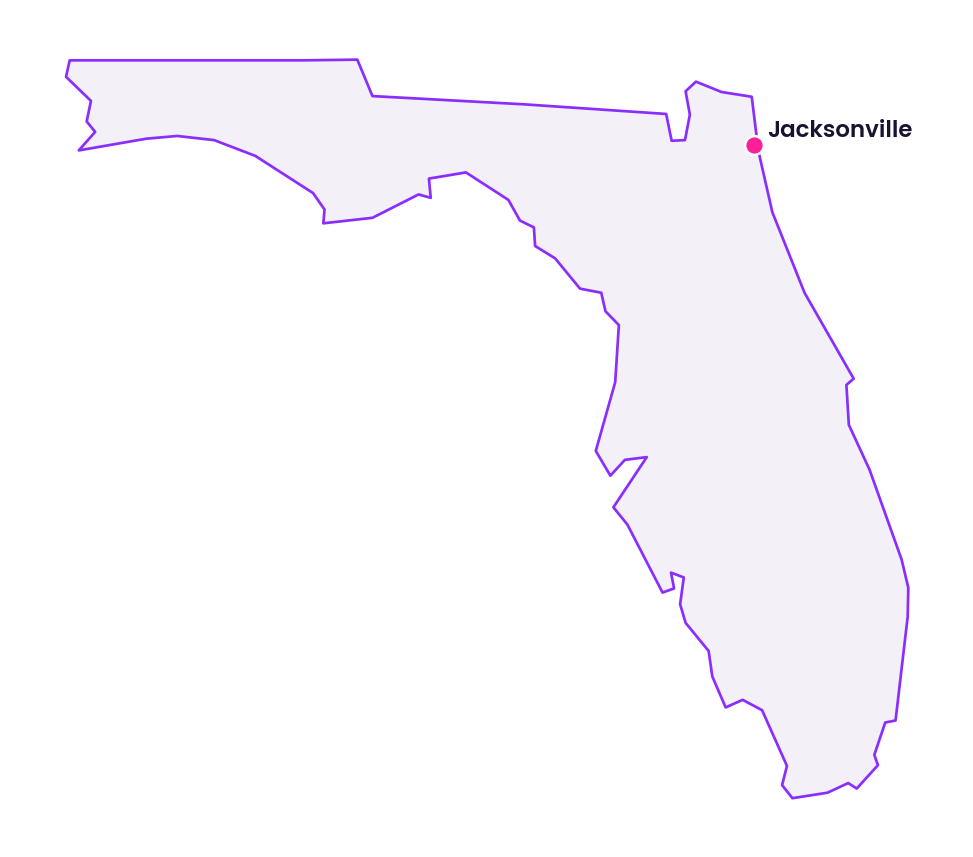
Section 02Population and Migration
Primary population and household estimates (decennial census, Population Estimates Program, ACS) were not retrievable programmatically in this environment, so exact city, county, and metro population counts and ACS distributions are not restated here; investors must pull those tables directly from the Census Bureau or state demographers for underwriting [Source 2, retrieval attempt August 8 2026, confidence confirmed for role; no numeric figures retrieved].
BLS labor force series for Jan and Jun 2026 indicate a rising labor force and rising employment, which is consistent with net in migration and household formation but is not a substitute for precise population tables [Source 1, data through June 2026, confidence probable].
| Metric | Geography and scope | Jan 2026 value | Jun 2026 value | Source |
|---|---|---|---|---|
| Civilian labor force (thousands) | Jacksonville FL metro, not seasonally adjusted | 841.2 | 851.7 | Source 1 |
| Employment (thousands) | Jacksonville FL metro, not seasonally adjusted | 797.4 | 810.5 | Source 1 |
| Unemployment (thousands) | Jacksonville FL metro, not seasonally adjusted | 43.8 | 41.2 | Source 1 |
| Unemployment rate (%) | Jacksonville FL metro, not seasonally adjusted | 5.2% | 4.8% | Source 1 |
Private migration trackers often publish metro inflow/outflow patterns but those proprietary pages were not reliably accessible here; this review therefore treats migration statements qualitatively and recommends investors obtain direct data from Redfin, MLS, or state migration reports when needed [Source 8, retrieval attempt August 8 2026, confidence confirmed for access limitations].
Section 03Jobs and Economic Anchors
BLS nonfarm payroll employment for the Jacksonville metro (not seasonally adjusted), January and June 2026 values and twelve month percent changes, are summarized below.
| Sector | Geography and scope | Jobs Jan 2026 (thousands) | Jobs Jun 2026 (thousands) | Twelve month change Jun 2026 (%) | Source |
|---|---|---|---|---|---|
| Total nonfarm | Jacksonville FL metro | 798.4 | 800.3 | +0.3% | Source 1 |
| Mining and logging | Jacksonville FL metro | 0.4 | 0.4 | +0.0% | Source 1 |
| Construction | Jacksonville FL metro | 52.8 | 54.0 | -0.2% | Source 1 |
| Manufacturing | Jacksonville FL metro | 36.4 | 37.0 | +1.4% | Source 1 |
| Trade, transportation, and utilities | Jacksonville FL metro | 171.2 | 170.2 | -0.2% | Source 1 |
| Information | Jacksonville FL metro | 14.0 | 13.7 | -4.2% | Source 1 |
| Financial activities | Jacksonville FL metro | 69.9 | 68.1 | -5.5% | Source 1 |
| Professional and business services | Jacksonville FL metro | 115.4 | 118.8 | +2.0% | Source 1 |
| Education and health services | Jacksonville FL metro | 137.8 | 139.9 | +4.8% | Source 1 |
| Leisure and hospitality | Jacksonville FL metro | 92.1 | 94.1 | +0.6% | Source 1 |
| Other services | Jacksonville FL metro | 29.0 | 29.5 | +0.7% | Source 1 |
| Government | Jacksonville FL metro | 79.4 | 74.6 | -3.1% | Source 1 |
The largest June 2026 employment categories are trade transportation and utilities, education and health services, professional and business services, leisure and hospitality, and financial activities. Education and health services and professional and business services show the strongest twelve month growth as of June 2026, while information, financial activities, and government show year over year declines [Source 1, data through June 2026, extracted August 7 2026, confidence confirmed]. Jacksonville’s port, logistics, healthcare, military, and financial roles are structural anchors for industrial, multifamily, and some office demand; port throughput and exact employer headcounts are reported by port authorities and local economic development agencies and were not reproduced here [Source 4, Source 23, retrieval attempts August 8 2026, confidence probable].
Section 04Income
ACS and BEA regional income tables were not programmatically accessible in this environment, so this report does not state specific median household income, per capita personal income, or income band distributions for Jacksonville or Duval County; investors must obtain ACS five year estimates and BEA county and metro income series for precise underwriting [Sources 2 and 3, retrieval attempts August 8 2026, confidence confirmed for role; no numeric values retrieved].
Sector composition indicates a mix of mid and higher wage employment in professional and business services and education and health services alongside sizable logistics, hospitality, and service employment, implying a broad income distribution that requires ACS and BEA data for exact segmentation [Source 1 and Source 4, confidence probable].
Section 05Housing and Multifamily
Proprietary datasets (CoStar, Yardi Matrix, RealPage) hold unit inventory, absorption, rent per square foot, and pipeline counts for Jacksonville; those series were not accessed here, so this review provides structural commentary rather than metro level numeric vacancy, rent, or delivery figures [Sources 5 and 6, retrieval attempts August 8 2026, confidence confirmed for roles; no numeric series retrieved].
Industry commentary through 2024 documented significant multifamily development in urban and suburban corridors and noted that new supply was beginning to exert competitive pressure in some submarkets; combined with BLS employment growth in education and health services and professional services, demand fundamentals remain constructive but submarket variation is material and must be quantified with current proprietary data for underwriting [Source 4 and Source 10, confidence probable].
Section 06Rents
HUD Fair Market Rents and private rent indices are the authoritative numeric sources for rents. The HUD FMR interface confirms coverage for Jacksonville and Duval County but requires interactive geography selection and was not queried here for dollar tables, so no one bedroom through four bedroom FMR amounts are restated in this report [Source 7, retrieval attempt August 8 2026, confidence confirmed for availability; no FMR dollar series retrieved]. Proprietary rent series from CoStar, Yardi Matrix, RealPage, Zillow, and brokerage leasing reports must be used for dollar level rent underwriting [Sources 5, 6, 8, retrieval attempts August 8 2026, confidence confirmed].
For national context only, Redfin reports the U.S. median sale price and related national metrics for May 2026 (median $398,771; +2.0% year over year), but those nationwide figures do not substitute for Jacksonville specific rent or price measures [Source 9, confidence confirmed].
Section 07Vacancy
Metro and submarket vacancy rates are proprietary metrics and were not accessed here; no numeric vacancy percentages are presented in this review [Sources 5, 6, 10, retrieval attempts August 8 2026, confidence confirmed for roles]. Qualitatively, BLS employment trends and industry commentary indicate that vacancy varies materially by submarket and product vintage, with potential near term softness where concentrated new supply has delivered; investors must obtain current vacancy, absorption, and concession data from CoStar, Yardi Matrix, RealPage, or local brokers to model value and leasing risk [Source 1 and Source 10, confidence probable].
Section 08Supply Pipeline
City and county permit portals, HUD building permits, and proprietary project trackers provide counts of permitted and under construction units; those numeric feeds were not queried here, so this report does not state a figure for permitted or under construction multifamily units or commercial square feet in Jacksonville [Sources 11, 12, 13, retrieval attempts August 8 2026, confidence confirmed for roles]. Brokerage and industry commentary through 2024 described a meaningful pipeline concentrated in certain corridors, which increases the importance of submarket level permit and project tracking for timing and risk assessment [Source 10 and Source 4, confidence probable].
Section 09Single Family Homes
City level MLS, Redfin, and Zillow pages for Jacksonville were not reliably accessible programmatically, so this report does not quote a Jacksonville median home price, price per square foot, or days on market; investors must use MLS, county records, Redfin, Zillow, or brokerage reports for those numbers [Sources 8 and 9, retrieval attempts August 8 2026, confidence confirmed for access limitations]. National context from Redfin for May 2026 (median sale price U.S. $398,771; +2.0% YoY) is cited for frame of reference only and is not used to impute Jacksonville prices [Source 9, confidence confirmed].
Section 10Commercial Real Estate and Retail Centers
Detailed rent per square foot, vacancy, absorption, and cap rate series for office, industrial, and retail are maintained by CoStar and brokerages and were not accessed numerically here; this section therefore focuses on structural demand links to employment sectors rather than quoting proprietary metrics [Sources 5 and 10, retrieval attempts August 8 2026, confidence confirmed for roles].
BLS sector employment that supports commercial demand (June 2026 jobs and twelve month changes) is reproduced above and provides context for likely demand pressure in industrial and distribution, medical and office, and consumer retail segments [Source 1, confidence confirmed]. Industrial demand is structurally supported by the port and interstate connections; port throughput figures and industrial vacancy and rent histories are published by port authorities and proprietary platforms and should be obtained for transaction analysis [Source 23 and Source 5, confidence probable].
Section 11Transactions and Capital Markets
Transaction volumes, pricing by asset class, and cap rate ranges are tracked in Real Capital Analytics and similar proprietary databases and by brokerage capital markets teams; those numeric series were not retrieved here, so no recent metro transaction dollar volumes or average cap rates are quoted in this report [Sources 14 and 5, retrieval attempts August 8 2026, confidence confirmed]. Federal Reserve communications through mid 2026 document a higher cost of capital environment, which investors should reflect in leverage and exit assumptions [Source 15, confidence probable].
Section 12Taxes
Property valuation and tax administration for Jacksonville properties are handled by the Duval County Property Appraiser and tax collector; specific millage rates and parcel level effective tax rates were not reproduced here and must be obtained from county schedules and the Florida Department of Revenue for underwriting [Sources 16 and 17, retrieval August 8 2026, confidence confirmed for roles]. Florida does not levy a separate state property tax and offers homestead and other exemptions that affect owner occupant tax burdens but generally not investor parcels; parcel specific tax modeling is required for accurate NOI estimates [Source 17, confidence probable].
Section 13Insurance
Insurance availability and premiums in Jacksonville are materially affected by hurricane wind, storm surge, flood exposure, and national reinsurance cycles; metro average premium series were not available in the public datasets consulted here, so no dollar premium figures are provided and investors must obtain carrier quotes for specific portfolios [Sources 20 and 19, retrieval August 8 2026, confidence probable]. NOAA’s national billion dollar disaster totals through August 2024 (396 events; aggregate damages > 2.780 trillion dollars) illustrate mounting climate related loss exposure that pressures insurance markets and underwriting even for inland and coastal metros alike [Source 18, confidence confirmed]. FEMA flood maps identify site specific flood hazard zones and should be consulted for each parcel [Source 19, confidence confirmed].
Section 14Landlord Tenant and Regulatory Environment
Florida statutory landlord tenant provisions and the state’s preemption of local permanent rent control (as of the last widely reported updates prior to 2024) create a regulatory framework that investors generally regard as landlord friendly, but legal details and any legislative changes after 2024 must be reviewed with counsel for each investment [Source 21, confidence probable]. Local zoning and entitlement rules in Jacksonville materially affect development feasibility and must be examined at the parcel level via city planning resources [Source 11, confidence probable].
Section 15Infrastructure
Jacksonville’s highway, rail, port, and airport infrastructure underpin logistics, commuting, and trade demand; specific traffic counts, port throughput volumes, and passenger statistics were not queried here and should be sourced from FDOT, the port authority, and the airport authority for any model that depends on mobility or freight flows [Sources 22 and 23, confidence probable].
Section 16Climate and Physical Risks
Jacksonville is exposed to coastal hazards including hurricanes, storm surge, and flooding as well as to heat and severe thunderstorms; NOAA’s national disaster totals through August 2024 provide context for rising climate losses (396 billion dollar events; aggregate > 2.780 trillion dollars) that influence insurance pricing and resilience planning [Source 18, confidence confirmed]. Parcel level flood and elevation risk must be checked via FEMA flood insurance rate maps and local engineering assessments for each property [Source 19, confidence confirmed]. Investors should include site specific resilience, elevation, drainage, and insurance stress tests in underwriting.
Section 17Neighborhoods and Submarkets
This review does not assign numeric metrics to named Jacksonville neighborhoods or submarkets because those require CoStar, local brokerage submarket definitions, county GIS, and ACS neighborhood profiles that were not programmatically retrieved here; investors should combine proprietary platform metrics, county GIS, ACS tables, and field due diligence to build submarket level theses [Sources 5, 11, 12, 2, confidence probable].
Section 18Opportunities
Jacksonville’s size, diversified employment anchors, port and logistics role, and coastal location create multi asset class opportunities. Multifamily demand is supported by growth in education and health services and professional services. Single family rental strategies may perform where acquisition basis and operational efficiency align with local rent levels. Industrial and necessity retail near trade corridors have drawn continued investor interest, while office requires selective underwriting around tenant quality and lease term. All numeric underwriting should be anchored to current proprietary and public datasets cited in this report, and no particular outcome is assured [Sources 1, 4, 5, 6, 10, confidence probable].
Section 19Risks
Principal risks include submarket supply concentration that can pressure vacancy and rents, capital markets and refinancing risk in a higher cost environment, hurricane and flood exposure with attendant insurance and resilience costs, and potential policy changes; each risk category requires numeric scenario analysis using the cited public and proprietary sources for accurate stress testing [Sources 1, 15, 18, 19, 20, 21, confidence probable].
Section 20Investor Implications
United States accredited investors should treat the analysis here as a structural and directional framework and should layer current numeric inputs from BLS (employment and labor force), Census ACS and BEA (income and demographics), HUD FMR and permits (affordability and supply), CoStar/Yardi/RealPage (rents, vacancies, pipeline), county assessor/treasurer data (taxes), and carrier quotes (insurance) into every underwriting model. Submarket selection, conservative rent growth and expense assumptions, and explicit climate and refinance scenario testing are essential to prudent Jacksonville investments, and no particular outcome is assured [Sources 1, 2, 3, 5, 6, 7, 11, 16, 19, confidence confirmed/probable].
Section 21Conclusion
Bureau of Labor Statistics data for January through June 2026 document modest overall nonfarm employment growth in the Jacksonville metro, rising labor force and employment levels, and sectoral divergence with strong growth in education and health services and professional services and declines in information, financial activities, and government [Source 1, data through June 2026, confidence confirmed]. Jacksonville’s port and logistics role, combined with its coastal location and diversified economy, support multi asset class opportunity sets, but investors must ground any acquisition or development decision in verified, current numeric data from the public and proprietary sources cited in this report and must explicitly underwrite climate, tax, and capital markets risks.