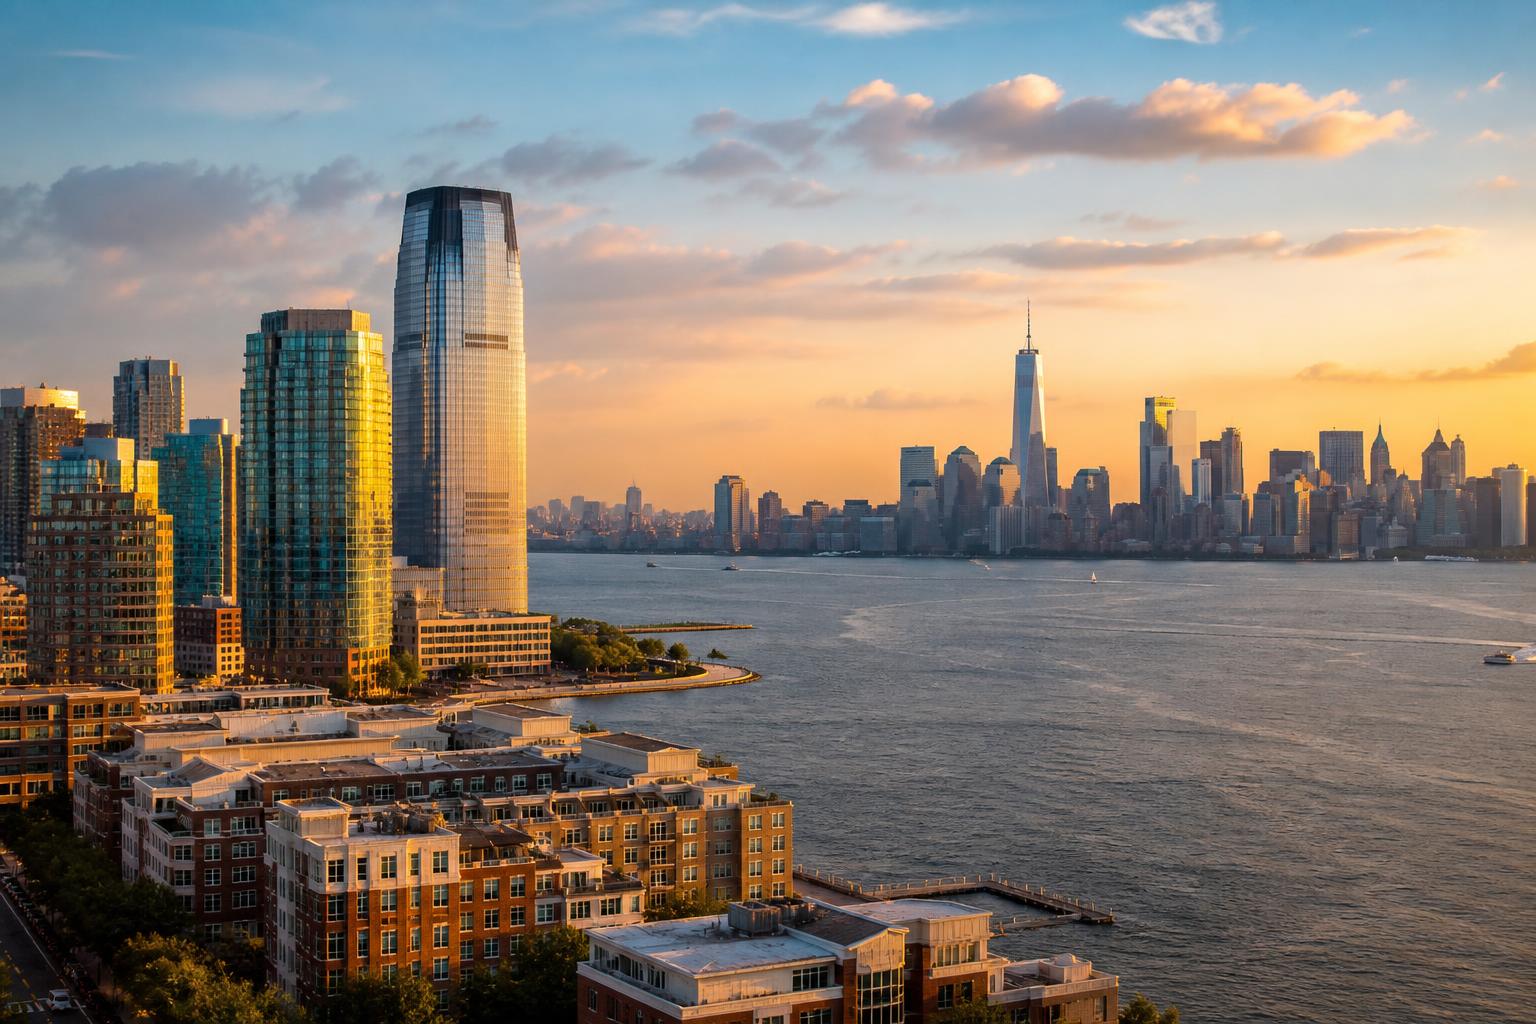
In brief · summary: Jersey City
Jersey City's population reached approximately 302,013 in the Census Bureau's Vintage 2025 city population estimate released in May 2026, up about 3.2 percent from the April 2020 Census count. The city sits inside Hudson County, which the Census Bureau put at roughly 735,033 residents in the same release, and inside the New York, Newark, Jersey City metropolitan area, which added more numeric population than any other metro in the country between 2023 and 2024 according to Census Bureau reporting from March 2025.
Jersey City's economy is built around a financial services cluster often called Wall Street West, anchored by JPMorgan Chase, Goldman Sachs, Citigroup, and other banks and fintech firms whose Hudson Waterfront back office, technology, and trading operations are estimated to represent roughly one third of the city's private sector jobs according to a Hudson County economic development profile published in May 2026.
The apartment market is unusually tight by national standards, with PwC and the Urban Land Institute reporting citywide multifamily vacancy of just 2.8 percent in the second quarter of 2025, even after roughly 20 percent inventory growth over the prior five years. That tightness is about to be tested by the largest construction wave the city has seen in a decade, with CoStar reporting more than 6,600 units under construction on the Jersey City waterfront alone in May 2026, representing about 28 percent of existing inventory in that submarket, the highest construction to inventory ratio of any tracked apartment submarket in the New York region.
Section 01Executive Summary
Jersey City is New Jersey's second largest city and the state's most prominent example of transit oriented, high density urban redevelopment. The Census Bureau's Vintage 2025 city population estimate, released in May 2026, put Jersey City's population at approximately 302,013, up about 3.2 percent from the April 2020 Census baseline of 292,449. Hudson County, the surrounding county, held roughly 735,033 residents in the same release. The broader New York, Newark, Jersey City metropolitan area added 213,403 residents between 2023 and 2024, the largest numeric gain of any metropolitan area in the country, according to Census Bureau reporting published in March 2025, with the gain driven mainly by international migration offsetting continued domestic out migration from the core counties, including Hudson County.
The city's economy centers on a dense financial services and fintech cluster, sometimes called Wall Street West, that occupies much of the Hudson Waterfront office corridor. JPMorgan Chase reports more than 4,000 employees in Jersey City, Goldman Sachs operates a large campus at 30 Hudson Street, and Citigroup, BNY Mellon, DTCC, UBS, Fidelity, and Broadridge round out a cluster that a Hudson County economic development profile published in May 2026 estimated at roughly one third of the city's private sector employment. The New York, Newark, Jersey City metropolitan statistical area recorded a 4.3 percent unemployment rate, not seasonally adjusted, in preliminary July 2026 data from the Bureau of Labor Statistics.
Jersey City's residential market is a study in contrasts. RentCafe, drawing on Yardi Matrix data published in November 2025, put the average asking apartment rent at $3,786 per month, up 1.87 percent year over year, while PwC and the Urban Land Institute reported citywide multifamily vacancy of just 2.8 percent for the second quarter of 2025. That tightness sits alongside the largest development pipeline the city has seen in years: CoStar reported in May 2026 that more than 6,600 units were under construction on the waterfront alone, about 28 percent of existing waterfront inventory, with several thousand more underway around the Journal Square transit hub. Meanwhile the office market tells a different story. Cushman and Wakefield reported Hudson Waterfront office vacancy of 28.9 percent in the fourth quarter of 2025, still elevated even after three consecutive quarters of positive absorption. Single family and condominium prices, dominated by 1 to 4 family homes and condos rather than detached houses, have softened modestly on a citywide basis even as select submarkets like Journal Square post sharp gains.
The investment case for Jersey City rests on durable transit access, a deep and diversified financial and healthcare employment base, and a residential market that has historically absorbed new supply quickly, weighed against a large incoming apartment delivery wave, a persistently soft office sector, one of the state's more restrictive rent control ordinances, elevated property taxes, rising insurance costs, and a genuine flood risk exposure that the city itself is actively planning around.
Section 02Population and Migration
Jersey City's population has grown steadily but modestly in the years since the 2020 Census. The Census Bureau's Vintage 2025 City and Town Population Estimates, released in May 2026, placed Jersey City's population at approximately 302,013 as of July 1, 2025, an increase of about 9,271 residents, or 3.2 percent, from the April 2020 Census count of 292,449, and up roughly 0.4 percent from the prior year's vintage estimate of 302,824 reported by the New Jersey Department of Labor's Hudson County Brief, updated January 2026. Hudson County as a whole held approximately 735,033 residents as of July 1, 2025, per the same Census Bureau Vintage 2025 release, up modestly from the 2020 Census count of 724,854.
| Geography | Population | Scope and source |
|---|---|---|
| Jersey City | ~302,013 | July 2025 estimate, Census Bureau Vintage 2025, May 2026 |
| Jersey City, 2020 Census | 292,449 | April 2020, Census Bureau |
| Hudson County | ~735,033 | July 2025 estimate, Census Bureau Vintage 2025 |
| New York, Newark, Jersey City metro, change | +213,403 | 2023 to 2024, Census Bureau, March 2025 |
The composition of that growth is the important detail for an investor. Census Bureau components of change data for Hudson County, covering 2023 to 2024, showed net domestic migration of negative 12,735, meaning more residents left Hudson County for other parts of the United States than arrived from them, while international migration added a positive 23,357, and natural increase, meaning births minus deaths, contributed a further 4,317, for total net migration of positive 10,622. Over the cumulative 2021 to 2025 period, the county recorded negative 71,743 in domestic migration against positive 62,795 in international migration and positive 23,918 in natural increase, according to Census Bureau Population Estimates Program data published in March 2026. In short, Hudson County and by extension Jersey City continue to lose residents to other parts of the country even as international arrivals and births more than offset that loss. At the metropolitan scale, the New York, Newark, Jersey City area added 213,403 residents between 2023 and 2024, the largest numeric gain of any metro area in the nation that year, according to a Census Bureau release dated March 13, 2025, driven by the same pattern of reduced domestic out migration and stronger international arrivals following the pandemic era decline.
The investor takeaway is that Jersey City's population is growing, but the growth is entirely dependent on international migration offsetting a persistent net outflow of residents to other parts of the country, which makes the city's demand base more sensitive to federal immigration policy than a market with organic domestic in migration.
Section 03Jobs and Economic Anchors
Jersey City's economy is unusually concentrated in financial services relative to most American cities of its size, a legacy of the Hudson Waterfront's development as an overflow campus for Wall Street firms seeking lower cost, PATH accessible office space just across the river from Lower Manhattan. JPMorgan Chase reports more than 4,000 employees at its Jersey City operations, technology, and securities services campus, according to the company's own careers materials updated in September 2024. Goldman Sachs operates from 30 Hudson Street, and Citigroup maintains banking, operations, and technology functions on the waterfront, according to Hudson County economic development materials published in May 2026. BNY Mellon, DTCC, UBS, Fidelity, and Broadridge round out a financial and fintech cluster that the same Hudson County profile estimated at roughly one third of the city's private sector jobs, a concentration commonly referred to as Wall Street West.
Healthcare and public sector employment provide diversification. Jersey City Medical Center, a regional hospital and Level II trauma and teaching facility operated through RWJBarnabas Health, anchors a significant healthcare employment base downtown, while Jersey City municipal government, Jersey City Public Schools, New Jersey City University, Hudson County government, and the United States Postal Service round out the non financial employment base, according to a Hudson County Economic Development Corporation major employers report updated September 2026.
| Indicator | Value | Scope and source |
|---|---|---|
| New York, Newark, Jersey City MSA unemployment | 4.3% | July 2026 preliminary, not seasonally adjusted, BLS Economy at a Glance |
| New York, Newark, Jersey City MSA unemployment, seasonally adjusted | 4.4% | July 2026, BLS/FRED |
| Newark, NJ metropolitan division unemployment | 4.6% | June 2026 preliminary, BLS Economy at a Glance |
| JPMorgan Chase Jersey City employment | 4,000+ | JPMorgan Chase careers materials, September 2024 |
The New York, Newark, Jersey City metropolitan statistical area recorded an unemployment rate of 4.3 percent, not seasonally adjusted, in preliminary July 2026 data from the Bureau of Labor Statistics Economy at a Glance series, extracted September 4, 2026, with a seasonally adjusted reading of 4.4 percent for the same month reported through the BLS and Federal Reserve Bank of St. Louis FRED series. The narrower Newark, New Jersey metropolitan division, which is often used as a Hudson County proxy, showed 4.6 percent unemployment in preliminary June 2026 data. For an investor, the employment picture is one of a deep, high wage, if somewhat narrowly concentrated, financial services base, supplemented by healthcare and public sector employment, with unemployment running modestly above the national rate but consistent with a still functioning regional labor market.
Section 04Income
Jersey City households earn well above the national median, a reflection of the concentration of financial services and professional jobs in the local economy. The Census Bureau's 2020 to 2024 American Community Survey five year estimate, released in December 2025, put Jersey City's median household income at $97,710 in 2024 inflation adjusted dollars. Hudson County's median household income, drawn from the Census Bureau's 2024 American Community Survey one year estimate released September 11, 2025 and reproduced in a New Jersey Department of Labor Hudson County report, was $96,041, close to but slightly below the city figure.
| Geography | Median household income | Scope and source |
|---|---|---|
| Jersey City | $97,710 | 2020-2024 ACS five year estimate, Census Bureau, released December 2025 |
| Hudson County | $96,041 | 2024 ACS one year estimate, Census Bureau, released September 2025 |
The investment implication of this relatively high income base is twofold. On one hand, incomes well above the national median support the rent levels documented later in this review, and the concentration of professional and financial services jobs gives Jersey City renters a genuine ability to absorb rents that would strain a lower income market. On the other hand, those same relatively high income households are also carrying the elevated property tax and insurance costs discussed below, and rent control coverage on much of the older apartment stock caps how quickly landlords can convert income growth into rent growth on covered units, which is an important structural constraint discussed further in the landlord tenant section.
Section 05Housing and Multifamily
Jersey City's apartment market has been exceptionally tight relative to the rest of the country, though that tightness is now facing its most significant test in years. PwC and the Urban Land Institute, in the Jersey City chapter of their Emerging Trends in Real Estate research published October 2, 2025, reported citywide multifamily vacancy of just 2.8 percent for the second quarter of 2025, notable because it held at that level even after approximately 20 percent growth in apartment inventory over the preceding five years. RentCafe, citing Yardi Matrix data in a report published November 18, 2025 and updated November 21, 2025, put the average Jersey City asking rent at $3,786 per month, up 1.87 percent year over year, across an average unit size of 798 square feet.
A broader Northern New Jersey benchmark, covering a six county area and therefore not Jersey City specific, showed a somewhat looser 4.7 percent vacancy rate in March 2025 with an effective rent of $2,520 per month, according to an Institutional Property Advisors Northern New Jersey Multifamily Market Report published in 2025. Statewide, the Census Bureau's Housing Vacancy Survey put the New Jersey rental vacancy rate at 4.9 percent for 2025, according to Federal Reserve Bank of St. Louis FRED data updated March 24, 2026. Both of these broader benchmarks run looser than the Jersey City specific 2.8 percent figure, underscoring how tight the core city submarket has been relative to its surrounding region.
| Series and scope | Level or reading | Change | Period and source |
|---|---|---|---|
| Jersey City average asking rent | $3,786/mo | +1.87% YoY | November 2025, RentCafe/Yardi Matrix |
| Jersey City citywide multifamily vacancy | 2.8% | not stated | Q2 2025, PwC/ULI Emerging Trends |
| Northern New Jersey effective rent (6 county) | $2,520/mo | not stated | March 2025, Institutional Property Advisors |
| Northern New Jersey vacancy (6 county) | 4.7% | not stated | March 2025, Institutional Property Advisors |
| New Jersey statewide rental vacancy | 4.9% | not stated | 2025 annual, Census Bureau via FRED |
The core takeaway is that Jersey City proper has run substantially tighter than its own surrounding region and the state as a whole, a function of the city's concentrated transit access and job base. That tightness, however, is precisely why the construction pipeline detailed later in this review, which is delivering thousands of new units concentrated on the waterfront and around Journal Square, is the single most important variable for the multifamily outlook over the next two to three years.
Section 06Rents
Jersey City rents rank among the highest in New Jersey and carry a meaningful premium to most of the state, reflecting direct PATH access to Manhattan. RentCafe's November 2025 report, drawing on Yardi Matrix data, broke out average asking rents by unit type: studios averaged $2,869 per month across 511 square feet, one bedrooms averaged $3,463 per month across 708 square feet, two bedrooms averaged $4,649 per month across 1,049 square feet, and three bedrooms averaged $5,822 per month across 1,353 square feet.
| Unit type | Average rent | Average size |
|---|---|---|
| Studio | $2,869/mo | 511 sf |
| One bedroom | $3,463/mo | 708 sf |
| Two bedroom | $4,649/mo | 1,049 sf |
| Three bedroom | $5,822/mo | 1,353 sf |
Rents vary sharply by submarket. RentCafe's mid 2025 neighborhood data showed Paulus Hook averaging about $4,304 per month, Downtown Jersey City averaging about $4,201 per month, and Newport averaging about $4,137 per month, all premium waterfront submarkets with direct PATH access. Journal Square, the city's fastest growing transit oriented development node, averaged a comparatively affordable $2,834 per month in the same period, while Communipaw and Lafayette in Bergen-Lafayette averaged roughly $2,871 to $2,942 per month, and South Greenville, the city's most affordable submarket, averaged roughly $1,787 to $1,829 per month. This roughly two and a half times spread between the highest and lowest priced submarkets is unusually wide for a city of Jersey City's compact geography and reflects the degree to which proximity to PATH stations and the waterfront commands a premium.
Because a large share of Jersey City's older rental stock is covered by the city's rent control ordinance, discussed in detail in the landlord tenant section, actual achievable rent growth on covered units is capped at the lesser of 4 percent or the change in the regional Consumer Price Index, which means the RentCafe averages above, which capture asking rents across both covered and uncovered stock, understate how constrained rent growth can be on the city's older, rent controlled apartment buildings relative to newer, exempt construction.
Section 07Vacancy
Vacancy readings diverge sharply between Jersey City's residential and commercial sectors, and that divergence is the central fact of the current cycle. On the residential side, PwC and the Urban Land Institute's Emerging Trends research reported citywide multifamily vacancy of just 2.8 percent for the second quarter of 2025, an exceptionally tight reading that held even as the market absorbed approximately 20 percent inventory growth over the prior five years. That tightness, however, predates the bulk of the current construction wave: an Institutional Property Advisors forecast published February 5, 2026 projected more than 4,000 new unit deliveries in Jersey City during 2026 alone, a volume large enough to place real upward pressure on vacancy and downward pressure on concessions as it comes online.
On the commercial side, the office market remains substantially looser. Cushman and Wakefield's New Jersey Office MarketBeat for the fourth quarter of 2025, published February 2026, reported Hudson Waterfront office vacancy of 28.9 percent, an improvement from 29.8 percent in the third quarter of 2025 and from 34.1 percent as recently as the first quarter of 2025, but still very elevated by historical standards. A separate measure from the PwC and Urban Land Institute Jersey City research, using a different building set and methodology, put waterfront office vacancy somewhat lower at 24.6 percent as of October 2025. Both readings describe the same underlying condition: a waterfront office market recovering gradually from a deep vacancy overhang built up over the prior several years, with vacancy still roughly triple the tight residential reading in the same submarket.
Section 08Supply Pipeline
The forward multifamily supply pipeline is the single largest swing factor for Jersey City's residential market over the next several years. CoStar, in a report published May 28, 2026, found that the Jersey City waterfront had more than 6,600 units under construction, representing about 28 percent of existing inventory in that submarket, the largest construction to inventory ratio of any of the 52 apartment submarkets CoStar tracks across the New York region. The Journal Square submarket carried an additional roughly 3,800 units underway as of the same report, on top of more than 7,600 units already delivered there since early 2021, meaning the combined waterfront and Journal Square pipeline exceeds 10,000 units.
| Project | Units | Location and status |
|---|---|---|
| One Journal Square | 1,723 | Journal Square, two towers, openings targeted mid-2025 and mid-2026 |
| Journal Squared (three towers) | 1,840 | Journal Square, third tower ~600 units, completed around 2025-2026 |
| 55 Hudson Street | 1,017 | Waterfront, under construction, opening expected late 2026 to early 2027 |
| 50 Hudson Street | ~924 | Waterfront, second phase, completion projected 2028 |
| Harborside 4 | 800 (600 rental, 200 condo) | Waterfront, construction begins Q1 2026, completion targeted Q1 2029 |
| 201 Hudson (by Urby) | 748 | Harborside/Downtown waterfront, under construction |
| The Greyson, 25 Cottage Street | 622 | Journal Square, leasing began February 2026 |
| 505 Summit | 605 | Journal Square, 54 stories, topped out May 2025, opening spring 2026 |
| 626 Newark Avenue | 576 | Journal Square, under construction |
| Imperial Tower, 296 JFK Boulevard | 542 rentals + 154 hotel rooms | Journal Square, $220 million construction financing, completion expected 2028 |
| Harborside 8/9 | ~1,000 planned | Waterfront, site acquired for $75 million December 2025 |
This is a genuinely large pipeline relative to the size of Jersey City's existing apartment stock, and it is the direct explanation for why the current 2.8 percent citywide vacancy reading should be read as a cyclical low point rather than a durable steady state. As these projects deliver through 2026, 2027, and into 2028, vacancy is highly likely to rise and asking rent growth, currently modest at 1.87 percent year over year, is likely to slow further or reverse in the most supply heavy pockets of the waterfront and Journal Square, even as citywide demand, discussed in the population section, continues to grow.
Section 09Single Family Homes
Jersey City's for sale housing stock is dominated by condominiums and one to four family properties rather than detached single family homes, and neither Zillow nor Redfin currently publish reliable, separately labeled single family versus condominium breakouts for the city, so the figures below describe all residential property types combined. Redfin's Jersey City Housing Market page, updated September 5, 2026, reported a median sale price of $734,632 for the three months ending July 2026, down 2.2 percent year over year, with a median price per square foot of $584, up 11.1 percent year over year, an average of 41 days on market, and an average of 2 offers per home. Zillow's Jersey City Home Values page, updated September 2026, reported a Zillow Home Value Index, its measure of typical home value, of $670,166 through July 31, 2026, down 0.9 percent year over year, alongside a median sale price of $702,500, a median list price of $691,167, and a median of 32 days to pending.
| Metric and scope | Value | Change | Period and source |
|---|---|---|---|
| Median sale price, citywide, all types | $734,632 | -2.2% YoY | 3 months ending July 2026, Redfin |
| Median price per square foot, citywide | $584/sf | +11.1% YoY | 3 months ending July 2026, Redfin |
| Days on market, citywide | 41 days | vs. 43 days prior year | 3 months ending July 2026, Redfin |
| Zillow Home Value Index, citywide | $670,166 | -0.9% YoY | Through July 31, 2026, Zillow |
| Downtown Jersey City median sale price | $989,662 | +4.6% YoY | July 2026, Redfin |
| Journal Square median sale price | $598,796 | +23.5% YoY | 3 months ending July 2026, Redfin |
| The Heights typical home value | $749,194 | +2.0% YoY | Mid-2026, Zillow |
The submarket detail is more informative than the citywide averages. Downtown Jersey City, the city's premium brownstone and waterfront condo submarket, posted a median sale price of $989,662 in July 2026, up 4.6 percent year over year, confirming continued strength at the top of the market. Journal Square, by contrast, posted the sharpest percentage gain in the city, with its median sale price up 23.5 percent year over year to $598,796, a figure that likely reflects both genuine appreciation and a changing mix of newly delivered condo product entering the resale and initial sale pool as the neighborhood's redevelopment matures. The Heights, dominated by two and three family homes, posted a more modest 2.0 percent gain to a typical value of $749,194. Taken together, these figures describe a citywide market that is flat to modestly softer on an aggregate basis while individual high growth submarkets, particularly Journal Square, continue to re-rate upward as transit oriented redevelopment delivers new product.
Section 10Commercial Real Estate and Retail Centers
Jersey City's commercial office market, concentrated on the Hudson Waterfront, is gradually healing from a deep vacancy overhang but remains one of the more challenged segments of the local real estate market. Cushman and Wakefield's New Jersey Office MarketBeat for the fourth quarter of 2025, published February 2026, reported Hudson Waterfront office inventory of 21.43 million square feet, combining Jersey City, Hoboken, and Weehawken, with vacancy of 28.9 percent, down from 29.8 percent in the third quarter of 2025 and from 34.1 percent in the first quarter of 2025. Overall asking rent was $46.27 per square foot, with Class A space asking $46.50 per square foot, the highest rent among major New Jersey office submarkets outside a handful of premium corridors, and the submarket recorded positive net absorption of 151,338 square feet in the fourth quarter alone and 817,786 square feet for full year 2025, its third consecutive quarter of positive absorption. A separate measure from PwC and the Urban Land Institute's Jersey City research, published October 2, 2025, using a different building sample, put waterfront office vacancy at 24.6 percent with asking rent of $44.51 per square foot, a rent level that report described as 32 percent above the broader Northern New Jersey average but still 42 percent below Manhattan.
| Metric, Hudson Waterfront | Value | Change | Period and source |
|---|---|---|---|
| Office vacancy | 28.9% | -90 bps vs Q3 2025, -520 bps vs Q1 2025 | Q4 2025, Cushman & Wakefield |
| Office asking rent, overall / Class A | $46.27 / $46.50 per sf | not stated | Q4 2025, Cushman & Wakefield |
| Net absorption, quarter / full year | +151,338 sf / +817,786 sf | 3rd consecutive positive quarter | Q4 2025 / full year 2025, Cushman & Wakefield |
| Office vacancy, alternate measure | 24.6% | not stated | October 2025, PwC/ULI |
Notable leasing activity has been concentrated among healthcare, insurance, and financial services tenants. Kessler Rehabilitation signed a 125,000 square foot lease at Harborside 6, reported by ROI-NJ in May 2025 as the largest new Hudson Waterfront office transaction since Lord Abbett's lease in September 2022. Newport Office Center signed five leases totaling 47,162 square feet in the same period, including 33,843 square feet to Berkley Insurance, according to NJBIZ reporting from May 13, 2025, evidence that insurance and financial services tenants continue to view Class A waterfront space favorably even as overall vacancy remains elevated. Retail in Jersey City is closely tied to the density of the waterfront and Journal Square residential population, with ground floor retail, including a Target anchoring the One Journal Square project, forming an increasingly important amenity layer for the thousands of new apartment units delivering nearby.
Section 11Transactions and Capital Markets
Investment sales activity in Jersey City has been shaped by both continued development land assembly and by distress working through the older office stock. Veris Residential sold development sites at 3 Second Street and 242 Hudson Street, known as Harborside 8/9, to Panepinto Properties for $75 million in December 2025, with plans for a roughly 1,000 unit mixed use project, a transaction arranged by Cushman and Wakefield and reported by NJBIZ. In the office sector, Real Capital Solutions and Lamar Companies acquired 30 Montgomery Street, a 368,049 square foot, 16 story Class A office tower that was approximately 61 percent leased after more than $30 million of renovations, according to NJBIZ reporting from April 2026, with the price undisclosed. At the more distressed end of the market, JLL was marketing a $130 million nonperforming loan secured by 90 Hudson Street, a 432,284 square foot Class A office building, following a foreclosure judgment entered in March 2026, according to a JLL offering memorandum updated in June 2026, illustrating that meaningful distress remains in older waterfront office assets even as newer, better positioned buildings lease up.
The broader Northern and Central New Jersey office market, a wider benchmark than Jersey City alone, showed overall vacancy of 25.0 percent in the second quarter of 2026 with 704,150 square feet of quarterly absorption, the lowest vacancy reading since year end 2022, according to a JLL New Jersey Office Market Dynamics report published July 2026. That regional improvement provides useful context for the Jersey City specific figures above: the broader New Jersey office market is healing at a similar pace to the Hudson Waterfront submarket, suggesting the recovery is a genuine regional trend rather than a Jersey City specific anomaly. For an investor, the takeaway is that entry pricing on well positioned, renovated waterfront office assets is becoming more competitive as absorption improves, while older, more heavily leveraged assets, exemplified by the 90 Hudson Street loan sale, continue to present workout and value add opportunities for capital willing to underwrite lease up risk.
Section 12Taxes
New Jersey is known nationally for high property taxes, and Jersey City is no exception, though its effective rate is more moderate than many other New Jersey municipalities because of the city's relatively high assessed values. The New Jersey Division of Taxation's 2025 General Tax Rates, published in 2026, listed Jersey City's general tax rate at 2.335 per 100 dollars of assessed value, equivalent to 2.335 percent of assessed value before exemptions, a figure that already incorporates the municipal, county, school, and other applicable levies. The same publication listed Jersey City's effective tax rate, a state equalized figure designed to allow comparison across municipalities with different assessment ratios, at 1.847 percent. Hudson County's county only levy rate was approximately $3.41 per $1,000 of equalized value, or about 0.341 percent, for 2025, according to the Hudson County 2025 Budget Summary published in May 2025, though this figure should not be added on top of the Jersey City general rate above because the county levy is already embedded in that combined rate.
| Item | Value | Scope and source |
|---|---|---|
| Jersey City general tax rate | 2.335% of assessed value | 2025 rates, NJ Division of Taxation |
| Jersey City effective tax rate | 1.847% | 2025 rates, NJ Division of Taxation |
| Hudson County levy rate (component) | ~0.341% | 2025, Hudson County Budget Summary |
| Average residential tax bill, Jersey City | $10,624 | 2024, NJ DCA data via municipal comparison |
For an investor, property taxes are among the largest recurring operating costs in any Jersey City acquisition and must be modeled on the specific parcel's assessed value rather than assumed from the average bill, since the average residential tax bill of $10,624 reported for 2024 reflects a mix of property types and assessed values across the city. Investors should also account for the near certainty of reassessment as property values change and should confirm whether a given property benefits from any applicable abatement, since Jersey City, like many New Jersey redevelopment areas, has historically used long term tax abatements to encourage new construction, which can make a newly built property's effective tax burden very different from that of an older, fully assessed building nearby.
Section 13Insurance
Homeowners and property insurance costs in New Jersey have risen sharply in recent years, a trend that directly affects Jersey City ownership economics. NJ.com reporting from October 14, 2025, drawing on New Jersey Department of Banking and Insurance rate filings, found that more than 50 homeowners insurers received rate increase approvals in New Jersey during 2025, including a 23.6 percent increase for Founders, a 21.6 percent increase for Farmers Property and Casualty, and a 19.8 percent increase for St. Paul Protective, a Travelers company. The Department of Banking and Insurance's own budget response materials, published in 2025 and 2026, reported that the department had prevented $143 million in requested homeowners premium increases from reaching consumers during 2024 and early 2025, evidence that regulatory scrutiny is actively moderating, though not eliminating, the pace of increases.
| Item | Value or trend | Scope and source |
|---|---|---|
| New Jersey homeowners insurers with approved rate hikes, 2025 | 50+ insurers | NJ.com, October 2025, citing NJDOBI filings |
| Selected approved increases | 23.6% Founders, 21.6% Farmers P&C, 19.8% St. Paul/Travelers | NJDOBI filings via NJ.com, October 2025 |
| NJDOBI prevented premium increases | $143 million | 2024-early 2025, NJDOBI budget materials |
| NJ FAIR Plan (residual market) increase | +57% | Effective June/August 2024, NJDOBI approval |
| NJ average NFIP flood premium | ~$1,040/year | 228,536 active policies statewide, FEMA/NFIP data, updated July 2026 |
Flood insurance is a distinct and material cost for waterfront exposed Jersey City properties. Standard homeowners and condominium policies generally do not cover flood damage, and federally regulated lenders generally require separate National Flood Insurance Program or private flood coverage for mortgaged structures located within a Special Flood Hazard Area, according to New Jersey Department of Banking and Insurance guidance current through August 2026. The statewide average NFIP premium was approximately $1,040 per year across 228,536 active policies as of a New Jersey flood zone lookup dataset updated July 8, 2026, though this is a statewide average rather than a Jersey City specific figure and actual premiums vary substantially by flood zone, elevation, and construction. FEMA's transition to Risk Rating 2.0 pricing was projected, in a New Jersey state profile updated April 22, 2025, to leave about 95 percent of existing New Jersey policyholders with either a decrease or an increase of no more than $20 per month at initial transition, though premiums can continue to rise annually toward full risk pricing over time. Given Jersey City's substantial waterfront exposure, discussed further in the climate section, insurance costs, both standard property coverage and flood specific coverage, should be quoted and underwritten on a parcel specific basis for any acquisition rather than assumed from citywide or statewide averages.
Section 14Landlord Tenant and Regulatory Environment
New Jersey has one of the more tenant protective legal frameworks in the country, and Jersey City layers its own rent control ordinance on top of that statewide framework, which together create a materially different regulatory environment than most Sun Belt markets. Statewide, the Anti-Eviction Act, codified at N.J.S.A. 2A:18-61.1, requires landlords to establish one of a defined list of good cause grounds before removing a covered residential tenant, including nonpayment of rent, continued disorderly conduct after notice, willful or grossly negligent property damage, substantial lease or house rule violations after notice, habitual late payment, refusal of reasonable lease changes, an otherwise lawful rent increase the tenant refuses to pay, owner occupancy of the unit, code related building closure, demolition or conversion, and certain redevelopment grounds, according to a New Jersey Department of Community Affairs bulletin current through August 2026. A limited exception applies to owner occupied two or three family properties with no more than two rental units, which are generally not subject to the full good cause protection, though other notice and court process requirements still apply. Critically, self help eviction is illegal in New Jersey: a landlord must obtain a court judgment and warrant of removal, and lockouts, utility shutoffs, or removal of a tenant's belongings without legal process are unlawful, according to New Jersey Courts guidance updated May 2026.
Jersey City's own rent control ordinance, codified in Chapter 260, Section 260-3 of the municipal code, generally covers residential buildings with five or more units, with buildings of four or fewer units exempt, along with certain post-1987 new construction that satisfied statutory filing conditions, according to the New Jersey Department of Community Affairs' 2025 Rent Control Survey, updated August 26, 2026. For covered units, the ordinance caps the annual increase at the lesser of 4 percent or the percentage change in the regional Consumer Price Index, measured from three months before lease commencement to three months before expiration or termination, and generally permits only one ordinary cost of living increase in any 12 month period. The ordinance does not create unrestricted market rate decontrol on vacancy, though it does provide specified mechanisms for rent increases tied to qualifying capital improvements, along with hardship and capital improvement petition procedures for landlords seeking relief beyond the standard cap.
| Rule | Current requirement |
|---|---|
| Jersey City rent control cap, covered units | Lesser of 4% or regional CPI change, generally one increase per 12 months |
| Jersey City rent control coverage | Buildings with 5+ units generally covered; 4 or fewer units exempt |
| Security deposit cap | Maximum 1.5 months' rent; annual increase capped at 10% of existing deposit |
| Security deposit handling | Must be placed in interest-bearing NJ account within 30 days; interest belongs to tenant |
| Security deposit return | Generally due within 30 days after tenancy ends, less lawful itemized deductions |
Security deposits statewide are capped at a maximum of 1.5 months' rent under N.J.S.A. 46:8-21.2, with any annual increase in the deposit amount generally limited to 10 percent of the existing deposit, according to New Jersey Department of Community Affairs Truth in Renting guidance updated August 17, 2026. Landlords must generally place the deposit in an interest bearing New Jersey account within 30 days of receipt, with written disclosure to the tenant, and interest on the deposit belongs to the tenant. The deposit must generally be returned within 30 days after the tenancy ends, less any lawful itemized deductions, with accelerated deadlines applying after events such as fire, flood, condemnation, or displacement. For an investor, the combined effect of the statewide Anti-Eviction Act and Jersey City's rent control ordinance is that eviction for cause remains available but requires court process and a defined statutory ground, that rent growth on a large share of the city's older apartment stock is structurally capped well below market in strong demand years, and that newer, exempt construction is where landlords retain the most pricing flexibility, all of which should be built explicitly into underwriting rather than assumed away.
Section 15Infrastructure
Jersey City's real estate value is inseparable from its transit infrastructure, which is more extensive and more directly tied to Manhattan than that of almost any other city outside New York itself. The Port Authority Trans-Hudson system, known as PATH, serves four Jersey City stations, Journal Square, Grove Street, Exchange Place, and Newport, connecting the city with Hoboken, Harrison, Newark, and both the World Trade Center and Midtown Manhattan across a 13 station system, according to Port Authority materials updated July 17, 2026. The Hudson-Bergen Light Rail provides a second transit spine, connecting Jersey City's waterfront, Downtown, Bergen-Lafayette, and West Side neighborhoods with Bayonne, Hoboken, Weehawken, Union City, and North Bergen, with key Jersey City stops including Exchange Place, Essex Street, Marin Boulevard, Liberty State Park, Garfield Avenue, and West Side Avenue, according to NJ Transit HBLR materials current through September 2026.
The Holland Tunnel, connecting Canal Street in Manhattan with 12th and 14th Streets in Jersey City, opened in 1927 and has been operated by the Port Authority since 1930, according to Port Authority historical materials updated August 2026, and remains a critical vehicular link for residents who do not commute via PATH. The Port Authority additionally operates the Port of New York and New Jersey, which handled approximately 8.9 million total twenty foot equivalent units, including 5,955,798 loaded TEUs, up 2.8 percent year over year, in 2025, making it the second busiest United States port for loaded containers, according to Port Authority facility volume data reported in February 2026. While the port's operations are centered on Newark Bay and Port Newark-Elizabeth rather than Jersey City proper, the port anchors regional logistics demand that touches industrial and warehouse real estate throughout Hudson County. For a residential or office investor, the practical conclusion is that transit proximity, particularly walking distance to a PATH or HBLR station, remains the single strongest predictor of relative rent and value within Jersey City, a pattern visible directly in the wide submarket rent spread documented earlier in this review.
Section 16Climate and Physical Risks
Physical and flood risk is a genuine and well documented concern for Jersey City given its low lying waterfront geography and its history with Hurricane Sandy. The city's own Resiliency Master Plan, posted in draft form November 3, 2025, found that approximately 40 percent of Jersey City's land area, or 3,782 acres, falls within the proposed Special Flood Hazard Area, encompassing parts of the waterfront, historic and business districts, transportation assets, and residential neighborhoods. The same plan adopted a sea level rise planning assumption of 1.2 feet by 2050, under which a future storm could produce flooding reaching approximately 7.1 feet, and noted that modeled inundation from a Sandy or Irene type event could reach a maximum elevation of approximately 14.579 feet in parts of the city, a figure that illustrates real tail risk beyond the minimum 1 percent annual chance floodplain typically used for standard flood insurance rating.
The city's Adaptation Master Plan, posted October 15, 2024, evaluated NOAA and FEMA storm surge and sea level rise scenarios up to six feet and identified 27 potential coastal protection measures under consideration, reflecting an active, ongoing municipal planning process rather than a settled, fully funded defense system. Hurricane Sandy itself, according to the city's Strategic Recovery Planning Report, exposed both coastal inundation pathways and combined sewer and drainage vulnerabilities that can produce flooding even in properties outside the officially mapped Special Flood Hazard Area.
The investor implications are direct. First, flood zone status must be verified parcel by parcel using FEMA's official Flood Map Service Center rather than relying on neighborhood level assumptions, because the city's own resiliency planning indicates the mapped floodplain is both large and likely to expand. Second, standard homeowners and commercial property policies generally exclude flood damage, so separate NFIP or private flood coverage should be quoted and stress tested for a specific parcel, as discussed in the insurance section. Third, given that combined sewer and drainage vulnerabilities can produce flooding even outside the mapped Special Flood Hazard Area, older, low lying, or waterfront adjacent properties warrant additional diligence on drainage, elevation, and flood resilient construction regardless of their official flood zone designation. Physical risk does not disqualify Jersey City as a market, but it is a genuine and quantifiable cost that must be priced into any acquisition rather than assumed away.
Section 17Neighborhoods and Submarkets
Jersey City is a collection of distinct submarkets whose pricing and development activity vary enormously despite the city's compact size. Downtown, also called Historic Downtown, is the city's premium walkable submarket of brownstones and condominiums, with a Redfin reported median sale price of $989,662 in July 2026, up 4.6 percent year over year, and rents averaging roughly $4,201 per month, served by Grove Street and Exchange Place PATH stations and the Hudson-Bergen Light Rail. Paulus Hook and Exchange Place, immediately adjacent, combine high rise luxury condos and rentals with waterfront office towers, with average rents around $4,304 per month and direct PATH access to the World Trade Center, ferry service, and the Hudson River Waterfront Walkway.
Journal Square is the fastest changing submarket in the city, a major PATH and bus transit hub undergoing intensive high rise redevelopment, with roughly 3,800 units under construction and more than 7,600 delivered since 2021, a median sale price of $598,796 in July 2026, up a sharp 23.5 percent year over year, and average rents of roughly $2,834 per month, considerably more affordable than the waterfront submarkets. Newport is a master planned waterfront district combining high rise rentals, condominiums, offices, and retail, served by its own PATH station and the Hudson-Bergen Light Rail, with average rents around $4,137 per month. Bergen-Lafayette and the Communipaw area offer lower density, more attainable mixed housing near Liberty State Park, with average rents of roughly $2,871 to $2,942 per month and Hudson-Bergen Light Rail access to the waterfront and Hoboken. Greenville, the city's most affordable submarket, is dominated by one to four family homes and smaller rental buildings, with average rents around $1,787 to $1,829 per month in its southern section, longer commute times, and access primarily via light rail and bus rather than PATH. The Heights, predominantly two and three family homes and low rise apartments, carries a typical home value around $749,194, up 2.0 percent year over year, and relies on bus service to Manhattan and Hoboken rather than a direct PATH connection.
The submarket conclusion for an investor is that transit access is the dominant organizing variable across Jersey City: PATH adjacent Downtown, Paulus Hook, Exchange Place, and Newport command the highest rents and prices and the deepest liquidity, Journal Square offers the strongest current growth trajectory as its redevelopment matures, and Bergen-Lafayette, Greenville, and The Heights offer meaningfully more affordable entry points with correspondingly less direct transit access and lower absolute price appreciation to date.
Section 18Opportunities
The clearest near term opportunity lies in acquiring stabilized or value add multifamily assets ahead of the coming supply wave while the citywide vacancy rate remains historically tight. With citywide vacancy at just 2.8 percent as of the second quarter of 2025, per PwC and the Urban Land Institute, an investor who can acquire existing, well located product before the more than 6,600 waterfront units and roughly 3,800 Journal Square units currently under construction complete their lease up is positioned to benefit from Jersey City's continued population and job base even as the market absorbs new supply, provided the acquisition is priced to reflect the coming increase in competitive inventory rather than the current tight reading.
Journal Square itself represents a second, more growth oriented opportunity. The submarket's 23.5 percent year over year gain in median sale price, its comparatively affordable average rent of roughly $2,834 per month relative to the waterfront, and its position as a major PATH and bus transit hub together suggest a neighborhood still in the middle innings of a redevelopment cycle that began in earnest around 2021. A third opportunity lies in select office repositioning. The successful lease up of renovated assets like 30 Montgomery Street, now roughly 61 percent leased after more than $30 million of capital improvements, and continued positive absorption on the Hudson Waterfront, three consecutive quarters through the fourth quarter of 2025 per Cushman and Wakefield, both suggest that well capitalized investors willing to fund renovations on older Class A stock can capture the flight to quality dynamic that is driving healthcare, insurance, and financial services tenants to sign large leases even while overall submarket vacancy remains elevated.
Section 19Risks
The most immediate risk is the scale of the incoming apartment supply relative to the size of the existing market. CoStar's finding that Jersey City's waterfront submarket alone carries construction equal to about 28 percent of existing inventory, the highest ratio of any tracked submarket in the New York region, means that citywide vacancy, at just 2.8 percent as of mid-2025, is very likely to rise meaningfully as these units deliver through 2026, 2027, and 2028, which should pressure rent growth and concessions in the most supply heavy waterfront and Journal Square pockets specifically.
The office sector remains a second concrete risk. Hudson Waterfront office vacancy of 28.9 percent as of the fourth quarter of 2025, even after three consecutive quarters of positive absorption, is still nearly triple its 2019 pre-pandemic level by most historical accounts, and the $130 million nonperforming loan and subsequent foreclosure judgment on 90 Hudson Street illustrates that meaningful distress persists in older, less competitive buildings even as newer product leases up. A third risk is regulatory: Jersey City's rent control ordinance caps annual increases on covered five or more unit buildings at the lesser of 4 percent or regional CPI change, which limits how quickly an owner of older rent controlled stock can respond to rising operating costs, including the property tax and insurance increases documented in this review, and any investor considering covered stock should model this cap explicitly rather than assuming market rate flexibility. A fourth risk is demographic: Hudson County's population growth depends entirely on international migration offsetting a persistent net domestic outflow, which makes the city's demand base sensitive to changes in federal immigration policy in a way that markets with organic domestic in migration are not. Finally, physical risk is real and documented by the city's own planning: approximately 40 percent of Jersey City's land area falls within the proposed Special Flood Hazard Area, and combined sewer and drainage vulnerabilities exposed by Hurricane Sandy can produce flooding even outside the officially mapped zone, a risk that translates directly into the insurance cost increases documented in the insurance section.
Section 20Investor Implications
For an investor evaluating Jersey City, the evidence supports a market with genuine structural strengths, a dense, high income, transit connected population inside one of the country's largest and still growing metropolitan areas, combined with real, quantifiable near term risks that must be underwritten explicitly rather than assumed away. The multifamily demand base is strong, evidenced by a 2.8 percent citywide vacancy rate as of mid-2025, but that tightness is about to be tested by a supply pipeline that is unusually large relative to the size of the existing market, and any underwriting should build in a meaningful vacancy increase and slower rent growth over the next two to three years as the waterfront and Journal Square pipelines deliver, rather than extrapolating the current tight reading forward.
Jersey City's regulatory environment also requires more explicit modeling than a typical Sun Belt market. Rent control coverage on buildings of five or more units caps annual increases at the lesser of 4 percent or regional CPI change, which should be built directly into any pro forma for covered stock, while newer, exempt construction retains full market pricing flexibility, a meaningful distinction when comparing an older rent controlled asset against new construction. Carrying costs deserve equal attention: an effective property tax rate near 1.85 percent, homeowners and flood insurance premiums that are rising across New Jersey broadly and that carry additional flood specific exposure given the city's waterfront geography, and the near certainty of reassessment over a typical hold period should all be quoted and stress tested on a parcel specific basis. Investors comfortable underwriting a large incoming supply wave, a still recovering office sector, rent control on older stock, and genuine flood risk, and who price each of those factors explicitly, are being offered access to one of the most transit connected, income dense, and structurally supply constrained urban markets in the New York metropolitan region. Those unwilling to model rent control, flood risk, and the coming supply wave explicitly should look to less regulated, less geographically exposed markets instead.
Section 21Conclusion
Jersey City in the second half of 2026 is a market of genuine contrasts. Its population continues to grow modestly, sustained entirely by international migration offsetting domestic outflows, while its financial services and healthcare employment base remains deep and high income relative to most American cities. Its apartment market has been exceptionally tight, with citywide vacancy of just 2.8 percent as of mid-2025, even as the largest construction wave in years, more than 6,600 waterfront units and roughly 3,800 Journal Square units under construction, is poised to test that tightness over the next several years. Its office market is healing gradually, with vacancy falling from 34.1 percent to 28.9 percent over the course of 2025 even as meaningful distress persists in older buildings. Home prices are flat to modestly softer citywide even as individual submarkets like Journal Square post double digit gains. Against all of this stand real structural constraints, a rent control ordinance that caps increases on older covered stock, elevated property taxes and rising insurance costs, and genuine, well documented flood risk that the city itself is actively planning to address. The market rewards investors who embrace Jersey City's transit connected, income dense demand story while pricing its supply wave, its regulatory framework, and its flood exposure with equal rigor. Jersey City's proximity to Manhattan, its deep employment base, and its dense transit infrastructure make it one of the more distinctive urban markets in the New York region for patient capital, provided the underwriting is honest about the coming supply, the regulatory caps, and the physical risk that come with owning property there.
Sources
- U.S. Census Bureau, Vintage 2025 City and Town Population Estimates, released May 2026, https://www.census.gov/programs-surveys/popest.html
- U.S. Census Bureau QuickFacts, Jersey City city, New Jersey, https://www.census.gov/quickfacts/fact/table/jerseycitycitynewjersey
- U.S. Census Bureau QuickFacts, Hudson County, New Jersey, https://www.census.gov/quickfacts/fact/table/hudsoncountynewjersey
- New Jersey Department of Labor and Workforce Development, Hudson County Brief, updated January 2026, https://www.nj.gov/labor/labormarketinformation/assets/PDFs/pub/factbook/Hudson%20county%20brief%20NJ%20facts.pdf
- U.S. Census Bureau, Growth in Metro Areas Outpaced Nation, March 13, 2025, https://www.census.gov/newsroom/press-releases/2025/population-estimates-counties-metro-micro.html
- U.S. Census Bureau, Some Metro Areas' Population Gains Reversed COVID-19 Era Trends, April 17, 2025, https://www.census.gov/library/stories/2025/04/metro-area-trends.html
- U.S. Bureau of Labor Statistics, New York-Newark-Jersey City Economy at a Glance, https://www.bls.gov/eag/eag.ny_newyork_msa.htm
- U.S. Bureau of Labor Statistics, Newark, NJ Metropolitan Division, https://www.bls.gov/regions/mid-atlantic/nj_newark_md.htm
- Federal Reserve Bank of St. Louis (FRED), New York-Newark-Jersey City Unemployment Rate, https://fred.stlouisfed.org/series/NEWY636UR
- U.S. Census Bureau, 2020-2024 American Community Survey 5-Year Estimates, released December 2025, https://www.census.gov/programs-surveys/acs/data.html
- U.S. Census Bureau, 2024 American Community Survey 1-Year Estimates, released September 11, 2025, https://www.census.gov/programs-surveys/acs/data.html
- Hudson County Economic Development Corporation, Why Hudson / Hudson County Major Employers, https://hudsonedc.org/why-hudson/
- Livability/Hudson County, Hudson County Is a Global Hub for Business Growth, May 26, 2026, https://livability.com/nj/jersey-city/education-careers-opportunity/hudson-county-nj-is-a-global-hub-for-business-growth/
- JPMorgan Chase Careers, Jersey City, updated September 13, 2024, https://careers.jpmorgan.com/jp/ja/about-us/locations/jersey-city
- RentCafe / Yardi Matrix, Average Rent in Jersey City, November 18, 2025, https://www.rentcafe.com/average-rent-market-trends/us/nj/jersey-city/
- RentCafe, Downtown Jersey City rent trends, https://www.rentcafe.com/average-rent-market-trends/us/nj/jersey-city/downtown-jersey-city/
- RentCafe, Journal Square rent trends, https://www.rentcafe.com/average-rent-market-trends/us/nj/gateway/journal-square/
- RentCafe, Newport rent trends, https://www.rentcafe.com/average-rent-market-trends/us/nj/hudson-county/jersey-city/newport/
- PwC and Urban Land Institute, Emerging Trends in Real Estate, Jersey City Market Insights, October 2, 2025
- Institutional Property Advisors, Northern New Jersey Multifamily Market Report, Q2 2025
- Institutional Property Advisors, 2026 Northern New Jersey Multifamily Investment Forecast, February 5, 2026
- U.S. Census Bureau / FRED, Rental Vacancy Rate for New Jersey, updated March 24, 2026, https://fred.stlouisfed.org/
- CoStar, In Jersey City, Hot Spots Dominate Multifamily Construction, May 28, 2026, https://www.costar.com/article/1258318218/in-jersey-city-hot-spots-dominate-multifamily-construction
- Jersey Digs, Journal Square Jersey City Developments, https://jerseydigs.com/journal-square-jersey-city-developments/
- Real Estate NJ, Kushner nears topping out of first tower, start of second phase for One Journal Square project, January 25, 2024, https://re-nj.com/kushner-nears-topping-out-of-first-tower-start-of-second-phase-for-one-journal-square-project/
- Real Estate NJ, Panepinto tops out 605-unit high rise in Journal Square, May 28, 2025, https://re-nj.com/panepinto-tops-out-605-unit-high-rise-in-journal-square-eyeing-spring-2026-debut/
- Real Estate NJ, Developer nears completion, eyes debut of 622-unit Journal Square rental tower, December 5, 2025, https://re-nj.com/developer-nears-completion-eyes-debut-of-622-unit-journal-square-rental-tower/
- NJ.com, $220M tower with 542 rentals is coming to this NJ Transit hub, June 14, 2026, https://www.nj.com/hudson/2026/06/220m-tower-with-542-rentals-is-coming-to-this-nj-transit-hub.html
- Multi-Housing News, Tishman Speyer and Goldman Sachs waterfront development update, April 14, 2025
- Real Estate NJ, 201 Hudson by Urby financing, August 25, 2026, https://re-nj.com/
- Homes.com News, Harborside 4 construction schedule, January 6, 2026
- NJBIZ, Harborside sale, Panepinto 1K-unit Jersey City, December 10, 2025, https://njbiz.com/harborside-sale-panepinto-1k-unit-jersey-city/
- Redfin, Jersey City, NJ Housing Market, updated September 5, 2026, https://www.redfin.com/city/9168/NJ/Jersey-City/housing-market
- Redfin, Downtown Jersey City Housing Market, https://www.redfin.com/neighborhood/downtown-jersey-city
- Redfin, Journal Square Housing Market, https://www.redfin.com/neighborhood/journal-square-jersey-city
- Zillow, Jersey City, NJ Home Values, updated September 2026, https://www.zillow.com/home-values/25320/jersey-city-nj/
- Zillow, The Heights, Jersey City, NJ Home Values, https://www.zillow.com/home-values/275707/the-heights-jersey-city-nj/
- Cushman & Wakefield, New Jersey Office MarketBeat, Q4 2025, published February 2026, https://assets.cushmanwakefield.com/-/media/cw/marketbeat-pdfs/2025/q4/us-reports/office/nj_americas_marketbeat_office_q42025.pdf
- ROI-NJ, Kessler Rehabilitation Center signs lease at Harborside in Jersey City, May 14, 2025, https://www.roi-nj.com/2025/05/14/real_estate/kessler-rehabilitation-center-signs-lease-at-harborside-in-jersey-city/
- NJBIZ, CBRE inks leases totaling 47K square feet at Newport Office Center, May 13, 2025, https://njbiz.com/cbre-newport-office-leases-jersey-city/
- NJBIZ, Real Capital Solutions buys 30 Montgomery, Jersey City, April 23, 2026, https://njbiz.com/real-capital-solutions-buys-30-montgomery-jersey-city/
- JLL, Ninety Hudson Offering (90 Hudson Street nonperforming loan), updated June 11, 2026
- JLL, New Jersey Office Market Dynamics, Q2 2026, published July 2026, https://www.jll.com/en-us/insights/market-dynamics/new-jersey-office
- New Jersey Division of Taxation, 2025 General Tax Rates, https://www.nj.gov/treasury/taxation/pdf/lpt/gtr/2025taxrates.pdf
- Hudson County, 2025 Budget Summary, published May 2025, https://www.hcnj.us/wp-content/uploads/2025/05/2025-Budget-Summary.pdf
- NJ.com, Homeowners insurance costs are surging, see the double-digit rate hikes in NJ, October 14, 2025, https://www.nj.com/news/2025/10/homeowners-insurance-costs-are-surging-see-the-double-digit-rate-hikes-in-nj.html
- New Jersey Department of Banking and Insurance, FY2026 budget follow-up response, https://pub.njleg.state.nj.us/publications/budget/governors-budget/2026/dobi_follow_up_response_abu_.pdf
- U.S. News, New Jersey Homeowners Insurance, updated March 18, 2025, https://www.usnews.com/insurance/homeowners-insurance/local/new-jersey
- New Jersey Flood Zone Lookup, NFIP policy data, updated July 8, 2026
- FEMA, New Jersey Risk Rating 2.0 State Profile, updated April 22, 2025
- New Jersey Department of Banking and Insurance, Notice Regarding Flood Damage Coverage, current through August 2026, https://www.nj.gov/dobi/division_consumers/insurance/floodreq.htm
- FEMA, Flood Map Service Center, https://msc.fema.gov/
- City of Jersey City, Resiliency Master Plan (draft), posted November 3, 2025, https://www.jerseycitynj.gov/cityhall/infrastructure/division_of_sustainability/resiliencyplanning
- City of Jersey City, Adaptation Master Plan, posted October 15, 2024
- City of Jersey City, Strategic Recovery Planning Report (Hurricane Sandy), https://data.jerseycitynj.gov/
- New Jersey Department of Community Affairs, Anti-Eviction Act and Grounds for Eviction Bulletin, current through August 2026, https://www.nj.gov/dca/codes/publications/pdf_lti/grnds_for_evicti_bulltin.pdf
- New Jersey Courts, Landlord/Tenant, updated May 11, 2026, https://www.njcourts.gov/self-help/landlord-tenant
- New Jersey Department of Community Affairs, 2025 Rent Control Survey, updated August 26, 2026, https://www.nj.gov/dca/home/misc/Rent_Control_Survey.xlsx
- Jersey City Municipal Code, Chapter 260, Rent Control
- New Jersey Department of Community Affairs, Truth in Renting, updated August 17, 2026, https://www.nj.gov/dca/codes/publications/pdf_lti/t_i_r.pdf
- Port Authority of New York and New Jersey, PATH Stations, updated July 17, 2026, https://www.panynj.gov/path/en/index.html
- NJ Transit, Hudson-Bergen Light Rail, https://www.njtransit.com/
- Port Authority of New York and New Jersey, History of the Holland Tunnel, updated August 9, 2026
- ROI-NJ, Volume at Port of New York and New Jersey rose in 2025 despite tariff uncertainty, February 26, 2026, https://www.roi-nj.com/2026/02/26/industry/volume-at-port-of-new-york-and-new-jersey-rose-in-2025-despite-tariff-uncertainty/