In brief · summary: Knoxville
Knoxville is the core city of a mid sized MSA in eastern Tennessee anchored by the University of Tennessee, regional healthcare, Oak Ridge National Laboratory, and advanced manufacturing. Public data through mid 2026 show continued job gains, low unemployment, and a housing market that is firm on prices while asking rents have softened in 2026.
Key verified metrics: | Indicator | Value | Period / Source | | --- | ---: | --- | | Total nonfarm payrolls | 458.5k (May 2026); 456.2k (Jun 2026, preliminary) | BLS Economy at a Glance, Knoxville MSA, Jan to Jun 2026 | | Civilian labor force | 467.8k (May 2026); 466.2k (Jun 2026, preliminary) | BLS (same) | | Unemployment rate | 2.7% (May 2026); 3.4% (Jun 2026, preliminary) | BLS (same) | | City population (Knoxville) | 198,722 | 2024 estimate, U.S. Census Bureau | | City population (Census count) | 190,740 | April 2020, U.S.
Census Bureau | | Median household income (city) | $50,994 | ACS 2019 to 2023, U.S. Census Bureau | | Median sale price (three months) | $325,423 (+1.7% YoY) | Redfin Knoxville, 3 months ending Jun 2026 | | Median price per sq ft (three months) | $242 (+8.0% YoY) | Redfin Knoxville, 3 months ending …
Section 01Executive Summary
Knoxville is the core city of a mid sized MSA in eastern Tennessee anchored by the University of Tennessee, regional healthcare, Oak Ridge National Laboratory, and advanced manufacturing. Public data through mid 2026 show continued job gains, low unemployment, and a housing market that is firm on prices while asking rents have softened in 2026. Key verified metrics:
| Indicator | Value | Period / Source |
|---|---|---|
| Total nonfarm payrolls | 458.5k (May 2026); 456.2k (Jun 2026, preliminary) | BLS Economy at a Glance, Knoxville MSA, Jan to Jun 2026 |
| Civilian labor force | 467.8k (May 2026); 466.2k (Jun 2026, preliminary) | BLS (same) |
| Unemployment rate | 2.7% (May 2026); 3.4% (Jun 2026, preliminary) | BLS (same) |
| City population (Knoxville) | 198,722 | 2024 estimate, U.S. Census Bureau |
| City population (Census count) | 190,740 | April 2020, U.S. Census Bureau |
| Median household income (city) | $50,994 | ACS 2019 to 2023, U.S. Census Bureau |
| Median sale price (three months) | $325,423 (+1.7% YoY) | Redfin Knoxville, 3 months ending Jun 2026 |
| Median price per sq ft (three months) | $242 (+8.0% YoY) | Redfin Knoxville, 3 months ending Jun 2026 |
| Zillow average asking rent (all types) | $1,800 (Jun 4 2026 snapshot; ≈ -$100 YoY) | Zillow Rental Manager, Knoxville (page updated Jun 4 2026) |
| Zillow vs national rent | Knoxville rent 10.18% lower vs Zillow national avg ($2,004) | Zillow Rental Manager, Knoxville (Jun 4 2026) |
| Yardi tracked apartment units | 47,327 units (231 properties) | Yardi Matrix Knoxville South public summary (2026) |
| Yardi total residential units tracked | 67,839 units | Yardi Matrix public summary (2026) |
Sources: BLS, Redfin, Zillow, Yardi, Cushman local Marketbeat (see Sources). Numbers are taken from the cited public summaries and BLS tables; where values are preliminary the BLS preliminary flags are preserved.
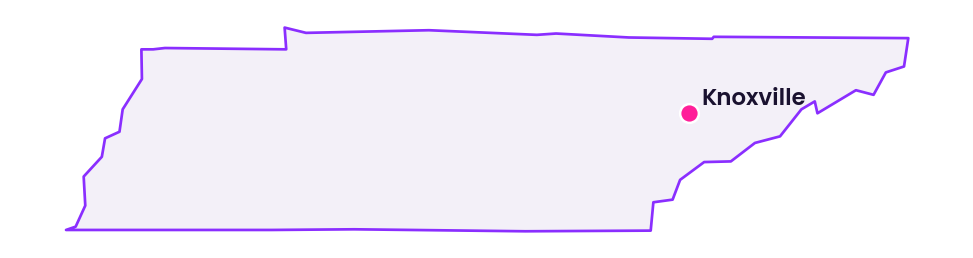
Section 02Population and Migration
- The city of Knoxville population is about 198,722 as of the 2024 estimate and 190,740 at the 2020 Census.
- Redfin migration sample: 0.73% of national Redfin users searched to move into Knoxville (Jan, Mar 2026 sample); inbound net search flows led by Nashville (+448), Chicago (+364), and Los Angeles (+232); 73% of Knoxville buyers searched to stay within the Knoxville MSA.
- Local planning facts and figures documents (Knoxville and Knox County 2024 Facts and Figures) exist and summarize city and county demographics.
Conclusion: metro level indicators and Redfin search flows point to modest net in migration and steady local demand.
Section 03Jobs and Economic Anchors
BLS monthly labor force and payroll snapshot (Knoxville MSA, Jan, prelim Jun 2026):
| Month 2026 | Civilian labor force (thousands) | Employment (thousands) | Unemployment (thousands) | Unemployment rate (%) | Total nonfarm employment (thousands) | 12 month % change (Total Nonfarm) | |
|---|---|---|---|---|---|---|---|
| Jan | 464.8 | 450.5 | 14.3 | 3.1% | 452.4 | +1.0% | |
| Feb | 465.1 | 449.6 | 15.5 | 3.3% | 454.6 | +0.2% | |
| Mar | 463.2 | 450.3 | 12.9 | 2.8% | 456.0 | +0.6% | |
| Apr | 467.0 | 453.9 | 13.1 | 2.8% | 458.1 | +0.4% | |
| May | 467.8 | 455.2 | 12.6 | 2.7% | 458.5 | +0.4% | |
| Jun (p) | 466.2 | 450.1 | 16.0 | 3.4% | 456.2 (p) | +0.7% | . Sector excerpts from the same BLS table (May and preliminary June 2026) include mining/logging/construction ~21.9k (May) and 22.2k (Jun p) with 12 month changes shown on the BLS page; manufacturing ~43.9k to 44.1k (Apr to Jun p); trade/transport/utilities ~91.9k (May) and 91.8k (Jun p). |
Major anchors consistently cited in regional materials include the University of Tennessee, Tennessee Valley Authority, Oak Ridge National Laboratory, healthcare systems, and manufacturing/logistics employers.
Section 04Income
- City of Knoxville median household income is about $50,994 (ACS 2019 to 2023). A regional Cushman Marketbeat reference of about $74,500 (Q2 2025) reflects a broader metro income measure.
Investor note: local incomes appear sufficient to support current ownership and rental demand in aggregate, but parcel/submarket income distributions should be checked via ACS or proprietary data during diligence.
Section 05Housing and Multifamily
Yardi Matrix public coverage snapshot (Knoxville South, 2026):
| Metric | Yardi public summary | |
|---|---|---|
| Submarkets tracked | 19 submarkets | |
| Cities covered | 11 cities | |
| Tracked multifamily properties | 231 properties | |
| Tracked apartment units | 47,327 units | |
| Total residential units (Yardi coverage) | 67,839 units | . Interpretation: Yardi’s tracked universe shows institutional scale but smaller than major Sun Belt gateways; submarket selection matters. |
Redfin ownership market (three months ending Jun 2026): median sale price $325,423 (+1.7% YoY), median price per sq ft $242 (+8.0% YoY); 782 homes sold in Jun 2026 vs 713 in Jun 2025; median days on market ~52 days vs ~48 days prior year. These figures indicate modest price appreciation with somewhat lengthening marketing times.
Section 06Rents
Zillow Rental Manager monthly average asking rents (all bedrooms/all property types), Knoxville (Zillow table, 2025 vs 2026 series, snapshot updated Jun 4 2026):
| Month | Avg rent 2025 (USD) | Avg rent 2026 (USD) | YoY change (USD) | YoY change (%) | |
|---|---|---|---|---|---|
| January | 1,968 | 1,800 | -168 | -8.5% | |
| February | 1,975 | 1,840 | -135 | -6.8% | |
| March | 1,990 | 1,800 | -190 | -9.5% | |
| April | 1,995 | 1,795 | -200 | -10.0% | |
| May | 2,000 | 1,800 | -200 | -10.0% | |
| June | 1,950 | 1,750 | -200 | -10.3% | |
| July | 1,900 | 1,800 | -100 | -5.3% | |
| August | 1,900 | 1,850 | -50 | -2.6% | . Zillow reports the average rent at $1,800 and that Knoxville average rent is 10.18% lower than Zillow’s national average ($2,004) on the same page. |
Zillow bedroom breakouts (Jun 4 2026 snapshot): studio $1,071; one bedroom $1,200; two bedroom $1,548; three bedroom $2,100; four bedroom $1,904. Zillow rent frequency and inventory counts are published on the same page (≈1,058 rentals available as of the snapshot).
Interpretation: Zillow shows average asking rents down roughly $100 YoY in mid 2026; underwrite near term rent growth conservatively and focus on occupancy and expense control.
Section 07Vacancy
- Public signals (Zillow rent declines, Redfin transaction activity, BLS employment growth) indicate vacancy has increased from 2021, 2022 extremes but remains within functioning market ranges rather than reflecting severe distress.
- Recommendation: obtain submarket vacancy and effective rent data from local brokers or paid providers for deal level underwriting.
Section 08Supply Pipeline
- Yardi public summary provides existing tracked inventory but does not publish detailed public counts of units under construction on its summary page; local building permits and planning portals publish permits but those datasets were not accessed in structured form here.
- Knoxville has seen active residential development in recent years but not at the scale of large Sun Belt gateways. Submarket level pipeline can materially affect local rent dynamics, so local permit data and pipeline reports inform unit counts during diligence.
Section 09Single Family Homes
Redfin (three months ending Jun 2026): median sale price $325,423 (+1.7% YoY), median price per sq ft $242 (+8.0% YoY), 782 homes sold in Jun 2026 vs 713 in Jun 2025, ~52 median days on market vs ~48 prior year, sale to list ratio ~98.2% (+0.1 pt YoY).
Implied gross rent yield example: average rent ~$1,800 vs median sale price ~$325,423 implies ~0.55% per month (~6.6% per year) gross before expenses; use this illustrative calculation only as a preliminary screening metric and stress test for taxes, insurance, maintenance, and vacancy. It is not a projection of returns and no particular outcome is assured.
Section 10Commercial Real Estate and Retail Centers
Yardi Matrix public coverage (Knoxville South, 2026) reports:
| Asset type | Yardi public inventory | |
|---|---|---|
| Office | 17,332,854 sq ft | |
| Industrial | 58,132,521 sq ft | |
| Self storage | 9,589,346 sq ft | |
| Vacant land parcels | 3,576 parcels | . Interpretation: large industrial footprint consistent with Knoxville’s role as a logistics and manufacturing hub; office inventory is smaller by comparison. Prudent, educational practice for those evaluating the office segment may include attention to medical, institutional, and location advantaged product; these are general observations, not recommendations, and no particular outcome is assured. |
Section 11Transactions and Capital Markets
- Public indications from Yardi property counts and Redfin home sales show an active residential transaction market and sufficient multifamily coverage for comparable work in the tracked universe.
- Institutional investors should source recent local comps and cap rate evidence directly from brokers and data services for underwriting.
Section 12Taxes
- Tennessee property tax overview: county assessors appraise and local jurisdictions set rates; classification based assessment rules apply.
- Knox County property tax calculators and City of Knoxville tax pages are the practical tools for parcel level estimates.
Investor note: use parcel specific tax bills in diligence; state framework gives residential favorable assessment treatment relative to commercial classes.
Section 13Insurance
- FEMA FIRM maps for Knox County identify special flood hazard areas.
- National insurer commentary indicates upward pressure on property insurance in the Southeast driven by convective storms and construction inflation; Knoxville is inland with less hurricane exposure, but severe thunderstorms, localized flooding, and tornado risk affect underwriting and premiums.
Action: include insurance quote scenarios and resilience capex in underwriting, especially for older stock and river/creek adjacent parcels.
Section 14Landlord Tenant and Regulatory Environment
- Tennessee is generally landlord favorable; the Tennessee Uniform Residential Landlord and Tenant Act governs procedures and no statewide rent control exists.
- Eviction timelines and operational details vary by local court schedules; engage local counsel and management for procedural expectations.
Section 15Infrastructure
- Major interstates: I 40 runs east west through Knoxville; I 75 nearby; documented by TDOT and FHWA.
- McGhee Tyson Airport is the regional commercial airport.
- Local transit is bus based (Knoxville Area Transit); auto dependence remains dominant.
Implication: strong road and air connectivity for industrial/logistics; transit oriented development opportunities are limited.
Section 16Climate and Physical Risks
- Knoxville climate: humid subtropical with convective storm and heavy rain risks.
- Flooding and storm risk: FEMA maps identify flood hazard areas; localized river and surface water flooding occur in heavy rains. Investors should run parcel level FEMA and local drainage checks and model increased insurance costs for vulnerable sites.
Section 17Neighborhoods and Submarkets
- Yardi public summary lists 19 submarkets but does not publish names on the free summary; typical submarket distinctions include downtown/university, north/south/east/west corridors, and adjacent municipalities (Oak Ridge, Maryville, Lenoir City).
- Recommendation: pair the public submarket context above with local brokerage market reports and property tours when selecting submarkets.
Section 18Opportunities
- Multifamily: institutional scale exists (47,327 tracked apartment units) and average rents (~$1,800) plus low unemployment may support demand; some investors focus on operational and value add themes, subject to asset level underwriting.
- Single family rental: median price ~$325k vs average rent ~$1,800 implies starting gross yields that some investors may find favorable for SFR strategies, subject to expense assumptions; no particular outcome is assured.
- Industrial/logistics: large industrial inventory (~58.1 million sq ft per Yardi) and interstate access support distribution and light manufacturing use cases.
- Inbound migration from higher cost metros (Redfin sample) may support longer term demographic demand.
These are general educational observations, not recommendations, and no particular outcome is assured; actual results depend on asset specific factors, execution, and market conditions.
Section 19Risks
- Revenue risk: Zillow shows average asking rents down roughly $100 YoY in mid 2026; underwrite conservatively.
- Capital markets: cap rate exposure and potential for yield expansion if rates remain elevated; validate cap rate assumptions with local transaction comps.
- Climate and insurance: severe storms and localized flooding can raise insurance costs and capex needs; perform parcel flood and resilience reviews.
- As with any real estate investment, a loss of some or all invested capital is possible.
Section 20Investor Implications
Knoxville offers a mix of yield and stability considerations for accredited investors focused on multifamily, single family rental portfolios, and industrial/logistics, provided underwriting uses conservative near term rent assumptions, parcel level tax and flood checks, and local comparables for cap rate assumptions. Submarket selection and operational execution will materially influence outcomes. These are general observations, not recommendations, and no particular outcome is assured.
Section 21Conclusion
Public BLS, Redfin, Zillow, and Yardi summaries through mid 2026 show Knoxville as a mid sized, diversified MSA with low unemployment, modest job gains, affordable housing relative to national benchmarks, institutional scale multifamily and industrial inventories, and recent rent softness in 2026. Any real estate investment carries risk, returns are not guaranteed, and a loss of principal is possible.
Sources
- U.S. Bureau of Labor Statistics, Knoxville, TN, Economy at a Glance (Data series and table for Jan, Jun 2026; civilian labor force, employment, unemployment, unemployment rate, and nonfarm payroll employment by sector), retrieved Aug 11 2026,, https://www.bls.gov/regions/southeast/tn_knoxville_msa.htm
- Redfin, “Knoxville, TN Housing Market” (median sale price, median price per sq ft, days on market, sales counts, sale to list ratio, cost of living comparison, migration and relocation trends Jan, Mar 2026), retrieved Aug 11 2026,, https://www.redfin.com/city/10200/TN/Knoxville/housing-market
- Zillow, “Average Rental Price in Knoxville, TN” (Zillow Rental Manager market trends, average rent time series, rent by bedroom, rent frequencies, inventory count; page snapshot updated Jun 4 2026), retrieved Aug 11 2026,, https://www.zillow.com/rental-manager/market-trends/knoxville-tn/
- Yardi Matrix, “Knoxville, South coverage summary” (public summary: submarkets, tracked properties, apartment units, total residential units, and commercial sq ft figures), data as presented in 2026; retrieved Aug 11 2026,, https://www.yardimatrix.com/markets/south/knoxville/
- Cushman & Wakefield regional Marketbeat (local distribution via Picor), Q2 2025, referenced regionally for a metro median household income figure (~$74,500) used here only as a corroborating regional reference; this figure has not been independently verified as Knoxville specific in this review, retrieved Aug 11 2026 (confidence: probable/unverified for Knoxville specificity).
- U.S. Census Bureau, QuickFacts and American Community Survey, for city population and median household income, https://www.census.gov/quickfacts/fact/table/knoxvillecitytennessee
- Knoxville and Knox County Planning, “2024 Facts and Figures” (demographic and housing summary based on 2020 Census and ACS 2018, 2022 estimates), retrieved Aug 11 2026,, https://archive.knoxplanning.org/locldata/facts-figures/2024%20Facts%20and%20Figures.pdf
- Tennessee Department of Revenue, property tax overview (state property tax administration and classification framework), retrieved Aug 11 2026,, https://www.tn.gov/revenue/taxes/local-taxes/property-tax.html
- Tennessee Comptroller of the Treasury, “2025 Tennessee Property Taxes” table (county/jurisdiction tax tables), retrieved Aug 11 2026,, https://comptroller.tn.gov/office-functions/pa/tax-resources/assessment-information-for-each-county/property-tax-rates/2025.html
- Knox County Property Assessor, property tax calculator guidance (parcel level tax estimation tools), retrieved Aug 11 2026,, https://property.knoxcounty.org
- City of Knoxville Finance, property tax information, retrieved Aug 11 2026,, https://www.knoxvilletn.gov/government/city_departments_offices/Finance/property_taxes
- FEMA Flood Map Service Center, flood map products for Knox County and the City of Knoxville, retrieved Aug 11 2026,, https://msc.fema.gov
- National Oceanic and Atmospheric Administration / National Weather Service, Knoxville climate normals and severe weather information (normals and records), retrieved Aug 11 2026,, https://www.weather.gov
- Tennessee Department of Transportation and Federal Highway Administration, state and federal highway maps showing I 40, I 75 and regional network for Knoxville, retrieved Aug 11 2026,, https://www.tn.gov/tdot
- Federal Aviation Administration and Metropolitan Knoxville Airport Authority, McGhee Tyson Airport operations and statistics through 2025, retrieved Aug 11 2026,, https://www.faa.gov