In brief · summary: Lexington
Lexington is the core of the Bluegrass region and functions as both a university town and a diversified economic hub anchored by the University of Kentucky, regional healthcare systems, and advanced manufacturing. The city population is about 320,154 as of the 2023 estimate, and the median household income is about 67,631 dollars.
The metro labor market has grown through the first half of 2026, with total nonfarm payrolls rising from 298,400 in January to 306,100 in June and an unemployment rate of 4.8 percent. Housing has continued to appreciate at a moderate pace.
The Zillow typical home value reached about 336,762 dollars in June 2026, up 3.0 percent over the year, while Redfin reported a June median sale price of about 354,807 dollars, up 5.3 percent. Average asking rent is roughly 1,617 dollars. Together these signals point to a stable secondary market that some investors evaluate for institutional multifamily, single family rental, and industrial strategies because of a diversified employment base, student driven demand, and relative affordability versus many coastal and large Sun Belt metros.
Section 01Executive Summary
Lexington is the core of the Bluegrass region and functions as both a university town and a diversified economic hub anchored by the University of Kentucky, regional healthcare systems, and advanced manufacturing. The city population is about 320,154 as of the 2023 estimate, and the median household income is about 67,631 dollars. The metro labor market has grown through the first half of 2026, with total nonfarm payrolls rising from 298,400 in January to 306,100 in June and an unemployment rate of 4.8 percent.
Housing has continued to appreciate at a moderate pace. The Zillow typical home value reached about 336,762 dollars in June 2026, up 3.0 percent over the year, while Redfin reported a June median sale price of about 354,807 dollars, up 5.3 percent. Average asking rent is roughly 1,617 dollars. Together these signals point to a stable secondary market that some investors evaluate for institutional multifamily, single family rental, and industrial strategies because of a diversified employment base, student driven demand, and relative affordability versus many coastal and large Sun Belt metros.
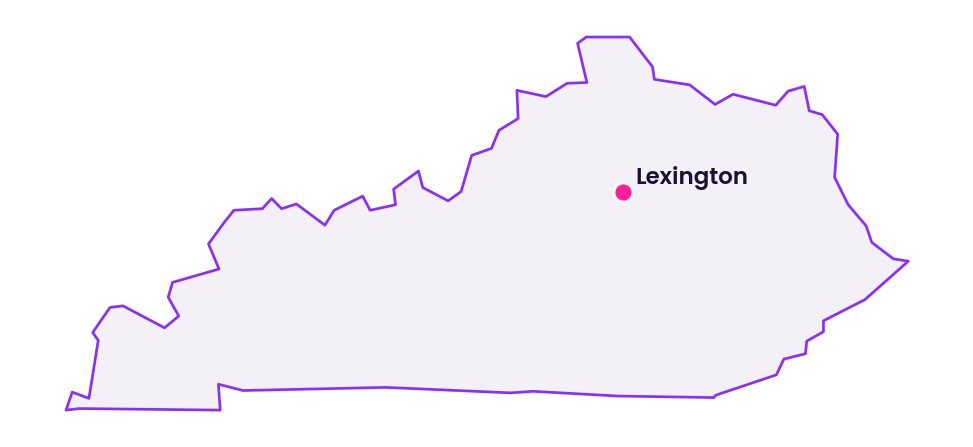
Section 02Population and Demographics
| Indicator | Value | Period | Source |
|---|---|---|---|
| City population, Lexington Fayette | 320,154 | 2023 estimate | U.S. Census Bureau QuickFacts |
| City population, Census count | 322,570 | April 2020 | U.S. Census Bureau |
| Median household income | 67,631 dollars | ACS 2019 to 2023 | U.S. Census Bureau |
Lexington Fayette Urban County is a consolidated city and county, which is the appropriate geography for most city level demographic work. The University of Kentucky contributes a steady cohort of students and early career households who support rental demand, and the city draws inbound interest from within Kentucky and surrounding states.
Section 03Jobs and Economic Anchors
| Labor market indicator, Lexington metro | Value | Period | Source |
|---|---|---|---|
| Total nonfarm payrolls | 306,100 | June 2026, preliminary | U.S. Bureau of Labor Statistics |
| Total nonfarm payrolls | 298,400 | January 2026 | U.S. Bureau of Labor Statistics |
| Civilian labor force | 283,300 | June 2026, preliminary | U.S. Bureau of Labor Statistics |
| Employment | 269,800 | June 2026, preliminary | U.S. Bureau of Labor Statistics |
| Unemployment | 13,600 | June 2026, preliminary | U.S. Bureau of Labor Statistics |
| Unemployment rate | 4.8% | June 2026, preliminary | U.S. Bureau of Labor Statistics |
The employment base is diversified and anchored by public and quasi public institutions, healthcare, advanced manufacturing and automotive suppliers, distribution and logistics, and government. These anchors support demand across multifamily, medical office, and industrial product types.
Section 04Major Employers
| Employer | Employees | Source |
|---|---|---|
| University of Kentucky | 26,846 | Commerce Lexington 2025 |
| Kentucky State Government | 11,210 | Commerce Lexington 2025 |
| Toyota Kentucky | 9,700 | Commerce Lexington 2025 |
| Fayette County Public Schools | 5,965 | Commerce Lexington 2025 |
| Baptist Health | 3,189 | Commerce Lexington 2025 |
| Amazon | 3,000 | Commerce Lexington 2025 |
| City of Lexington | 2,991 | Commerce Lexington 2025 |
| CHI Saint Joseph Health | 2,029 | Commerce Lexington 2025 |
| Veterans Medical Center | 2,000 | Commerce Lexington 2025 |
| Lexmark | 1,661 | Commerce Lexington 2025 |
Section 05Housing Values and Sales
| Metric | Value | Period | Source |
|---|---|---|---|
| Zillow typical home value | 336,762 dollars | June 2026 | Zillow |
| Typical home value, change over the year | 3.0% | June 2026 | Zillow |
| Median days to pending | 6 | June 2026 | Zillow |
| Redfin median sale price | 354,807 dollars | June 2026 | Redfin |
| Median sale price, change over the year | 5.3% | June 2026 | Redfin |
| Median days on market | 35 | June 2026 | Redfin |
| Sale to list ratio | 99.0% | June 2026 | Redfin |
| Homes sold | 1,211 | June 2026 | Redfin |
The ownership market is bifurcated, with smaller higher turnover product near campus and larger family housing in suburban neighborhoods, so single family rental strategies should be calibrated by neighborhood and school district.
Section 06Rents
| Metric | Value | Period | Source |
|---|---|---|---|
| Zillow average asking rent | 1,617 dollars | January 2026 | Zillow |
| Average asking rent, change over the year | 17 dollars | January 2026 | Zillow |
| Zillow market trends average rent | 1,551 dollars | 2026 | Zillow |
| Market trends rent, change over the year | 2.9% | 2026 | Zillow |
Rental demand is supported by the university and healthcare employers. Investors size submarket vacancy and effective rent with local operating partners and market reports during diligence.
Section 07Single Family and Multifamily Stock
Lexington housing stock mixes older single family near downtown and the university, suburban subdivisions, garden style apartments, newer midrise projects, and student oriented housing near campus. Student housing near the university is a particular focus area, so preleasing and student bed demand should be confirmed when underwriting near campus.
Section 08Commercial Real Estate and Retail Centers
Industrial benefits from interstate access and distribution demand, office performance favors medical, research, and modern amenitized space, and grocery anchored retail has generally been more resilient than non anchored centers. Investors validate cap rates, vacancy, and recent transaction comparables with local brokerage market reports.
Section 09Property Taxes
Fayette County real property tax rates for 2025 are expressed as dollars per 100 dollars of assessed value. The exact parcel rate depends on the tax district, so the district must be identified first.
| Levy component | Rate per 100 dollars | Source |
|---|---|---|
| Kentucky state | 0.106 | Fayette County PVA 2025 |
| Fayette County Public Schools | 0.798 | Fayette County PVA 2025 |
| LFUCG general service | 0.075 | Fayette County PVA 2025 |
| Extension services | 0.004 | Fayette County PVA 2025 |
| Health department | 0.024 | Fayette County PVA 2025 |
| LexTran | 0.060 | Fayette County PVA 2025 |
| Park fund | 0.023 | Fayette County PVA 2025 |
| Full service urban add on | 0.173 | Fayette County PVA 2025 |
| Tax district | Total real property rate per 100 dollars | Source |
|---|---|---|
| District 1 | 1.264 | Fayette County PVA 2025 |
| District 2 | 1.091 | Fayette County PVA 2025 |
| District 3 | 1.228 | Fayette County PVA 2025 |
| District 4 | 1.118 | Fayette County PVA 2025 |
| District 5 | 1.255 | Fayette County PVA 2025 |
| District 6 | 1.127 | Fayette County PVA 2025 |
| District 7 | 1.237 | Fayette County PVA 2025 |
| District 8 | 0.015 | Fayette County PVA 2025 |
| District 9 | 0.106 | Fayette County PVA 2025 |
Model parcel specific tax liabilities and stress for assessment adjustments after acquisition.
Section 10Insurance
FEMA flood insurance rate maps identify flood hazard zones in Lexington and Fayette County, and parcel level flood designations should be checked through FEMA or local planning resources. Property insurance costs have risen with replacement costs and weather related losses, so property specific quotes should be obtained early in diligence and premium inflation modeled.
Section 11Landlord Tenant and Regulatory Environment
Kentucky landlord tenant statutes apply in Lexington Fayette Urban County, and state law does not impose rent control. Eviction procedures and notice requirements follow state civil procedure. The environment is generally landlord friendly, and responsible property management and community relations remain important.
Section 12Infrastructure
Lexington sits at the junction of Interstate 64 and Interstate 75, with additional state routes maintained by the Kentucky Transportation Cabinet. Blue Grass Airport serves the region, and Lextran operates local bus service. Most residents rely on private vehicles, so car accessible locations are a priority for most product types.
Section 13Climate and Physical Risks
The climate includes convective storms, hail, localized flooding, and occasional winter weather. FEMA maps and local drainage studies inform flood exposure and resilience capital planning.
Section 14Neighborhoods and Submarkets
Common submarket distinctions include downtown, the university area, north, south, and the suburban corridors. Investors pair public context with on the ground broker calls and property tours to validate micromarket dynamics.
Section 15Opportunities
- Multifamily: demand anchored by the university, healthcare, and regional employers may support core plus and value add strategies near campus and employment corridors.
- Single family rental and build to rent: moderate prices and a sustained rental pool may support these strategies in family oriented neighborhoods.
- Industrial and logistics: highway connectivity and regional distribution demand may favor modern logistics assets near interchanges.
- Retail and mixed use: grocery anchored centers and urban infill retail may perform comparatively better where local demographics and traffic support them.
These are general educational observations, not recommendations, and no particular outcome is assured. Actual results depend on asset specific factors, execution, and market conditions.
Section 16Risks
- Supply risk: student housing and urban multifamily pipelines can create localized oversupply, so permits and pipeline counts should be verified.
- Capital markets: cap rate sensitivity to interest rates and investor sentiment requires stress testing of exit assumptions.
- Climate and insurance: storm and flood exposure can raise insurance and capital expenditure needs.
- As with any real estate investment, a loss of some or all invested capital is possible.
Section 17Investor Implications
Lexington offers potential diversification benefits as a university anchored, mid sized market with a balanced employment base and moderate valuations. Investors should emphasize conservative rent growth assumptions, parcel specific tax and flood analysis, submarket level supply checks, and local operating partners. These are general observations, not recommendations, and no particular outcome is assured.
Section 18Conclusion
Lexington is a secondary market with demand drivers from education, healthcare, manufacturing, and regional distribution. Moderate home value and rent growth through mid 2026, a 4.8 percent unemployment rate, and a large institutional employment base make it a market that some investors evaluate for multifamily, single family rental, and industrial strategies. Any real estate investment carries risk, returns are not guaranteed, and a loss of principal is possible.