In brief · summary: Louisville
Louisville is the largest city in Kentucky and the logistics hinge of the Ohio Valley, anchored by the UPS Worldport air cargo hub at Louisville Muhammad Ali International Airport. The consolidated city, formally the Louisville and Jefferson County metro government balance, held about 640,796 residents as of the Census Bureau estimate for July 1, 2024, inside a metropolitan statistical area of roughly 1,402,509 people as of 2025. Brokers describe this as a steady, low volatility market, and the data supports that framing.
The metro unemployment rate measured 5.2% in June 2026, total nonfarm employment stood near 714,000, and both housing and most commercial sectors are characterized by disciplined supply and firm demand rather than boom conditions. The asset class picture is uneven in an instructive way. Retail is the standout, with metro shopping center vacancy near 3.5% to 4.4%, among the tightest in the nation, driven by grocery anchored expansion from Kroger, Publix, and BJ's Wholesale Club.
Industrial is healthy, with vacancy near 5.6% pushed up temporarily by speculative deliveries while asking rents rose more than 7% over the year to about $6.71 per square foot. Multifamily is stable, with average rent near $1,212 per month, occupancy near 92.5%, and a thinning construction pipeline that points toward tightening. Office is …
Section 01Executive Summary
Louisville is the largest city in Kentucky and the logistics hinge of the Ohio Valley, anchored by the UPS Worldport air cargo hub at Louisville Muhammad Ali International Airport. The consolidated city, formally the Louisville and Jefferson County metro government balance, held about 640,796 residents as of the Census Bureau estimate for July 1, 2024, inside a metropolitan statistical area of roughly 1,402,509 people as of 2025. Brokers describe this as a steady, low volatility market, and the data supports that framing. The metro unemployment rate measured 5.2% in June 2026, total nonfarm employment stood near 714,000, and both housing and most commercial sectors are characterized by disciplined supply and firm demand rather than boom conditions.
The asset class picture is uneven in an instructive way. Retail is the standout, with metro shopping center vacancy near 3.5% to 4.4%, among the tightest in the nation, driven by grocery anchored expansion from Kroger, Publix, and BJ's Wholesale Club. Industrial is healthy, with vacancy near 5.6% pushed up temporarily by speculative deliveries while asking rents rose more than 7% over the year to about $6.71 per square foot. Multifamily is stable, with average rent near $1,212 per month, occupancy near 92.5%, and a thinning construction pipeline that points toward tightening. Office is the clear weak spot, with overall vacancy near 22.1% and downtown Class A vacancy near 28.9%. Single family housing remains affordable and competitive, with the Zillow home value near $264,957. Kentucky imposes no rent control, property is assessed at full market value but taxed at relatively low combined rates, and physical risk is dominated by Ohio River flooding and tornado exposure rather than coastal catastrophe. The market reads as a defensive, income oriented Midwest and Upper South play with a concentrated logistics economy that is both its strength and its principal risk.
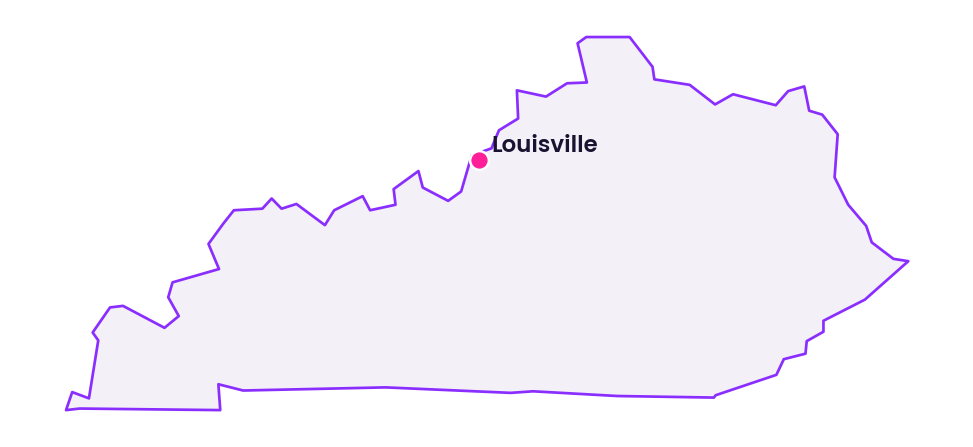
Section 02Population and Migration
Louisville's population picture depends heavily on which geography is used, so scope matters. The consolidated city, the Louisville and Jefferson County metro government balance, is the most relevant unit for the urban core and held about 640,796 residents as of the Census Bureau Population Estimates Program vintage for July 1, 2024, up 1.4% from its April 2020 base of 631,890. Jefferson County as a whole, which includes independent suburban cities within its borders, held roughly 793,881 residents per the Census Bureau July 1, 2024 estimate. The full metropolitan statistical area, which spans several Kentucky and Southern Indiana counties, reached about 1,402,509 residents in 2025 according to Census Bureau data reported through the Federal Reserve. The following table sets these three geographies side by side.
| Geography | Population | Data date | Source basis |
|---|---|---|---|
| Louisville metro government balance | 640,796 | Jul 1, 2024 | Census PEP |
| Jefferson County | 793,881 | Jul 1, 2024 | Census PEP |
| Metro area | 1,402,509 | 2025 | Census, via FRED |
The migration pattern is one of gradual suburbanization within a slowly growing metro. The core city has seen essentially flat to slightly negative annual change while the surrounding metro counties absorb growth, a common Midwest and Upper South dynamic. The metro median age was about 39.4 years in 2024, older than fast growing Sun Belt markets, which signals a settled, family oriented population rather than a churn of transient young renters. For an investor, the takeaway is modest but positive metro growth with demand shifting outward toward suburban Jefferson County and Southern Indiana, which favors suburban multifamily, single family rental, and grocery anchored retail over speculative urban core bets.
Section 03Jobs and Economic Anchors
Louisville's labor market is large, diversified across logistics, manufacturing, and health care, and currently cooling modestly. Total nonfarm employment in the metro measured about 714,000 in June 2026, not seasonally adjusted, down roughly 0.5% over the year, and the metro unemployment rate was 5.2% in June 2026, both per the Bureau of Labor Statistics and the Federal Reserve Bank of St. Louis. That unemployment reading sits above the national average and above peer Midwest metros, a point of caution that reflects the market's exposure to cyclical logistics and manufacturing employment.
The defining economic anchor is logistics. UPS operates its global air hub, Worldport, at the Louisville airport, and local reporting placed its Louisville payroll at about 20,854 people, making UPS the single largest employer in the city. This concentration is a double edged sword, because UPS has announced plans, as reported by local media, to cut roughly 30,000 positions nationally during 2026 and continues to automate its network, which introduces a real concentration risk to the local economy. Beyond UPS, the manufacturing base is substantial. Ford operates the Kentucky Truck Plant and the Louisville Assembly Plant, GE Appliances runs its Appliance Park headquarters and manufacturing complex, and Humana, a Fortune 500 health insurer, is headquartered downtown. Norton Healthcare and University of Louisville Health anchor a large hospital sector. The investor conclusion is that Louisville offers genuine economic diversification across three pillars, logistics, automotive manufacturing, and health care, but the outsized role of UPS and the automotive plants makes the market more cyclically exposed than a services led metro, and the announced UPS reductions warrant close monitoring.
Section 04Income
Household incomes in Louisville are moderate, sitting near the Kentucky norm at the city level and somewhat higher across the broader metro. The following table compares the three geographies using the most recent public estimates.
| Geography | Median household income | Per capita income | Poverty rate |
|---|---|---|---|
| Louisville metro balance (city) | $64,731 | $39,683 | about 11.8% of families |
| Jefferson County | $67,849 | about $38,890 | 14.3% |
| Metro area | $71,737 | about $40,556 | 12.3% |
The city and county median household incomes are the Census QuickFacts American Community Survey 2019 to 2023 estimates, the metro median reflects the corresponding survey metro estimate, and the per capita and poverty figures carry the survey's usual scope caveats. The gap between the city median household income of $64,731 and the metro median of $71,737 reflects the concentration of higher income households in the suburban ring and the Southern Indiana counties. The city median owner occupied home value of $233,900 and median gross rent of $1,120 per month, both from the American Community Survey, underline Louisville's affordability, with a price to income relationship far more favorable than coastal gateway markets. For a rental investor, moderate incomes support steady workforce and moderate rate apartment demand, while the elevated county poverty rate near 14.3% signals meaningful income dispersion that calls for disciplined tenant screening and professional management in workforce assets.
Section 05Housing and Multifamily
The multifamily market entered 2026 on stable footing, which local brokers characterize as a steady performer rather than a high growth story. According to MMG Real Estate Advisors, the Louisville average apartment rent was about $1,212 per month in the first quarter of 2026, occupancy stood at 92.5%, and net absorption over the trailing four quarters was about 1,805 units, a healthy demand figure. Yardi Matrix tracks roughly 97,573 apartment units across 564 properties and 27 submarkets in the market, providing scale for institutional strategies. The following table summarizes the apartment picture using first quarter 2026 data.
| Metric (Louisville multifamily) | Value | Period | Source |
|---|---|---|---|
| Average monthly rent | $1,212 | Q1 2026 | MMG |
| Occupancy | 92.5% | Q1 2026 | MMG |
| Net absorption, trailing 4 quarters | +1,805 units | Q1 2026 | MMG |
| Units under construction | 3,524 | Q1 2026 | Commercial Kentucky |
| Units delivered, prior year | 3,995 | Q1 2026 | Commercial Kentucky |
The forward setup is constructive. With about 3,995 units delivered over the prior year and 3,524 under construction against more than 14,204 units merely planned, the pipeline is moderating from its recent peak, which should allow steady renter demand to absorb existing inventory and support tightening occupancy and firmer rent growth. Occupancy near 92.5% implies vacancy near 7.5%, elevated by recent lease up but not distressed, and one industry roundtable placed metro multifamily vacancy nearer 6.5%, better than a national figure near 8%. The investor conclusion is that Louisville apartments are a defensive income asset with modest but improving rent growth prospects as supply thins, well suited to buyers seeking durable cash flow rather than rapid appreciation.
Section 06Rents
Apartment rents in Louisville are affordable and growing at a measured pace. The average asking rent near $1,212 per month in the first quarter of 2026 sits well below coastal and Sun Belt gateway levels and reflects the market's low cost of living. The American Community Survey places the city median gross rent at about $1,120 per month, a figure that captures the full stock of older units and therefore runs below asking rents in newer institutional product. Forecasts cited by local brokers point to rent growth in the range of 2.5% to 3.0% per year as the construction pipeline recedes and demand absorbs available inventory, a pace that outpaces the national forecast.
The direction of travel is the key underwriting input. After the supply heavy years of the early decade pressured rent growth, the sharp drop in new construction starts is expected to restore pricing power to owners of existing stabilized product. For an income investor, low single digit rent growth assumptions are defensible here, and the spread between newer product asking rents near $1,212 and the census median gross rent near $1,120 leaves room for value add operators to renovate older assets toward the market ceiling, provided the local income base supports the resulting rent. Aggressive escalator assumptions would be inappropriate in a market this affordable and this stable.
Section 07Vacancy
Vacancy conditions in Louisville vary sharply by property type, and the contrast is the most important structural feature of the market. Retail is exceptionally tight, with metro shopping center vacancy near 3.5% in 2025 tracking data and near 4.4% in first quarter 2026 tracking, either way among the lowest in the nation and well below national benchmarks near 5.9%. Industrial vacancy rose to about 5.6% by the second quarter of 2026, but that increase was driven by newly delivered speculative buildings rather than demand loss, with the availability rate near 7.7%. Multifamily vacancy near 7.5% implied by 92.5% occupancy is elevated by lease up but not distressed. Office is the outlier, with overall vacancy near 22.1% and downtown Class A vacancy near 28.9%, reflecting structural challenges in the urban core office stock.
The single family for sale market shows the opposite of a vacancy problem, namely tight but easing inventory, with active listings up nearly 29% year over year in June 2026 even as homes continued to sell faster than the national average. The investor conclusion is that Louisville is a tale of two markets, with retail and industrial demand comfortably absorbing supply and multifamily on a tightening path, while office suffers from a genuine oversupply of obsolete space. Capital should follow the tight sectors and avoid the office overhang except in special situations involving conversion or deeply discounted basis.
Section 08Supply Pipeline
Supply discipline is the dominant theme across most property types, with the notable exception of speculative industrial and, historically, downtown office. In multifamily, deliveries of about 3,995 units over the prior year are giving way to a moderating pipeline of 3,524 units under construction, and the sharp national decline in apartment starts is expected to tighten the market over the next two years. In retail, new development has slowed to roughly 40% below the historical average, with only about 322,000 square feet under construction across the metro and that space already about 97% preleased, an extraordinarily supply constrained condition that hands pricing power to owners of existing centers.
Industrial is the one sector where supply has been aggressive. Developers delivered about 2.4 million square feet of speculative space across six buildings in a single recent quarter, and the amount under construction stood near 5.1 million square feet in CBRE tracking, with local brokerage estimates as high as 6.5 million square feet, much of it speculative. This new supply is the direct cause of the temporary rise in industrial vacancy, and it means investors should expect near term vacancy pressure until the space leases up. The investor conclusion is that Louisville is broadly a supply disciplined market, which supports rents and occupancy in retail and multifamily, while the industrial pipeline requires more careful timing given the volume of unleased speculative deliveries.
Section 09Single Family Homes
The single family market is affordable, competitive, and gradually rebalancing toward buyers. The Zillow home value for the city was about $264,957 in mid 2026, up about 1.0% over the year, while the metro median list price was about $322,000 in June 2026, down about 1.0% from a year earlier, and Jefferson County median sale prices ran near $271,000. Homes were selling in roughly 36 to 40 days, faster than the national pace but slower than the frenzied conditions of prior years, and active listings jumped nearly 29% year over year, giving buyers more choice. The following table summarizes the key housing indicators and their scope.
| Indicator | Value | Scope | Source |
|---|---|---|---|
| Zillow Home Value Index | $264,957 | city, mid 2026 | Zillow |
| Metro median list price | $322,000 | metro, Jun 2026 | Realtor.com |
| ACS median owner value | $233,900 | city, 2024 5 year | Census |
| Median days on market | 36 to 40 | city and metro, 2026 | Redfin, Realtor.com |
The single family rental angle is attractive in this context. With a city median home value near $264,957, a census median gross rent near $1,120, and county incomes near $67,849, homes remain relatively attainable and rental yields are more workable than in overheated coastal markets, where prices have decoupled from local incomes. The affordability that keeps ownership within reach also sustains a deep renter pool of households not yet ready to buy, and the recent rise in for sale inventory gives single family rental and build to rent operators more acquisition opportunities than existed during the inventory drought. The investor conclusion is that Louisville single family is a value and yield play rather than an appreciation play, best approached as a long hold given affordable pricing, steady demand, and a rebalancing that favors patient buyers.
Section 10Commercial Real Estate and Retail Centers
Commercial fundamentals diverge sharply by asset class, and the reported figures reflect real underlying conditions rather than mere measurement noise. The following table summarizes the three sectors using the most recent CBRE and Cushman and Wakefield data.
| Asset class | Vacancy | Asking rent | Period and source |
|---|---|---|---|
| Industrial | 5.6% | $6.71 NNN | Q2 2026 CBRE |
| Office (all classes) | 22.1% | $19.27 | Q2 2026 CBRE |
| Retail (shopping center) | 3.5% to 4.4% | $17.42 to $18.47 | 2025 to Q1 2026 CoStar, Cushman |
Retail is the strongest sector and one of the tightest in the country. Metro shopping center vacancy near 3.5% to 4.4%, well below the national benchmark, is driven by grocery anchored and needs based expansion, with Kroger deepening its footprint, Publix backfilling former Walmart Neighborhood Market boxes, and BJ's Wholesale Club expanding. Asking rents near $17.42 to $18.47 per square foot are affordable, and the roughly 322,000 square feet under construction is about 97% preleased, so landlords of existing grocery anchored centers hold substantial pricing power. Industrial is healthy despite the temporary vacancy uptick, with second quarter 2026 vacancy near 5.6%, asking rent near $6.71 per square foot up more than 7% over the year, and nearly 740,000 square feet of positive net absorption in the quarter, all reflecting Louisville's role as a national logistics hub. Office is the clear weak point, with overall vacancy near 22.1%, downtown Class A vacancy near 28.9%, and suburban Class A near 19.5%, even as overall asking rents near $19.27 held at record levels for the better quality space. The investor conclusion is to favor grocery anchored retail and well located logistics industrial, to time industrial acquisitions around the speculative supply wave, and to avoid commodity office absent a conversion thesis or a deeply discounted basis.
Section 11Transactions and Capital Markets
Transaction activity in Louisville has been steady but measured, consistent with the market's steady performer reputation and the national repricing under higher interest rates. In multifamily, investment volume showed modest activity with about 669 units sold in the first quarter of 2026 per local brokerage tracking, a restrained pace that reflects the wide gap between buyer and seller expectations rather than a lack of underlying interest.
In the commercial sectors, retail investment has been supported by the sector's exceptional occupancy, with national retail cap rates near 6.8% and Louisville's tight fundamentals arguing for pricing at or inside that level for quality grocery anchored product. Industrial pricing has held despite the vacancy uptick, given the strength of logistics demand and rent growth. The capital markets conclusion for an accredited investor is that Louisville sits in the same price discovery period affecting most secondary markets in 2026, with thinner volume and a persistent bid ask gap, but the assets that trade price at cap rates wider than primary coastal markets. That combination of wider yields, stable fundamentals, and a thinning apartment pipeline creates a constructive entry environment for patient, income focused capital, particularly in multifamily and grocery anchored retail.
Section 12Taxes
Kentucky's property tax structure differs meaningfully from many states and is generally favorable to owners on a rate basis. Real property is assessed at 100% of fair cash value, unlike states that assess at a fraction of market value, so the assessed base is the full market value rather than a discounted figure. Against that full base, the levied rates are relatively low. The Jefferson County property valuation administrator schedule shows a state rate of about $0.109 per $100 of assessed value and a Metro Louisville city rate of about $0.121 per $100, with additional levies for the Jefferson County Public Schools district, urban service districts, and special districts layered on top.
The structural features that matter for investors are that Kentucky caps the annual growth in property tax revenue that most districts may collect without a public recall process under the state's House Bill 44 framework, which moderates increases over time, and that assessment at full market value means acquisitions do not trigger the kind of dramatic tax uncapping seen in states that assess at a fraction of value and reset on sale. The practical implication is that Louisville property taxes are a moderate and predictable line item, and the correct underwriting approach is to apply the sum of the applicable state, city, school, and special district rates to the full assessed market value, confirming the specific district rates for the parcel's location rather than relying on a metro average.
Section 13Insurance
Property insurance in Louisville is a moderate cost input, higher than in the lowest risk interior markets because of genuine tornado, severe storm, and Ohio River flood exposure, but far below coastal catastrophe zones. No official public figure specific to the Louisville market is published at the city level for average homeowners or commercial property premiums, so a precise local number is not stated here. The relevant public reference points are the National Association of Insurance Commissioners homeowners insurance reports and state filings, which place Kentucky in a middle band nationally, with premiums driven principally by wind, hail, tornado, and flood perils rather than hurricane or wildfire.
The most important insurance related diligence item in this market is flood exposure. Louisville sits on the Ohio River, and the Louisville and Jefferson County Metropolitan Sewer District operates an extensive flood protection system of floodwalls, levees, and pumping stations that shields much of the urban core, but properties in the mapped floodplain or in areas subject to urban flooding may require flood coverage and can carry materially higher costs. Tornado and severe convective storm exposure across the Ohio Valley also supports somewhat higher wind and hail premiums than in calmer regions. The investor conclusion is that insurance is manageable and stable relative to coastal markets, but that flood zone verification for each target property, using the Metropolitan Sewer District floodplain maps and the applicable FEMA panels, is an essential step before closing.
Section 14Landlord Tenant and Regulatory Environment
Kentucky is a landlord favorable state, and Louisville, importantly, is one of the jurisdictions that has adopted the state's optional Uniform Residential Landlord and Tenant Act, so the statutory framework applies here in full. There is no rent control anywhere in Kentucky, because the state has never authorized local governments to enact it and no state statute exists, which means owners may set and raise rents freely with proper notice. Security deposits carry no statutory cap on amount, though in Louisville as an adopting jurisdiction the deposit must be held in a separate dedicated account whose location and account number are disclosed to the tenant, and the landlord must provide itemized damage listings at both move in and move out. The deposit, or an itemized statement of deductions with any balance, must be returned within 30 days of the tenancy ending under the framework of Kentucky Revised Statutes section 383.580, and wrongful withholding can expose the landlord to the tenant's costs and attorney fees.
Eviction for nonpayment begins with a seven day written notice to pay or vacate under Kentucky Revised Statutes section 383.660, and that notice carries a mandatory cure right, meaning the landlord must accept full payment made within the seven day window. Curable lease violations require a written notice with a cure period, and termination of a month to month tenancy requires 30 days written notice under section 383.695. The investor conclusion is that the regulatory environment is predictable and favorable to owners, with no rent regulation and no deposit cap, while the specific account segregation, disclosure, and damage listing requirements that apply in Louisville demand disciplined property management to preserve the right to retain a deposit.
Section 15Infrastructure
Louisville's infrastructure is a genuine competitive advantage and the foundation of its logistics economy. The UPS Worldport facility at Louisville Muhammad Ali International Airport is one of the largest automated air cargo sorting hubs in the world, and the airport's cargo throughput places the region among the top air freight gateways in the country. Three interstate highways, Interstate 64, Interstate 65, and Interstate 71, converge in the metro, giving trucking access to a large share of the United States population within a day's drive, and the Ohio River provides barge and port capacity for bulk freight. Recent additions to the Ohio River bridge network improved cross river connectivity to Southern Indiana, which is part of the same metro and industrial market.
Beyond freight, the metro benefits from the Ford and GE Appliances manufacturing complexes, established utility and water capacity from the Ohio River system, and a stable municipal services base. For an investor, the infrastructure picture directly underwrites the strength of the industrial and logistics sector and supports continued distribution and manufacturing demand, while the abundant fresh water access from the Ohio River is a long term structural advantage relative to water constrained regions of the country. The connectivity that makes Louisville a national parcel and freight hub is the single most durable pillar of its real estate demand.
Section 16Climate and Physical Risks
Louisville carries meaningful but manageable physical risk, higher than the lowest risk interior markets, dominated by flooding and severe weather rather than coastal catastrophe. The Federal Emergency Management Agency National Risk Index version 1.20, released in December 2025, rates Jefferson County as Relatively High with a composite score near 98.3, the highest ranked county in Kentucky, a rating driven by riverine flooding along the Ohio River, tornado and severe storm frequency in the Ohio Valley, and the social vulnerability and asset density of a large urban county. The following table summarizes the principal hazards.
| Hazard | Assessment | Source |
|---|---|---|
| Riverine flooding (Ohio River) | Primary hazard; extensive floodwall and pumping protection for the urban core | Louisville MSD, hazard mitigation plan |
| Tornado and severe convective storm | High Ohio Valley frequency; principal wind and hail loss driver | Louisville hazard mitigation plan |
| Composite FEMA National Risk Index | Relatively High, score near 98.3, state rank first of 120 | FEMA NRI v1.20 |
| Earthquake (New Madrid seismic zone) | Low to moderate; the highest hazard lies to the west in far western Kentucky | FEMA, USGS |
The important nuance for investors is that the Relatively High rating is driven substantially by riverine flood exposure and population density rather than by an unmanageable peril profile, and the Louisville and Jefferson County Metropolitan Sewer District operates one of the more robust urban flood protection systems in the country, which shields much of the developed core. The practical conclusion is that Louisville is not a coastal catastrophe market and faces no hurricane or wildfire risk, but flood exposure is real and property specific, so flood zone verification against the Metropolitan Sewer District maps and FEMA panels is the single most important physical risk diligence step, and tornado and hail exposure should be reflected in insurance and construction assumptions.
Section 17Neighborhoods and Submarkets
The metro spans a wide range of submarkets from the urban core to affluent eastern suburbs and growing southern and cross river areas. The East End, including the affluent suburbs along the river corridor and the Jeffersontown area, anchors the higher income residential and suburban office and retail demand. The South End and the Okolona and Jeffersontown submarkets lead multifamily pipeline activity and offer workforce and moderate rate rental demand, and local brokers identify Okolona and Jeffersontown as the leaders in future apartment construction. Downtown and the adjacent NuLu and Highlands districts carry the urban core office challenges alongside pockets of walkable residential and retail demand. Southern Indiana, across the Ohio River but within the same metro and industrial market, has absorbed significant logistics and residential growth.
For rental strategy, the southern and eastern suburban submarkets offer the deepest workforce renter pools and the strongest pipeline activity, while grocery anchored retail demand is broadly distributed across the suburban trade areas where Kroger, Publix, and BJ's are expanding. The urban core is best approached selectively, given the office overhang, with opportunity concentrated in walkable mixed use nodes rather than commodity downtown product. The investor conclusion is to match product to submarket, targeting workforce multifamily and single family rental in the southern and suburban tiers, grocery anchored retail across the suburban ring, and logistics industrial near the airport and interstate corridors, while treating the downtown office core with caution.
Section 18Opportunities
The clearest opportunity is grocery anchored and necessity retail, where metro vacancy near 3.5% to 4.4% is among the tightest in the nation, new supply is roughly 40% below historical norms and about 97% preleased, and expanding grocers underwrite durable anchor demand. Owners of existing centers hold real pricing power in a market with almost no speculative competition. The second opportunity is workforce and moderate rate multifamily acquired into a thinning construction pipeline, where steady absorption near 1,805 units over the trailing year and a moderating supply outlook point toward tightening occupancy and firmer rent growth over the next two years, available at cap rates wider than primary coastal markets.
Logistics industrial is a third opportunity, supported by the UPS Worldport hub, three converging interstates, and Ohio River freight, with the important caveat that the current speculative supply wave requires patient timing to acquire at the right basis as new buildings lease up. Single family rental and build to rent capitalize on Louisville's affordability, with a city home value near $264,957 and rising for sale inventory giving operators more acquisition options. The unifying opportunity thesis is that Louisville offers wider yields than primary markets, exceptional retail and improving multifamily fundamentals, a favorable regulatory and tax regime, and no coastal catastrophe exposure, a combination well suited to defensive, income oriented capital.
Section 19Risks
The primary risk is economic concentration in logistics and manufacturing. UPS is the single largest employer at about 20,854 local jobs and has announced roughly 30,000 national position cuts during 2026 alongside continued automation, which poses a genuine downside risk to local employment and to the industrial and residential demand that logistics supports. The Ford and GE Appliances plants add cyclical automotive and durable goods exposure that would amplify a manufacturing downturn. The metro unemployment rate of 5.2% in June 2026, above the national average, already signals a softer labor market than peer metros.
The second risk is the office sector, where overall vacancy near 22.1% and downtown Class A vacancy near 28.9% reflect structural obsolescence that will pressure valuations and could weigh on the downtown tax base and urban core vitality. The third is the near term industrial supply wave, with several million square feet of speculative space delivering into the market and pushing vacancy up until it leases. Additional risks include Ohio River flood exposure that requires property specific diligence despite the Metropolitan Sewer District's protection system, tornado and severe storm exposure that raises insurance costs, and the elevated county poverty rate near 14.3% that demands careful underwriting in workforce housing. Data measurement risk is also present, as commercial figures vary across CBRE, Cushman and Wakefield, Colliers, and CoStar depending on footprint and definitions. None of these risks is disqualifying, but the UPS and manufacturing concentration in particular should be explicitly stress tested rather than assumed away.
Section 20Investor Implications
For an accredited investor weighing Louisville against a South Florida baseline, the trade is lower growth and greater economic concentration in exchange for wider yields, a far friendlier regulatory and tax regime, and much lower insurance and coastal catastrophe risk. Louisville's cap rates across multifamily and retail sit wider than stabilized South Florida product, its property insurance is a moderate and stable line item rather than a valuation impairing cost that has repriced dramatically in the Florida market, and Kentucky's absence of rent control and its full market value assessment without sale triggered tax uncapping create a predictable ownership environment. What Louisville gives up is the population and rent growth ceiling of a high migration Sun Belt gateway, and it carries a concentrated logistics economy that South Florida's more diversified base does not.
The practical positioning is income first, with conservative low single digit rent growth assumptions, explicit stress testing of the UPS and manufacturing concentration, property specific flood diligence using the Metropolitan Sewer District maps, and professional management in workforce assets. Grocery anchored retail and workforce multifamily are the segments where fundamentals, supply discipline, and yield align most favorably, logistics industrial is attractive with careful timing around speculative supply, and single family rental capitalizes on affordability, while commodity downtown office should be avoided absent a conversion or deep value thesis. The present moment, with wider cap rates, a thinning apartment pipeline, and exceptional retail occupancy, offers a constructive entry window for patient, defensive capital comfortable with the market's cyclical logistics exposure.
Section 21Conclusion
Louisville is a stable, affordable, and logistically advantaged market that rewards income focused, long hold investors who are comfortable with a concentrated economic base. Its retail sector is among the tightest in the nation, its industrial market is fundamentally strong despite a temporary supply driven vacancy uptick, and its multifamily market is stable and on a tightening path as construction slows. Single family housing remains affordable and competitive, the regulatory and tax environment is favorable to owners, and physical risk, while real in the form of Ohio River flooding and tornado exposure, is manageable and far below coastal catastrophe levels. The clear weak spot is downtown office, and the clear structural risk is the outsized role of UPS and manufacturing in the local economy, underscored by the announced UPS workforce reductions and a metro unemployment rate above the national average.
The market will not deliver explosive growth, and its logistics concentration must be underwritten carefully. But for capital seeking wider yields than primary coastal markets, durable retail and improving multifamily fundamentals, and low insurance and catastrophe exposure, Louisville presents a defensible and attractive case at the present point in the cycle. As always, this analysis frames the opportunity and the risks so that decision makers can weigh them; it does not render a verdict, and every figure herein should be independently verified against the cited sources before any capital is committed.