In brief · summary: Nashville
Nashville has been one of the marquee growth stories of the American Sun Belt over the past decade, and in 2026 it presents investors with a classic late cycle setup: exceptional long run demand fundamentals working through a painful but receding wave of apartment oversupply. The consolidated city and county government of Nashville and Davidson County held an estimated 745,904 residents as of July 1, 2025, and the broader metro reached roughly 2,197,416, according to the U.S.
Census Bureau. The metro added about 36,567 residents in the year ending July 1, 2024, of which roughly 28,773 came from net migration, a demand engine that continues to draw both domestic movers and international arrivals to a region with no state income tax and a deep, diversified employment base.
The near term tension is supply. Nashville was among the most heavily built apartment markets in the country during the 2022 through 2024 window, and the digestion of that supply has pushed metro apartment rents into modest year over year decline, with Yardi Matrix reporting the average advertised asking rent at about 1,663 dollars through April 2026, down roughly 1.3 percent year over year, and city level indices showing steeper declines near 4 percent. Metro apartment vacancy has risen to roughly 8.5 percent, …
Section 01Executive Summary
Nashville has been one of the marquee growth stories of the American Sun Belt over the past decade, and in 2026 it presents investors with a classic late cycle setup: exceptional long run demand fundamentals working through a painful but receding wave of apartment oversupply. The consolidated city and county government of Nashville and Davidson County held an estimated 745,904 residents as of July 1, 2025, and the broader metro reached roughly 2,197,416, according to the U.S. Census Bureau. The metro added about 36,567 residents in the year ending July 1, 2024, of which roughly 28,773 came from net migration, a demand engine that continues to draw both domestic movers and international arrivals to a region with no state income tax and a deep, diversified employment base.
The near term tension is supply. Nashville was among the most heavily built apartment markets in the country during the 2022 through 2024 window, and the digestion of that supply has pushed metro apartment rents into modest year over year decline, with Yardi Matrix reporting the average advertised asking rent at about 1,663 dollars through April 2026, down roughly 1.3 percent year over year, and city level indices showing steeper declines near 4 percent. Metro apartment vacancy has risen to roughly 8.5 percent, a cyclical high, according to Northmarq. The crucial offsetting fact is that new construction is falling: units under construction fell to about 16,686 through April 2026, construction starts were down about 36 percent year to date, and multifamily permit issuance fell more than 50 percent in 2025. That declining pipeline is a current, measured condition; whether it produces an easing of competitive supply in 2027 and 2028, and whether Nashville's demand reasserts pricing power, is uncertain and cannot be predicted.
The commercial picture is mixed but tilts favorable. Industrial is tight at about 4.8 percent vacancy with strong absorption, retail is exceptionally healthy near 3.6 percent vacancy, and office, while elevated near 17.5 percent vacancy, is far healthier than the distressed large metro office markets and is seeing almost no new supply. Against these positives sit real frictions: some of the highest combined sales tax rates in the nation at 9.75 percent, a recordation tax on transfers, elevated property tax burdens on commercial and multifamily property assessed at 40 percent of value, and a genuine severe storm and tornado risk profile. This review develops each of these points with explicit figures and scope.
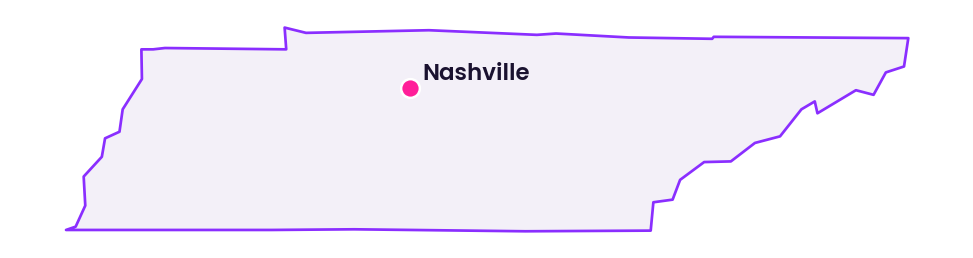
Section 02Population and Migration
Nashville operates under a consolidated metropolitan government, so the city and Davidson County are effectively the same jurisdiction, a distinction that matters when reading the data. The Census Bureau estimated the Nashville and Davidson metropolitan government balance at 721,074 as of July 1, 2025, and Davidson County as a whole at 745,904, up about 4.2 percent from the 2020 census. The core county has grown, but far more slowly than the surrounding metro, a pattern typical of a maturing urban core ringed by fast growing suburban counties such as Williamson, Rutherford, Sumner, and Wilson.
The metro is where the growth concentrates. The Nashville Davidson Murfreesboro Franklin metro reached an estimated 2,197,416 residents as of July 1, 2025, according to the Census Bureau. The components of change tell the story an investor cares about. In the most recent fully measured year, from July 2023 to July 2024, Census components of change data show the metro adding roughly 36,567 people, of which natural increase contributed about 7,888 and net migration about 28,773, split between net international migration of roughly 14,019 and net domestic migration of roughly 14,754. Over the cumulative period from April 2020 to July 2024, the metro added about 136,128 residents, with net migration of roughly 109,194 accounting for the overwhelming majority.
| Geography | Population | Scope and period | Source |
|---|---|---|---|
| Nashville and Davidson balance | 721,074 | July 1, 2025 estimate | U.S. Census Bureau, Vintage 2025 |
| Davidson County | 745,904 | July 1, 2025 estimate | U.S. Census Bureau, Vintage 2025 |
| Nashville metro | 2,197,416 | July 1, 2025 estimate | U.S. Census Bureau |
| Metro net migration | 28,773 | Year ending July 1, 2024 | U.S. Census Bureau |
For real estate demand, the reading is that migration, not natural increase, drives Nashville, and that migration is roughly balanced between domestic and international sources. That diversity of inflow tends to be more durable than a market reliant on a single migration channel, and it supports rental demand across the price spectrum even as the domestic move in pace has cooled from the frenzied early decade levels.
Section 03Jobs and Economic Anchors
The Nashville labor market is tight and broadly healthy. Metro total nonfarm employment reached about 1,207,400 jobs in June 2026, up roughly 18,600 jobs or 1.6 percent over the prior year, and the metro unemployment rate was about 3.3 percent that month, according to the Bureau of Labor Statistics. Job growth was led by leisure and hospitality, up about 10,000 jobs or 7.1 percent, professional and business services, up about 8,200 or 4.3 percent, and education and health services, up about 5,100 or 2.8 percent. Government and financial activities each shed jobs modestly over the year. Metro real gross domestic product was about 168.2 billion dollars in chained 2017 dollars in 2023, per the Bureau of Economic Analysis, the most recent figure available in that series.
The employment base is anchored by an unusually strong healthcare cluster that gives Nashville its identity as a national center of the industry. HCA Healthcare, ranked 60th on the Fortune 500, is headquartered in Nashville, as is Community Health Systems, and Vanderbilt University and its medical center are among the region's largest employers. Beyond healthcare, the region hosts Nissan North America and Bridgestone Americas in manufacturing, Dollar General and Tractor Supply in retail, and a growing roster of corporate relocations and expansions including Oracle, Amazon, AllianceBernstein, and Asurion. Tourism is a significant secondary anchor, with Nashville International Airport serving a record 25.7 million passengers in 2025 and metro hotels running about 67.0 percent occupancy at an average daily rate near 199.20 dollars.
| Sector | Employment | Year over year change | Scope and period | Source |
|---|---|---|---|---|
| Trade, transportation, utilities | 225,700 | not stated | Nashville metro, June 2026 | BLS |
| Professional and business services | 200,600 | up 8,200 | Nashville metro, June 2026 | BLS |
| Education and health services | 185,000 | up 5,100 | Nashville metro, June 2026 | BLS |
| Leisure and hospitality | 149,900 | up 10,000 | Nashville metro, June 2026 | BLS |
| Government | 126,500 | down 2,400 | Nashville metro, June 2026 | BLS |
The diversity across healthcare, manufacturing, logistics, finance, tourism, and technology relocations reduces the metro's dependence on any single industry and provides multiple, partly uncorrelated sources of housing and commercial demand, a meaningful risk mitigant for a real estate investor.
Section 04Income
Incomes in the metro run above the national line, though the core county sits closer to average. Nashville and Davidson County reported a median household income of about 77,853 dollars on the American Community Survey 2020 through 2024 five year basis, in 2024 dollars, with the metropolitan government balance slightly lower at about 77,371 dollars. The broader metro was considerably higher at about 88,800 dollars on the American Community Survey 2024 one year basis, roughly 10 percent above the national median of about 81,604 dollars, reflecting the affluence of the surrounding suburban counties, especially Williamson County to the south. Per capita income in Davidson County was about 50,640 dollars on the same five year basis, and the broader Bureau of Economic Analysis measure of per capita personal income for the metro was about 79,453 dollars in 2023.
Poverty follows the expected urban core pattern. The metropolitan government balance had a poverty rate of about 14.1 percent on the 2020 through 2024 basis, Davidson County about 12.2 percent, and the broader metro a lower 9.7 percent, well below the national figure near 12.2 percent. For rental underwriting, the takeaway is that suburban incomes support class A and single family rental demand, while the urban core carries a workforce housing population whose rent to income sensitivity has shown up clearly in the recent city level rent declines.
Section 05Housing and Multifamily
Davidson County contained about 389,379 housing units as of July 1, 2025, across roughly 324,907 households on the American Community Survey 2020 through 2024 basis. The county is unusually renter heavy for a Southern market, with an owner occupancy rate of only about 52.8 percent, which makes the core a fundamentally multifamily investment market. The median value of owner occupied homes in the county was about 417,400 dollars and the median gross rent about 1,582 dollars on that five year basis. On the apartment side, Yardi Matrix tracks a metro inventory of about 209,274 units across roughly 1,058 properties, one of the larger institutional apartment footprints in the Southeast relative to metro size.
No clean, reliable public figure isolates a city only apartment inventory or vacancy series, so apartment operating metrics throughout this review are metro level and labeled as such, with Davidson County Census figures used as the most defensible city proxy where needed. That is the same convention the professional market reports themselves use, and it is the honest way to present the data.
Section 06Rents
Metro apartment rents are in a shallow decline as the market absorbs its supply wave. Yardi Matrix reported an average advertised asking rent of about 1,663 dollars through April 2026 for the Nashville metro, down roughly 1.3 percent year over year, against a national figure that was up about 0.2 percent. The federal benchmark tells the same story of softening: the Department of Housing and Urban Development set the fiscal year 2026 Fair Market Rent for a two bedroom unit in the Nashville metro area at about 1,730 dollars, down from about 1,827 dollars in fiscal year 2025, a rare year over year decline in the federal rent standard that directly reflects the market reset.
City level indices show steeper softening than the metro. Apartment List put the Nashville city median rent across all unit sizes at about 1,358 dollars in July 2026, down about 4.0 percent year over year, with one bedroom units near 1,216 dollars and two bedroom units near 1,353 dollars. Zillow reported a Nashville average rent across all property types near 2,200 dollars in mid 2026, down about 4.4 percent year over year, a higher absolute figure because it includes single family rentals and larger units.
| Rent measure | Value | Year over year | Scope and period | Source |
|---|---|---|---|---|
| Average asking rent | $1,663 | down 1.3% | Nashville metro, April 2026 | Yardi Matrix |
| Fair Market Rent, two bedroom | $1,730 | down from $1,827 | Nashville metro, FY2026 | HUD |
| Median rent, all sizes | $1,358 | down 4.0% | City of Nashville, July 2026 | Apartment List |
| Average rent, all types | $2,200 | down 4.4% | Nashville, June 2026 | Zillow |
These measures are not directly comparable because each captures a different mix of units and methodology, but the direction is consistent and unambiguous: this is a renter's market in 2026, with concessions common and landlords lacking pricing power while the supply is digested.
Section 07Vacancy
Vacancy has risen to cyclical highs as deliveries have outrun even Nashville's strong absorption. Yardi Matrix reported metro stabilized occupancy of about 93.6 percent in March 2026, down about 40 basis points year over year, which implies a stabilized vacancy near 6.4 percent. Northmarq, using a broader measure that includes properties in lease up, reported metro vacancy of about 8.5 percent in the fourth quarter of 2025, described as a new cyclical high, with class A product higher at about 9.0 percent, the downtown submarket near 9.6 percent, and the tighter West Nashville submarket near 6.5 percent.
The gap between the stabilized occupancy figure and the all class vacancy figure quantifies the lease up drag from recently delivered units, and it is the single clearest indicator that Nashville is working through oversupply rather than suffering a demand shortfall. As the discussion of supply below makes clear, that drag reflects the timing of recent deliveries relative to a construction pipeline that is now shrinking.
Section 08Supply Pipeline
Supply is the defining variable in Nashville and it is now falling sharply, which is the crux of the forward looking investment thesis. The metro added roughly 35,900 apartment units since the start of 2023, an enormous wave relative to its size, and that surge is what pushed rents down and vacancy up. The pipeline is now shrinking quickly. Yardi Matrix reported units under construction of about 16,686 through April 2026, with only about 1,544 units delivered year to date and construction starts down roughly 36 percent year to date. Northmarq reported that full year 2025 deliveries fell to roughly 8,900 units, down about 24 percent from 2024, and that multifamily permit issuance fell more than 50 percent in 2025. Davidson County authorized about 5,632 total housing permits across all types in 2025 on the Census Building Permits Survey basis.
| Supply metric | Value | Scope and period | Source |
|---|---|---|---|
| Units added since 2023 | ~35,900 | Nashville metro, 2023 to 2026 | Yardi Matrix, Multi Housing News |
| Under construction | ~16,686 | Nashville metro, April 2026 | Yardi Matrix |
| 2025 deliveries | ~8,900 units | Nashville metro, full year 2025 | Northmarq |
| Construction starts | down ~36% | Nashville metro, 2026 year to date | Yardi Matrix |
| Multifamily permits | down more than 50% | Nashville metro, 2025 | Northmarq |
The figures above are historical and current market data, not forecasts. They show deliveries having peaked and starts and permits falling, which points to less new competition entering the market two to three years out, but whether competitive supply eases as some analysts anticipate, and whether Nashville's migration driven demand reasserts pricing power against a shrinking supply of new units, is uncertain and depends on economic and market conditions that cannot be predicted; no particular outcome is assured.
Section 09Single Family Homes
The for sale housing market has plateaued at a high level after years of rapid appreciation. Greater Nashville REALTORS, which reports across a nine county Middle Tennessee region, recorded a residential median price of about 520,000 dollars in July 2026 on roughly 2,627 closings, with active residential inventory of about 10,584 listings and median days on market near 54. The monthly path through 2026 shows a market that firmed into spring and softened modestly into summer, rising from about 485,598 dollars in January to a peak near 537,000 dollars in June before easing to 520,000 dollars in July.
| Month 2026 | Residential median price | Scope | Source |
|---|---|---|---|
| January | $485,598 | Greater Nashville region | Greater Nashville REALTORS |
| March | $491,525 | Greater Nashville region | Greater Nashville REALTORS |
| May | $525,000 | Greater Nashville region | Greater Nashville REALTORS |
| June | $537,000 | Greater Nashville region | Greater Nashville REALTORS |
| July | $520,000 | Greater Nashville region | Greater Nashville REALTORS |
Within the city itself, Redfin reported a median sale price of about 474,716 dollars over the three months ending May 2026, up only about 0.5 percent year over year, at about 275 dollars per square foot, with median days on market lengthening to about 70 from 58 a year earlier. Roughly a third of listings saw price drops and the sale to list ratio was about 97.6 percent, both signs of a market that has shifted toward buyers after years favoring sellers. The clear reading is that price growth has stalled under the weight of elevated mortgage rates and rebuilt inventory, though the absence of outright price declines suggests underlying demand remains firm.
The single family rental and build to rent angle is a real feature of the market, though clean public data isolating it is thin. Zillow's all property rent measure near 2,200 dollars captures the higher end of the rental spectrum that single family homes occupy, and the metro has attracted meaningful build to rent development interest. No reliable institutional public figure isolates Nashville build to rent rents or vacancy specifically, so an investor should treat vendor level build to rent claims with caution and rely on the broader rental data as the defensible proxy. The strategic point stands nonetheless: with a median home price above 500,000 dollars in the region and mortgage rates elevated, the pool of renters who want a house but cannot buy is deep, which supports single family rental demand.
Section 10Commercial Real Estate and Retail Centers
The commercial sectors are healthier in Nashville than in most large metros, though they vary widely. Office is the weakest but is far from the distress seen in gateway markets, industrial is tight and in demand, and retail is exceptionally strong.
In office, CBRE reported metro vacancy of about 17.5 percent in the second quarter of 2026, improved from about 18.8 percent two years earlier, with an average direct asking rent of about 37.16 dollars per square foot, up substantially from about 32.17 dollars in mid 2023. Net absorption was positive at about 351,000 square feet in the quarter and about 476,000 square feet year to date, and only about 295,000 square feet was under construction with no new deliveries in the quarter. Cushman and Wakefield reported a similar metro vacancy near 16.6 percent in the first quarter of 2026 and noted that new supply has essentially stopped, with Institutional Property Advisors projecting office inventory expansion of just 0.4 percent in 2026, the slowest pace since 2013. The Nashville office story is therefore one of a market healing through the absence of new supply and steady, if unspectacular, absorption, with a flight to quality favoring the newest downtown and urban core towers.
Industrial and logistics is the tightest commercial sector. CBRE reported metro industrial vacancy of about 4.8 percent in the second quarter of 2026, with an average asking rent of about 10.14 dollars per square foot, robust net absorption of about 1.8 million square feet in the quarter, and about 8.6 million square feet under construction across 26 properties against about 2.0 million square feet delivered in the quarter. Nashville's central location at the crossroads of interstates 40, 65, and 24, within a day's drive of a large share of the U.S. population, underpins durable demand from distributors and manufacturers.
Retail is arguably the healthiest sector of all. Matthews reported metro retail vacancy of about 3.6 percent in the first quarter of 2026, with an average asking rent of about 30.26 dollars per square foot, rent growth of about 4.2 percent, and retail cap rates near 6.3 percent, on quarterly investment volume of about 331 million dollars. Marcus and Millichap noted a bifurcation in which large box vacancy rose above 6 percent while small format space ran near 2 percent, and urban core retail vacancy fell below 5 percent as the wave of apartment absorption boosted foot traffic. Grocery anchored and necessity retail sit at the strong end of that spectrum, benefiting from population growth and tight new supply.
| Sector | Vacancy | Asking rent | Scope and period | Source |
|---|---|---|---|---|
| Office | 17.5% | $37.16 psf | Nashville metro, Q2 2026 | CBRE |
| Industrial | 4.8% | $10.14 psf | Nashville metro, Q2 2026 | CBRE |
| Retail | 3.6% | $30.26 psf | Nashville metro, Q1 2026 | Matthews |
Section 11Transactions and Capital Markets
Comprehensive, all sector transaction volume for the Nashville metro is largely proprietary, held within databases such as MSCI Real Capital Analytics and CoStar, so no clean public metro wide dollar total is available and it would be misleading to fabricate one. The one public, Nashville specific slice comes from Matthews, which reported retail investment volume of about 331 million dollars in the first quarter of 2026 at about 292 dollars per square foot, driven mainly by private buyers, with a trailing twelve month retail figure cited near 829 million dollars.
On pricing, the most reliable Nashville specific cap rate figure is the retail rate near 6.3 percent reported by Matthews. Secondary aggregators citing Marcus and Millichap and Cushman and Wakefield place Nashville multifamily cap rates near 5.6 percent and industrial near 7.5 percent, but these carry lower reliability and should be verified against primary reports. For national context, MSCI Real Capital Analytics reported trailing twelve month cap rates near 5.6 percent for apartments, 6.4 percent for industrial, 7.0 percent for retail, and 7.1 percent for central business district office as of spring 2026. The granular CBRE and Marcus and Millichap cap rate surveys broken out specifically for Nashville by property type are gated and proprietary, so the figures here are the best defensible public proxies and should be independently confirmed before any decision. The broad message is that cap rates have moved materially higher from cycle lows across all property types, repricing assets and constraining transaction activity relative to the 2021 and 2022 peak.
Section 12Taxes
Tennessee is a low tax state on income and a central part of Nashville's relocation appeal, but the burden shifts onto consumption and property. The state levies no personal income tax of any kind; the former Hall income tax on interest and dividend income was fully repealed effective January 1, 2021. The tradeoff is one of the highest sales tax burdens in the nation. The state sales tax rate is 7 percent, and with the local option rate Nashville and Davidson County reached a combined 9.75 percent effective February 1, 2025, after voters approved a half cent increase to fund transit. Tennessee's average combined state and local sales tax rate of about 9.61 percent is the second highest among the states. Tennessee also imposes a recordation tax on real estate transfers of about 0.37 dollars per 100 dollars of value under state law, a transaction cost that applies to commercial and multifamily transfers and should be built into acquisition and disposition modeling.
Property taxes are the other major cost, and their structure matters greatly for investors. Tennessee assesses residential and farm property at 25 percent of appraised value but commercial and industrial property, which includes larger multifamily assets, at 40 percent of appraised value, a meaningfully higher effective burden on income producing real estate. The Metro Nashville and Davidson County certified property tax rates run about 2.814 dollars per 100 dollars of assessed value in the Urban Services District and about 2.782 dollars in the General Services District. Because a commercial or multifamily property is assessed at 40 percent of its appraised value rather than 25 percent, the effective tax on a given market value is materially higher than the headline rate on a home implies, and periodic countywide reappraisals can produce sharp swings in assessed value. Tennessee law requires a revenue neutral certified rate after each reappraisal, but appraised values themselves can rise substantially in a fast appreciating market, so rising assessments are a real and recurring underwriting risk.
Section 13Insurance
Property insurance is a rising cost across Middle Tennessee, driven by severe convective storms, tornadoes, hail, and wind rather than coastal hurricane exposure. No current primary figure from the Tennessee Department of Commerce and Insurance or the Insurance Information Institute was located that states a precise statewide average homeowners premium, so a hard official number cannot be responsibly quoted here. Third party market guides estimate the Tennessee average homeowners premium in the range of roughly 3,045 to 3,085 dollars per year, about 17 percent above the national average, but these are vendor estimates rather than regulator data and should be treated as indicative only.
What is well established is the direction and the driver. Tennessee sits in a region of increasing tornado and severe storm frequency, and the state's costliest insured losses since 1980 are dominated by severe convective storm events. For multifamily and commercial owners, this means insurance has become a larger and more volatile expense line than in the past, and it should be stress tested and quoted specifically for any asset rather than assumed from a statewide average.
Section 14Landlord Tenant and Regulatory Environment
Tennessee is a landlord friendly jurisdiction, and Nashville falls under the state's more developed statutory framework. The Tennessee Uniform Residential Landlord and Tenant Act, codified at Title 66, Chapter 28 of the Tennessee Code, governs residential tenancies but applies only in counties with populations above 75,000 as measured by the 2010 census, a threshold Davidson County clearly meets. Under the act, a landlord must hold a security deposit in a separate account and disclose to the tenant the location of that account, must inspect the unit and compile an itemized listing of any damage charged against the deposit, and generally must return the deposit or provide the itemized accounting within 30 days after the tenant vacates, or forfeit the right to retain any portion.
The eviction process is relatively fast and predictable. For nonpayment of rent, a landlord must give the tenant 14 days written notice stating the amount owed, and if the tenant does not cure within that window the landlord may file a detainer warrant in the General Sessions Court of the county where the property sits. Critically for rent underwriting, Tennessee prohibits local rent control entirely: state law bars any local government from enacting or enforcing rent control on private residential or commercial property, and also prohibits mandatory below market unit set asides imposed as zoning conditions. The combination of no rent control, a clear statutory eviction path, and standard deposit rules gives owners a stable and favorable operating environment with none of the pricing or tenure uncertainty that burdens owners in more tenant protective states.
Section 15Infrastructure
Nashville's infrastructure is improving rapidly from a historically car dependent base. Nashville International Airport served a record of roughly 25.7 million passengers in 2025 and is undergoing a major, phased expansion program known as New Horizon, budgeted at roughly 3 billion dollars and targeting capacity for about 40 million annual passengers by 2029, following the earlier BNA Vision program that added an international arrivals facility and an on airport hotel. The highway network is strong, with interstates 40, 65, and 24 converging on the city and the interstate 440 bypass linking them south of downtown, giving the metro its logistics advantage.
The most consequential recent development is transit. In November 2024, Nashville voters approved the Choose How You Move referendum with roughly 66 percent support, authorizing a half cent sales tax increase to fund a program of roughly 3.1 billion dollars covering bus rapid transit, expanded WeGo bus service, 86 miles of new sidewalks, neighborhood transit centers, and upgraded traffic signals, with the funding tax effective February 1, 2025. This reversed a 2018 transit measure that had failed decisively and signals a civic commitment to addressing the congestion that rapid growth has produced. The metro is also served by CSX freight rail and sits on the Cumberland River. For real estate, improving transit and airport capacity support the long run case for density and for submarkets positioned along planned transit corridors.
Section 16Climate and Physical Risks
Middle Tennessee faces a distinct physical risk profile centered on tornadoes, severe convective storms, and riverine flooding rather than coastal hazards. The region has been struck by damaging tornadoes with unsettling frequency in recent years. On March 3, 2020, an EF3 tornado tracked roughly 60 miles directly through downtown Nashville and its eastern neighborhoods, killing 5 people and causing roughly 1.5 billion dollars in damage, part of a broader outbreak that killed 25 across the state and caused about 1.6 billion dollars in losses. In December 2023, another outbreak spawned seven tornadoes across Middle Tennessee and killed seven people. Flooding is the other major hazard: the catastrophic May 2010 flood, when the Cumberland River crested at about 51.86 feet after record rainfall, caused roughly 2 billion dollars in damage in Nashville alone, inundating landmark venues across the city.
At the state level, NOAA recorded that Tennessee was affected by nine billion dollar weather and climate disasters in 2024, with severe storms accounting for more than half of the state's costliest events since 1980. Notably, NOAA has announced it will discontinue updating its billion dollar disaster database after 2024, which will make consistent public tracking of these losses harder going forward. For an investor, the practical implications are concrete: verify the FEMA flood zone and elevation of any specific asset, particularly near the Cumberland River and its tributaries, budget for rising insurance tied to severe storm exposure, and favor newer construction built to current wind standards.
Section 17Neighborhoods and Submarkets
Nashville is best understood as a set of distinct submarkets rather than one uniform market, and the apartment vacancy data make the variation concrete. Northmarq's fourth quarter 2025 figures showed the downtown submarket carrying elevated vacancy near 9.6 percent as new high rise supply concentrated there, class A product generally near 9.0 percent, and the West Nashville submarket far tighter near 6.5 percent. The pattern reflects where the construction wave landed: the urban core and the trendy close in neighborhoods absorbed the bulk of new luxury deliveries and therefore carry the most lease up softness, while established residential submarkets with less new supply held occupancy better.
On the for sale side, the affluent southern suburbs, especially Williamson County communities such as Franklin and Brentwood, command the region's highest prices and pull the metro median well above the city figure, while Davidson County itself spans a wide range from expensive core neighborhoods to more affordable areas to the north and southeast. Commercially, the tightest industrial demand sits along the interstate corridors and near the airport, and the healthiest retail sits in the growing suburban rings and the foot traffic rich urban core. An investor should match strategy to submarket: value oriented multifamily and lease up plays in the oversupplied core where pricing is softest today, stabilized product in the tighter outer submarkets, industrial along the highway corridors, and grocery anchored retail in the fast growing suburban counties.
Section 18Opportunities
The clearest opportunity is cyclical timing in multifamily. The oversupply that pushed rents down roughly 1 to 4 percent and vacancy up to about 8.5 percent is a temporary condition created by a construction wave that is now shrinking, with starts down about 36 percent and permits down more than 50 percent. An investor who can acquire stabilized or lease up assets during the soft 2026 window would do so at cap rates that have repriced substantially higher than cycle lows; whether the shrinking pipeline and Nashville's migration driven demand push rents and occupancy back up in 2027 and 2028 is uncertain and not assured. Industrial offers a demand led profile with vacancy near 4.8 percent and strong absorption, and grocery anchored and necessity retail offer relative stability with metro retail vacancy near 3.6 percent and positive rent growth. The absence of a state income tax, the prohibition on rent control, the fast eviction path, and a genuinely diversified economy anchored by healthcare together create a durable, owner favorable environment that has drawn both residents and capital for a decade. The observations in this section are general and educational, are not projections, forecasts, or assurances of any particular return, yield, occupancy, rent level, or appreciation, and any specific investment must be evaluated on its own facts.
Section 19Risks
The dominant near term risk is that the supply overhang takes longer to clear than expected, keeping rents and occupancy under pressure into 2027 and pressuring net operating income during lease up, particularly in the downtown and class A segments where vacancy is highest. The tax structure is a real and rising cost: a combined sales tax of 9.75 percent, a recordation tax on every transfer, and property taxes levied on commercial and multifamily assets assessed at 40 percent of value rather than the 25 percent applied to homes, with reappraisal driven assessment increases a recurring threat to underwriting. Insurance costs are climbing under severe storm and tornado exposure that is intrinsic to Middle Tennessee, and the physical risk is not abstract given the direct downtown tornado strike in 2020 and the catastrophic 2010 flood. On the capital markets side, cap rates well above cycle lows and elevated debt costs constrain valuations and refinancing, and the for sale housing market has stalled with lengthening days on market and a third of listings cutting price, signs that affordability limits are binding. Real estate investments are speculative, are subject to market, financing, liquidity, tax, regulatory, insurance, and physical hazard risks, and can result in the loss of some or all of an investor's invested capital, including the possible loss of principal.
Section 20Investor Implications
For an accredited investor, Nashville in 2026 rewards patience, submarket precision, and a willingness to underwrite through a soft patch to reach a stronger medium term. The priorities that follow from the data are direct. First, treat the multifamily softness as a timing consideration, acquiring during the 2026 window at repriced cap rates while underwriting conservative near term rents, and favoring the tighter outer submarkets for stabilized product and the oversupplied core for value and lease up plays where basis is lowest. Second, budget the full tax load carefully, since the 40 percent commercial assessment ratio, the high combined sales tax, and the recordation tax materially affect returns that look attractive on a headline cap rate alone. Third, weigh the genuinely strong sectors, industrial along the interstate corridors and grocery anchored retail in the growing suburbs, where fundamentals are tight and new supply is limited. Fourth, quote insurance specifically and verify flood zone and elevation for every asset given the region's storm and flood history. Throughout, the owner favorable legal regime, no income tax, no rent control, and a clear eviction path, is a real and quantifiable feature of the operating environment. None of this constitutes a recommendation to pursue any specific strategy or investment; it is a framework for independent diligence against the sourced figures above, and there is no assurance that any objective or outcome described will be achieved.
Section 21Conclusion
Nashville combines a decade long record of powerful, migration driven growth and economic diversification with a near term apartment oversupply that has temporarily softened rents and lifted vacancy. The metro added roughly 36,567 residents in the most recent measured year, its healthcare anchored economy keeps unemployment near 3.3 percent, and its industrial and retail sectors are tight and healthy, while its office market heals through the absence of new supply. Working against those strengths are a heavy sales and property tax structure, rising insurance costs, a real severe storm and flood risk, and a construction overhang that must still be absorbed. The investable question is one of timing and selection: whether today's repriced valuations and soft rents adequately compensate for the near term supply and cost headwinds, and whether a specific asset's submarket, sector, and physical resilience fit the strategy. The falling new construction starts and permits are consistent with the supply pressure being a passing condition rather than a structural one, but whether Nashville's demand reasserts itself as the pipeline empties is uncertain and no particular outcome or return is assured; the data support rigorous, submarket level underwriting rather than blanket conviction in either direction.
Sources
- U.S. Census Bureau, QuickFacts Nashville and Davidson County,, https://www.census.gov/quickfacts/fact/table/nashvilledavidsonmetropolitangovernmentbalancetennessee,davidsoncountytennessee/PST045224
- U.S. Census Bureau, QuickFacts Davidson County, Tennessee,, https://www.census.gov/quickfacts/fact/table/davidsoncountytennessee
- U.S. Census Bureau, Nashville metro population estimates (FRED series NVLPOP),, https://fred.stlouisfed.org/series/NVLPOP
- U.S. Census Bureau, Metro area components of change 2020 to 2024,, https://www2.census.gov/programs-surveys/popest/tables/2020-2024/metro/totals/cbsa-met-est2024-comp.xlsx
- U.S. Census Bureau, Metro area population trends story,, https://www.census.gov/library/stories/2025/04/metro-area-trends.html
- U.S. Census Bureau via Census Reporter, Nashville metro profile,, http://censusreporter.org/profiles/31000US34980-nashville-davidson-murfreesboro-franklin-tn-metro-area/
- U.S. Bureau of Labor Statistics, Nashville area economic summary,, https://www.bls.gov/regions/southeast/summary/BLSSummary_Nashville.pdf
- U.S. Bureau of Labor Statistics, Nashville metro unemployment (FRED series NASH947URN),, https://fred.stlouisfed.org/series/NASH947URN
- U.S. Bureau of Economic Analysis, Nashville metro real GDP (FRED series RGMP34980),, https://fred.stlouisfed.org/series/RGMP34980
- U.S. Bureau of Economic Analysis, Nashville metro per capita personal income (FRED series NASH947PCPI),, https://fred.stlouisfed.org/series/NASH947PCPI
- Nashville Area Chamber of Commerce, corporate operations,, https://nashvillechamber.com/economic-development/target-industries/corporate-operations/
- Visit Music City, tourism and hotel research,, https://www.visitmusiccity.com/about/research
- Yardi Matrix, Nashville market page,, https://www.yardimatrix.com/Markets/Market/Nashville
- Yardi Matrix, Nashville multifamily market report,, https://www.yardimatrix.com/blog/nashville-multifamily-market-report/
- U.S. Department of Housing and Urban Development, FY2026 Fair Market Rents schedule,, https://www.huduser.gov/portal/datasets/fmr/fmr2026/FY2026_FMR_Schedule.pdf
- Apartment List, Nashville rent report,, https://www.apartmentlist.com/rent-report/tn/nashville
- Zillow, Nashville rental market trends,, https://www.zillow.com/rental-manager/market-trends/nashville-tn/
- Northmarq, Nashville multifamily market insights,, https://www.northmarq.com/insights/insights/annual-rent-growth-holds-supply-boom-fades-nashville-multifamily-market
- Northmarq, Nashville multifamily Q1 2026,, https://www.northmarq.com/insights/insights/nashville-multifamily-vacancy-holds-steady-prior-quarter-q1-2026
- Multi Housing News, Nashville supply analysis,, https://www.multihousingnews.com/what-nashville-renters-see-as-supply-peaks-fade/
- Greater Nashville REALTORS, monthly home sales report,, https://www.greaternashvillerealtors.org/monthly-home-sales-report
- Redfin, Nashville housing market,, https://www.redfin.com/city/13415/TN/Nashville/housing-market
- CBRE, Nashville Office Figures Q2 2026,, https://www.cbre.com/insights/figures/nashville-office-figures-report-q2-2026
- Cushman and Wakefield, Nashville Office MarketBeat Q1 2026,, https://assets.cushmanwakefield.com/-/media/cw/marketbeat-pdfs/2026/q1/us-reports/office/nashville_americas_marketbeat_office_q12026.pdf
- Institutional Property Advisors, Nashville office 2026 forecast,, https://www.institutionalpropertyadvisors.com/-/media/Files/IPA/Research%20PDFs/2026/2026%20Office%20Investment%20Forecast/Nashville%20Office%20Market%20Report%20%20pdf.pdf
- CBRE, Nashville Industrial Figures Q2 2026,, https://www.cbre.com/insights/figures/nashville-industrial-figures-report-q2-2026
- Matthews, Nashville Retail Market Report Q1 2026,, https://www.matthews.com/insights/q1-2026-nashville-tn-retail-market-report
- Marcus and Millichap, Nashville 2026 Retail Investment Forecast,, https://www.marcusmillichap.com/research/market-report/nashville/nashville-2026-investment-forecast-retail-market-report
- MSCI Real Capital Analytics, US Capital Trends,, https://www.msci.com/downloads/web/msci-com/data-and-analytics/real-estate/real-capital-analytics/US%20Capital%20Trends%20The%20Big%20Picture.pdf
- Tennessee Department of Revenue, Hall income tax repeal,, https://revenue.support.tn.gov/hc/en-us/articles/360057828631-HIT-3-Hall-Income-Tax-Repealed-Beginning-January-1-2021
- Nashville and Davidson County Assessor of Property, tax rates,, https://www.padctn.org/resources/tax-rates-and-calculator/
- Tax Foundation, Tennessee,, https://taxfoundation.org/location/tennessee/
- Tennessee Department of Revenue, recordation taxes,, https://www.tn.gov/revenue/taxes/local-taxes/recordation-taxes.html
- Tennessee Code Section 66 28 102, URLTA applicability,, https://law.justia.com/codes/tennessee/title-66/chapter-28/part-1/section-66-28-102/
- Tennessee Code Section 66 28 301, security deposits,, https://codes.findlaw.com/tn/title-66-property/tn-code-sect-66-28-301/
- Tennessee Code Section 66 35 102, prohibition on rent control,, https://law.justia.com/codes/tennessee/title-66/chapter-35/section-66-35-102/
- Nolo, Tennessee eviction process,, https://www.nolo.com/landlord-tenant/tennessee-eviction-process.html
- Nashville International Airport, New Horizon program,, https://flynashville.com/bna-new-horizon
- Metro Nashville, Choose How You Move referendum,, https://www.nashville.gov/departments/mayor/news/its-official-choose-how-you-move-will-be-november-ballot
- Tennessee Lookout, Choose How You Move transit referendum,, https://tennesseelookout.com/ballot-measures/choose-how-you-move-nashville-transit-referendum/
- National Weather Service Nashville, December 9, 2023 tornado event,, https://www.weather.gov/ohx/20231209
- NOAA Climate.gov, 2024 billion dollar disasters,, https://www.climate.gov/news-features/blogs/beyond-data/2024-active-year-us-billion-dollar-weather-and-climate-disasters
- NOAA National Centers for Environmental Information, billion dollar disaster events,, https://www.ncei.noaa.gov/access/billions/events.pdf