In brief · summary: Oklahoma City
Oklahoma City is the center of a broad regional economy that mixes energy, construction, logistics, health care, education, government, and services, and that diversity shapes both residential and commercial real estate demand. According to the United States Bureau of Labor Statistics Economy at a Glance table for the Oklahoma City metropolitan statistical area, the civilian labor force was about 786,900 people in June 2026 with employment of about 753,500 and an unemployment rate of 4.2 percent, while total nonfarm payroll employment stood at about 710,900 jobs and had grown by 0.2 percent over the prior twelve months, all not seasonally adjusted.
The metro is the forty second largest in the United States, with a population near 1.5 million in 2024 and metropolitan gross domestic product of about 100,054.101 million dollars in 2023, according to the Census Bureau and the Bureau of Economic Analysis. Oklahoma City is more affordable and more owner oriented than most large metros.
Census Bureau data for the 2019 through 2023 period show a city median household income of 66,702 dollars, a median value of owner occupied homes of 215,100 dollars, a median gross rent of 1,083 dollars per month, and an owner occupied rate of 59.1 percent. Zillow reports an average home value for its Oklahoma …
Section 01Executive Summary
Oklahoma City is the center of a broad regional economy that mixes energy, construction, logistics, health care, education, government, and services, and that diversity shapes both residential and commercial real estate demand.
According to the United States Bureau of Labor Statistics Economy at a Glance table for the Oklahoma City metropolitan statistical area, the civilian labor force was about 786,900 people in June 2026 with employment of about 753,500 and an unemployment rate of 4.2 percent, while total nonfarm payroll employment stood at about 710,900 jobs and had grown by 0.2 percent over the prior twelve months, all not seasonally adjusted. The metro is the forty second largest in the United States, with a population near 1.5 million in 2024 and metropolitan gross domestic product of about 100,054.101 million dollars in 2023, according to the Census Bureau and the Bureau of Economic Analysis.
Oklahoma City is more affordable and more owner oriented than most large metros. Census Bureau data for the 2019 through 2023 period show a city median household income of 66,702 dollars, a median value of owner occupied homes of 215,100 dollars, a median gross rent of 1,083 dollars per month, and an owner occupied rate of 59.1 percent. Zillow reports an average home value for its Oklahoma City index of about 207,726 dollars as of July 31 2026, roughly flat over the year, with homes going under contract in about 22 days, while Redfin reports a median sale price of about 269,853 dollars over the three months ending June 2026, down 1.9 percent year over year.
For rental housing, Yardi Matrix reports an average advertised asking rent near 1,023 dollars per month in early 2026, up about 1.4 percent year over year, with Colliers reporting occupancy near 95 percent and the lowest new construction pipeline in over a decade. On the commercial side, industrial vacancy was about 6 percent while office vacancy is elevated, especially downtown. For accredited investors, Oklahoma City offers scale, affordability, and a diversified employment base, offset by a weak office segment and severe weather exposure.
Section 02Population and Migration
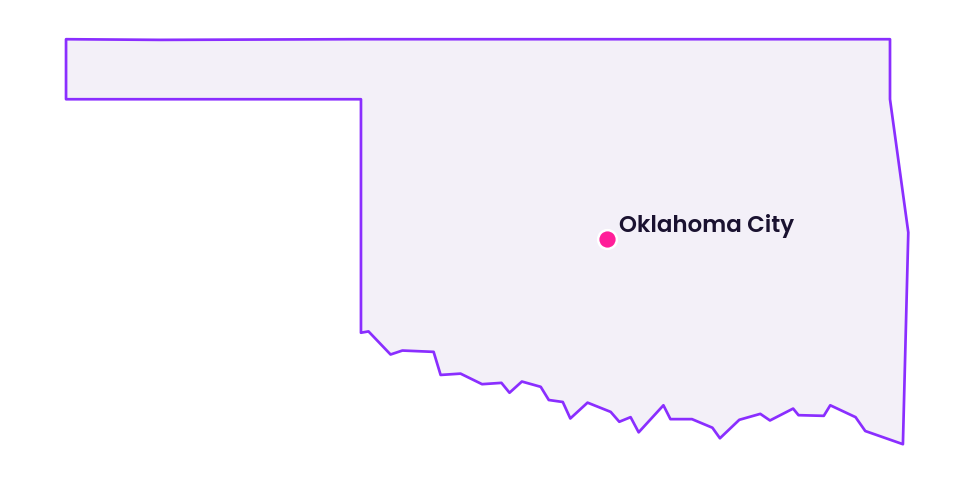
Oklahoma City is the principal city of the eight county Oklahoma City metropolitan statistical area in central Oklahoma, the largest urbanized area in the state.
United States Census Bureau data place the metro population near 1.5 million in 2024, the forty second largest in the country, while the city of Oklahoma City had about 702,767 residents on the July 2023 estimate and about 719,849 on the 2025 estimate, making it the twenty second largest city in the United States and reflecting steady growth. The city median age is about 35 years.
| Population metric | Geography and scope | Value | Source and date |
|---|---|---|---|
| Metro population | Oklahoma City metro 2024 | about 1.5 million | US Census Bureau 2024 estimate |
| City population | Oklahoma City July 2023 estimate | 702,767 persons | US Census QuickFacts |
| City population, recent estimate | Oklahoma City 2025 | about 719,849 persons | US Census Bureau 2025 estimate |
| City median age | Oklahoma City ACS 5 year 2019 through 2023 | about 35 years | US Census Bureau ACS 5 year 2023 |
The metro has grown steadily, drawing residents on the strength of its affordability and diversified employment base. For investors, the key point is that Oklahoma City supports a large and growing resident and worker population that underpins long run housing demand, with an unusually high owner occupied share for a large city that shapes the balance between the for sale and rental markets.
Section 03Jobs and Economic Anchors
All quantitative employment and labor force figures in this section come from the United States Bureau of Labor Statistics Economy at a Glance table for the Oklahoma City metropolitan statistical area, not seasonally adjusted, covering January through June 2026 with twelve month percentage changes by industry, with data extracted in August 2026.
The headline labor market indicators show a large regional economy with relatively low unemployment and a return to modest net job growth.
| Month 2026 | Labor force thousand | Employment thousand | Unemployment thousand | Unemployment rate % | Total nonfarm jobs thousand | Twelve month change in total nonfarm % |
|---|---|---|---|---|---|---|
| January 2026 | 781.0 | 749.0 | 32.0 | 4.1% | 700.8 | -0.7% |
| February 2026 | 775.4 | 744.5 | 30.9 | 4.0% | 704.8 | -0.9% |
| March 2026 | 774.4 | 748.1 | 26.3 | 3.4% | 707.9 | -0.9% |
| April 2026 | 767.6 | 740.0 | 27.6 | 3.6% | 712.5 | -0.8% |
| May 2026 | 779.8 | 746.8 | 33.0 | 4.2% | 714.1 | -0.6% |
| June 2026 preliminary | 786.9 | 753.5 | 33.4 | 4.2% | 710.9 | +0.2% |
These figures, confirmed against the Bureau of Labor Statistics source, show a labor force between about 767,600 and 786,900 during the first half of 2026, employment between about 740,000 and 753,500, and unemployment rates in a narrow band between 3.4 percent and 4.2 percent, consistent with a market near full employment. Total nonfarm employment moved from a twelve month decline of about 0.9 percent in February and March to a slight twelve month gain of 0.2 percent in June, suggesting a transition from a mild cyclical slowdown into renewed but modest net job creation.
The industry composition in June 2026 reveals the structure of the metropolitan economy, with per sector employment and twelve month changes confirmed against the Bureau of Labor Statistics source.
| Industry sector, Oklahoma City metro | Jobs thousand June 2026 | Twelve month change % | Source |
|---|---|---|---|
| Mining and logging | 10.2 | +1.0% | BLS Economy at a Glance |
| Construction | 36.6 | +2.8% | BLS Economy at a Glance |
| Manufacturing | 34.7 | -0.6% | BLS Economy at a Glance |
| Trade, transportation, and utilities | 125.8 | -0.2% | BLS Economy at a Glance |
| Information | 6.4 | 0.0% | BLS Economy at a Glance |
| Financial activities | 38.2 | +1.6% | BLS Economy at a Glance |
| Professional and business services | 91.7 | -2.7% | BLS Economy at a Glance |
| Education and health services | 127.8 | +5.5% | BLS Economy at a Glance |
| Leisure and hospitality | 80.3 | -1.0% | BLS Economy at a Glance |
| Other services | 32.0 | +3.2% | BLS Economy at a Glance |
| Government | 127.2 | -3.5% | BLS Economy at a Glance |
| Total nonfarm | 710.9 | +0.2% | BLS Economy at a Glance |
These figures highlight major employment anchors in education and health services at about 127,800 jobs, government at about 127,200 jobs, and trade, transportation, and utilities at about 125,800 jobs, alongside professional and business services at about 91,700 jobs and financial activities at about 38,200 jobs. The strongest twelve month growth is in education and health services at 5.5 percent, other services at 3.2 percent, and construction at 2.8 percent, while government fell 3.5 percent and professional and business services fell 2.7 percent, indicating that growth is concentrated in health care, education, and local services. Metropolitan gross domestic product reached about 100,054.101 million dollars in 2023, or about 70,179 dollars per capita, according to the Bureau of Economic Analysis. For investors, this sector mix ties housing and commercial demand not only to energy and logistics but increasingly to health care and education institutions, which stabilize occupancies even when energy and government spending fluctuate.
Section 04Income
Income levels in Oklahoma City are below national medians but paired with low housing costs, producing favorable affordability.
United States Census Bureau data for the 2019 through 2023 period report a city median household income of 66,702 dollars, a per capita income of 37,109 dollars, and a person poverty rate of 15.2 percent.
| Income metric | Geography and scope | Value | Source and date |
|---|---|---|---|
| Median household income | Oklahoma City ACS 5 year 2019 through 2023 | 66,702 dollars | US Census QuickFacts |
| Per capita income | Oklahoma City ACS 5 year 2019 through 2023 | 37,109 dollars | US Census QuickFacts |
| Person poverty rate | Oklahoma City ACS 5 year 2019 through 2023 | 15.2% | US Census QuickFacts |
Median household income about 12 percent below the national figure, combined with a median home value of 215,100 dollars and a median gross rent of 1,083 dollars, gives Oklahoma City a price to income ratio well below the national average, which supports both homeownership and a rental base for lower and moderate income households. For investors, the deep pool of workforce and moderate income tenants means multifamily and single family rental strategies commonly focus on Class B and Class C product and on affordability, rather than assuming a large high income renter cohort.
Section 05Housing and Multifamily
Oklahoma City is an owner majority market by large city standards, with a multifamily sector supported by health care, government, and service employment and constrained new supply.
United States Census Bureau data show a city owner occupied rate of 59.1 percent for the 2019 through 2023 period, higher than most large cities. On the institutional side, Yardi Matrix reports an average advertised asking rent near 1,023 dollars per month in early 2026, up about 1.4 percent year over year, while Colliers reports overall occupancy near 95 percent, with Class B at 95.3 percent and Class C at 95.6 percent leading and Class A softer at 93.7 percent.
| Multifamily metric | Geography and scope | Value | Source |
|---|---|---|---|
| Average advertised asking rent | Oklahoma City metro multifamily | about 1,023 dollars per month, change +1.4% year over year | Yardi Matrix January 2026 |
| Overall occupancy | Oklahoma City metro multifamily | about 95% | Colliers Q1 2026 |
| Class A asking rent | Oklahoma City metro new multifamily | about 1,233 dollars per month | Colliers Q1 2026 |
| Class C asking rent | Oklahoma City metro older multifamily | about 900 dollars per month | Colliers Q1 2026 |
The occupancy near 95 percent, which implies a vacancy rate around 5 percent, reflects steady demand and a construction pipeline that is the lowest in over a decade, which market reporting expects to tighten vacancy further through 2026. Education and health services employment growth of 5.5 percent supports demand near medical centers and campuses, while construction employment growth of 2.8 percent points to continued building. For multifamily investors, Oklahoma City currently shows stable occupancy, affordable rents with modest positive growth, and limited new supply, a combination that has tended to favor income oriented strategies in Class B and Class C assets, though no particular outcome is assured.
Section 06Rents
Rents in Oklahoma City are among the more affordable in the country and have grown modestly.
Yardi Matrix reports an average advertised asking rent near 1,023 dollars per month in early 2026, up about 1.4 percent year over year, while Census measures show a citywide median gross rent of 1,083 dollars for the 2019 through 2023 period. By class, Colliers reports Class A asking rents near 1,233 dollars, Class B near 1,076 dollars, and Class C near 900 dollars per month.
| Rent metric | Geography and scope | Value | Source and date |
|---|---|---|---|
| Median gross rent all renters | Oklahoma City ACS 5 year 2019 through 2023 | 1,083 dollars per month | US Census QuickFacts |
| Average advertised asking rent | Oklahoma City metro multifamily | about 1,023 dollars per month, change +1.4% year over year | Yardi Matrix January 2026 |
| Class A asking rent | Oklahoma City metro new multifamily | about 1,233 dollars per month | Colliers Q1 2026 |
| Class C asking rent | Oklahoma City metro older multifamily | about 900 dollars per month | Colliers Q1 2026 |
For investors, the combination of low absolute rents, modest positive rent growth near 1.4 percent, high occupancy, and a thin construction pipeline is consistent with steady cash flow conditions, though the low rent base means that operating expense growth and property taxes must be watched closely to protect net operating income.
Section 07Vacancy
Vacancy must be considered separately for multifamily, office, industrial, and retail.
In multifamily, Colliers reports overall occupancy near 95 percent in early 2026, implying a vacancy rate around 5 percent, supported by strong demand and the lowest new supply pipeline in over a decade. On the commercial side, office vacancy is elevated, at about 10 percent on the broad CoStar metro measure and about 25.9 percent on the Price Edwards tracked competitive set, which is heavier in the softer downtown submarket where a record volume of available space sits on the market. Industrial vacancy was tight at about 6.1 percent in the second quarter of 2026 per NAI, with Class A space near 3.9 percent, while retail vacancy was near 8.0 percent.
For investors, these figures indicate that multifamily is landlord favorable with tightening conditions, that industrial and retail are reasonably balanced, and that office, especially downtown, is the clear area of weakness requiring caution and asset specific analysis.
Section 08Supply Pipeline
Supply in Oklahoma City is constrained in multifamily and moderate in industrial.
The multifamily construction pipeline is the lowest in over a decade, with projected unit deliveries down sharply from the 2024 peak, which market reporting expects to tighten vacancy and support occupancy near 95 percent through 2026. On the industrial side, the metro has an inventory of about 156 million square feet with a construction pipeline of about 560,000 square feet weighted toward speculative builds, per CoStar and NAI, so new supply is modest relative to the base. Office construction is minimal given elevated vacancy, and retail construction is thin at about 14,000 square feet under way, keeping retail vacancy near 8 percent.
For investors, the constrained multifamily pipeline is a favorable signal for rent and occupancy over the medium term, while the modest industrial pipeline supports stable conditions in that segment.
Section 09Single Family Homes
The single family market in Oklahoma City is affordable and liquid, an important feature for both owner occupants and single family rental investors.
Zillow reports an average home value for its Oklahoma City index of about 207,726 dollars as of July 31 2026, roughly flat over the year, with homes going under contract in about 22 days, while Redfin reports a median sale price of about 269,853 dollars over the three months ending June 2026, down 1.9 percent year over year, with a median price per square foot of about 162 dollars, unchanged from a year earlier. Census data place the city median home value at 215,100 dollars for the 2019 through 2023 period.
| Single family market metric | Geography and scope | Period | Value | Year over year change | Source |
|---|---|---|---|---|---|
| Typical home value index | Zillow Oklahoma City | As of Jul 31 2026 | 207,726 dollars, about 22 days to pending | roughly flat | Zillow Home Value Index |
| Median sale price | Oklahoma City all home types | Three months ending Jun 2026 | 269,853 dollars | -1.9% | Redfin Oklahoma City housing market |
| Median price per square foot | Oklahoma City all home types | Three months ending Jun 2026 | about 162 dollars | 0.0% | Redfin Oklahoma City housing market |
| Median home value | Oklahoma City ACS 5 year 2019 through 2023 | 2019 through 2023 | 215,100 dollars | period level, no year over year change applies | US Census QuickFacts |
The data show an affordable market with values roughly flat to modestly lower over the year and still liquid, with homes going under contract in about three weeks, indicating active buyers despite higher national interest rates. For single family rental investors, low acquisition prices near a 215,000 dollar to 270,000 dollar range relative to local incomes may support gross yields that some investors find favorable, especially in Class B and Class C neighborhoods, provided acquisition costs and property taxes are well controlled; no particular outcome is assured.
Section 10Commercial Real Estate and Retail Centers
The commercial real estate landscape in Oklahoma City spans office, industrial and logistics, and retail. Recent fundamentals across the major segments are summarized below.
| Commercial segment | Geography | Period | Vacancy | Source |
|---|---|---|---|---|
| Office | Oklahoma City metro | 2026 | about 10% on the CoStar broad measure to 25.9% on the Price Edwards tracked set | CoStar and Price Edwards 2026 |
| Industrial | Oklahoma City metro | Q2 2026 | 6.1% | NAI Q2 2026 |
| Retail | Oklahoma City metro | 2026 | about 8.0% | market reporting 2026 |
Office demand in Oklahoma City is tied to professional and business services at about 91,700 jobs, financial activities at about 38,200 jobs, and government at about 127,200 jobs, but the office market is the weak spot, with a broad metro vacancy near 10 percent that rises to about 25.9 percent in the Price Edwards tracked set, weighted toward a soft downtown that carries a record volume of available space and an average asking rate near 20.93 dollars per square foot. Professional and business services employment fell 2.7 percent and government fell 3.5 percent over the year, consistent with continued pressure on office footprints, so investors should approach office assets with caution and strong tenant credit.
Industrial and logistics are supported by manufacturing at about 34,700 jobs and trade, transportation, and utilities at about 125,800 jobs, with industrial vacancy near 6.1 percent in the second quarter of 2026 and Class A space tighter near 3.9 percent, reflecting a relatively stable base and modest new supply. Retail vacancy near 8.0 percent with a thin construction pipeline points to balanced conditions, and in a market where unemployment is in the low to mid four percent range and education, health, and other services are growing, daily needs and grocery anchored retail have tended to remain resilient. For investors, industrial and necessity retail have tended to be the more defensive segments, while office requires careful, asset specific underwriting; no particular outcome is assured.
Section 11Transactions and Capital Markets
Oklahoma City is a stable, cash flow oriented secondary market that continues to attract regional and national capital.
Multifamily has been the most sought after segment, supported by occupancy near 95 percent, affordable rents near 1,023 dollars, and a constrained construction pipeline, while industrial has drawn interest on the strength of the region central location and stable demand. A single published quarterly transaction volume and cap rate series by property type for the metro is not available, so entry and exit yields are set against current comparable sales and lender feedback. The confirmed modest job growth of 0.2 percent over the year, concentrated in education and health services and local services, supports continued investor interest, but allocation will depend on each investor assessment of relative value versus other central and southern United States markets and on their cost of debt.
Section 12Taxes
Real estate investors in Oklahoma City are subject to Oklahoma income tax, local property taxes, and sales taxes, all of which are comparatively low.
Under House Bill 2,764, signed in 2025 and effective for tax year 2026, Oklahoma restructured its individual income tax from six brackets to three, with a top marginal rate of 4.5 percent, and Oklahoma does not authorize any municipal or county income tax. The combined sales tax rate in Oklahoma City is 8.625 percent, and property taxes are among the lowest in the country, with Oklahoma County applying an 11 percent assessment ratio to real property and a 3 percent annual cap on assessment increases for homestead property.
| Tax | Applies to | Rate | Source |
|---|---|---|---|
| Oklahoma individual income tax, top rate | Income above 7,200 dollars single | 4.5% | Oklahoma Tax Commission 2026 |
| Oklahoma City income tax | City residents | none | Oklahoma law |
| Combined sales tax | Most taxable goods in Oklahoma City | 8.625% | City of Oklahoma City |
| Oklahoma County assessment ratio | Real property | 11% of fair cash value | Oklahoma County Assessor |
| Effective property tax rate | Oklahoma City real property | about 0.99% of market value | Tax reporting 2026 |
The 11 percent assessment ratio and effective property tax rates near 0.99 percent in the city and 0.93 percent countywide are well below the national median, and the absence of any local income tax further supports after tax returns, though investors should confirm current millage and assessment practices at the parcel level, since property tax remains a meaningful operating cost relative to the low rent base.
Section 13Insurance
Insurance costs for Oklahoma City properties reflect general property and liability coverage plus significant exposure to severe convective storms, tornadoes, hail, and high wind.
No single published average insurance premium by city and property type is available. Oklahoma City sits in a region well known for severe weather, including tornadoes, hailstorms, straight line winds, and heavy rainfall, so wind and hail coverage and deductible structures are central underwriting considerations, particularly for older properties that may be more vulnerable to storm damage or not fully compliant with current building codes. Flood risk applies near rivers and low lying zones, where FEMA floodplain designations trigger flood insurance requirements. Investors should work closely with insurance brokers to understand coverage requirements, deductible structures, and premium trajectories, and should recognize that reinsurance market conditions and rising severe weather losses may affect insurance availability and cost over time.
Section 14Landlord Tenant and Regulatory Environment
Oklahoma landlord tenant law and Oklahoma City ordinances shape the operating environment for rental properties.
Oklahoma is generally described by practitioners as more landlord friendly than many coastal states that have adopted extensive rent control or tenant protection frameworks, though that characterization is qualitative rather than derived from a single numeric dataset. Investors considering Oklahoma City properties must engage qualified legal counsel to interpret the Oklahoma Residential Landlord and Tenant Act, local code enforcement practices, judicial timelines for evictions, and provisions related to security deposits, habitability, and fair housing, and to assess how these elements affect operating risk. They should also be aware of any local requirements tied to affordable housing programs or incentives that may impose additional compliance obligations.
Section 15Infrastructure
Infrastructure underpins both residential and commercial real estate in Oklahoma City.
Will Rogers International Airport served a record of about 4.6 million passengers in 2025, edging above the prior 2024 record, according to the Oklahoma City Airport Trust, supporting business travel and logistics demand. Oklahoma City sits at the intersection of major interstate highways, including Interstate 35, Interstate 40, and Interstate 44, which supports its role as a central United States logistics hub and aligns with the substantial employment reported in trade, transportation, and utilities and in manufacturing.
For investors, property specific questions about access to major roads, transit, and utility reliability often matter more than aggregate infrastructure statistics, and those questions should be addressed through local due diligence, including review of transportation plans and discussions with utility providers.
Section 16Climate and Physical Risks
Oklahoma City is located in a region well known for severe weather, including tornadoes, hailstorms, straight line winds, heavy rainfall, and periodic winter storms.
Properties in the area are exposed to wind and hail damage, localized flooding in low lying or poorly drained areas, and other storm related hazards, and assets in FEMA designated Special Flood Hazard Areas must comply with flood insurance requirements and elevation standards. No single official metro level percentage of land or structures in these zones is published as a summary statistic, so physical exposure is characterized parcel by parcel using FEMA flood insurance rate maps and historical storm records. Because severe weather frequency and intensity may shift over coming decades, investors should incorporate climate and physical risk assessments and insurance analytics into their underwriting, and should weigh building quality, age, and resilience features when evaluating Oklahoma City assets.
Section 17Neighborhoods and Submarkets
Oklahoma City contains a range of neighborhoods and submarkets that differ in housing stock, income levels, access to employment, and amenities, and a full investment thesis must distinguish among these areas.
The metropolitan area includes a central business district and nearby urban neighborhoods with a mix of older single family homes, small multifamily properties, and newer infill projects, alongside more suburban areas with larger single family subdivisions, shopping centers, and industrial corridors. Submarkets close to major employment centers in health care, education, and logistics tend to offer stronger and more resilient demand, while for single family rentals, school quality, amenities, and perceptions of safety play major roles in tenant selection. Because performance and risk vary significantly within the metro, investors should evaluate submarkets using tract level Census data and local fieldwork rather than treating the city as a single homogeneous market.
Section 18Opportunities
The data assembled here support several opportunity themes for Oklahoma City real estate investors.
First, the metro supports a large labor force of about 786,900 people and total nonfarm employment of about 710,900 jobs with unemployment in the low to mid four percent range and a return to modest job growth, which sustains demand for rental housing and commercial space. Second, employment growth is concentrated in education and health services at 5.5 percent, other services at 3.2 percent, and construction at 2.8 percent, providing structural demand anchors tied to health care, education, and local services.
Third, multifamily fundamentals are favorable, with occupancy near 95 percent, affordable rents near 1,023 dollars up about 1.4 percent year over year, and the lowest construction pipeline in over a decade. Fourth, the affordable single family market, with a Zillow index near 207,726 dollars and low property taxes, may support gross yields that some investors find favorable for single family rental strategies, while Oklahoma City central location and stable industrial base near 6 percent vacancy support continued demand for warehouse and distribution space.
These are general educational observations, not recommendations, and no particular outcome is assured; actual results depend on asset specific factors, execution, and market conditions.
Section 19Risks
Alongside these opportunities, Oklahoma City presents several categories of risk.
The first is the weak office segment, where broad metro vacancy near 10 percent rises to about 25.9 percent in the tracked downtown heavy set, with a record volume of available space and declining office using employment in government, down 3.5 percent, and professional and business services, down 2.7 percent, which creates meaningful risk for office assets. The second is severe weather exposure, as the region is highly prone to tornadoes, hail, and wind, which introduces physical, operational, and insurance cost risk that must be modeled explicitly.
Third, the low absolute rent base, with average rents near 1,023 dollars, leaves limited cushion for operating expense and property tax growth, so cost control is essential to protect net operating income. Fourth, the metro economy retains exposure to energy sector cycles, and while the base is diversified, a sharp downturn in energy or government spending could dampen demand. Finally, capital markets risk from interest rates and lender appetite must be incorporated into conservative underwriting, and as with any real estate investment, a loss of some or all invested capital is possible.
Section 20Investor Implications
For United States accredited investors, Oklahoma City offers scale, diversity, and affordability that make it a candidate for a diversified portfolio focused on stable income and measured growth.
Multifamily investors can view Oklahoma City as a market with a large and varied employment base, strong occupancy near 95 percent, modest rent growth, and a constrained pipeline, conditions that have tended to favor income oriented Class B and Class C strategies, while calibrating expense and property tax growth carefully against the low rent base. Single family rental investors should recognize that an affordable for sale market, with a Zillow index near 207,726 dollars and a Redfin median near 269,853 dollars, and low property taxes may support gross yields that some investors find favorable, provided acquisition costs are well controlled and tenant demand is carefully targeted.
Industrial and logistics investors should note the sizable employment base in trade, transportation, and utilities and in manufacturing and the tight industrial vacancy near 6 percent, and may evaluate modern facilities in strong logistics locations as core or core plus holdings, while office investors need to be cautious given elevated vacancy and negative office using employment trends and must rely on building level leasing data and strong tenant covenants. Across all asset types, Oklahoma City investments must be underwritten with explicit consideration of severe weather risk, insurance costs, and the low rent base, favoring resilient locations, durable building designs, and conservative leverage. These are general observations, not recommendations, and no particular outcome is assured.
Section 21Conclusion
Oklahoma City stands out as a substantial, diversified metropolitan economy of about 1.5 million people, with a labor force above 786,000, about 710,900 nonfarm jobs, an unemployment rate of 4.2 percent, and metropolitan gross domestic product of about 100,054.101 million dollars in 2023.
Its employment structure is broad, with major anchors in education and health services, government, and trade and transportation, and this mix provides a diversified demand base even as some individual sectors show year over year weakness. Census and market data show an affordable, owner majority city, with a median household income of 66,702 dollars, a median home value of 215,100 dollars, and a Zillow index near 207,726 dollars, alongside a landlord favorable multifamily market at occupancy near 95 percent with rents near 1,023 dollars, tight industrial fundamentals, and a weak office segment.
Taken together, the evidence suggests that Oklahoma City offers a stable and diversified platform for long term real estate investment, particularly in multifamily, single family rentals, and industrial assets, but that outcomes in this market will depend on disciplined underwriting, careful cost control against a low rent base, caution on office, and active management of severe weather and insurance risks. Returns are not guaranteed and a loss of principal is possible.