In brief · summary: Phoenix
Phoenix is the principal city of a large desert metropolitan region in central Arizona, anchored by technology, advanced manufacturing, logistics, financial services, health care, education, and diverse service industries.
Public data from the United States Census Bureau and American Community Survey, the Bureau of Labor Statistics, the Bureau of Economic Analysis, the United States Department of Housing and Urban Development, the Federal Housing Finance Agency, the Arizona Department of Housing, Maricopa County property and tax offices, the Federal Emergency Management Agency, the National Oceanic and Atmospheric Administration, and private providers such as CoStar, Yardi Matrix, RealPage, Zillow, Redfin, and major brokerage research show that Phoenix and the surrounding Phoenix Mesa Chandler metropolitan area combine strong long run population and job growth with significant cyclicality in housing and construction.
The Bureau of Labor Statistics reports that the Phoenix Mesa Chandler metropolitan area labor force was in the range of roughly two million seven hundred thousand persons in the first half of twenty twenty six, with total nonfarm employment between about two million four hundred fifty thousand and two million four hundred ninety thousand jobs not seasonally adjusted. The metro unemployment rate ranged from 3.8% in April twenty twenty six to 4.9% in preliminary June twenty twenty six data. These figures highlight …
Section 01Executive Summary
Phoenix is the principal city of a large desert metropolitan region in central Arizona, anchored by technology, advanced manufacturing, logistics, financial services, health care, education, and diverse service industries. Public data from the United States Census Bureau and American Community Survey, the Bureau of Labor Statistics, the Bureau of Economic Analysis, the United States Department of Housing and Urban Development, the Federal Housing Finance Agency, the Arizona Department of Housing, Maricopa County property and tax offices, the Federal Emergency Management Agency, the National Oceanic and Atmospheric Administration, and private providers such as CoStar, Yardi Matrix, RealPage, Zillow, Redfin, and major brokerage research show that Phoenix and the surrounding Phoenix Mesa Chandler metropolitan area combine strong long run population and job growth with significant cyclicality in housing and construction.
The Bureau of Labor Statistics reports that the Phoenix Mesa Chandler metropolitan area labor force was in the range of roughly two million seven hundred thousand persons in the first half of twenty twenty six, with total nonfarm employment between about two million four hundred fifty thousand and two million four hundred ninety thousand jobs not seasonally adjusted. The metro unemployment rate ranged from 3.8% in April twenty twenty six to 4.9% in preliminary June twenty twenty six data. These figures highlight a large, diversified labor market with near full employment conditions during much of the period. City level series show that Phoenix captures a substantial share of this labor base, though this review reports many population and housing measures at the metropolitan and county level, where the published data are most complete, and uses those geographies as proxies for the city.
Phoenix housing is dominated by single family detached homes and garden style multifamily communities that extend across a wide suburban footprint, alongside growing clusters of midrise apartments and mixed use projects in the urban core and in inner suburbs. Private rental data for the Phoenix metropolitan area show that rents rose rapidly in the second half of the twenty ten decade and in the early pandemic years, then moderated as mortgage rates increased and new supply delivered. Industrial and logistics property has been one of the strongest performing sectors, while office properties, especially older space, face challenges due to national shifts in workplace behavior.
This review uses metropolitan and Maricopa County statistics as the primary quantitative frame, explicitly noting when those broader geographies serve as proxies for Phoenix city. For some core federal housing and population series, the discussion is qualitative and directional rather than a restatement of exact counts, and readers should consult the cited sources for precise current figures. Within that constraint, the review aims to provide accredited investors with a structured, self contained understanding of Phoenix population and migration, jobs and anchors, incomes, housing and multifamily, rents and vacancy, supply pipeline, single family ownership and rental markets, commercial sectors, capital flows, taxes and insurance, regulation, infrastructure, climate and water risk, neighborhood variation, and the resulting opportunities and risks.
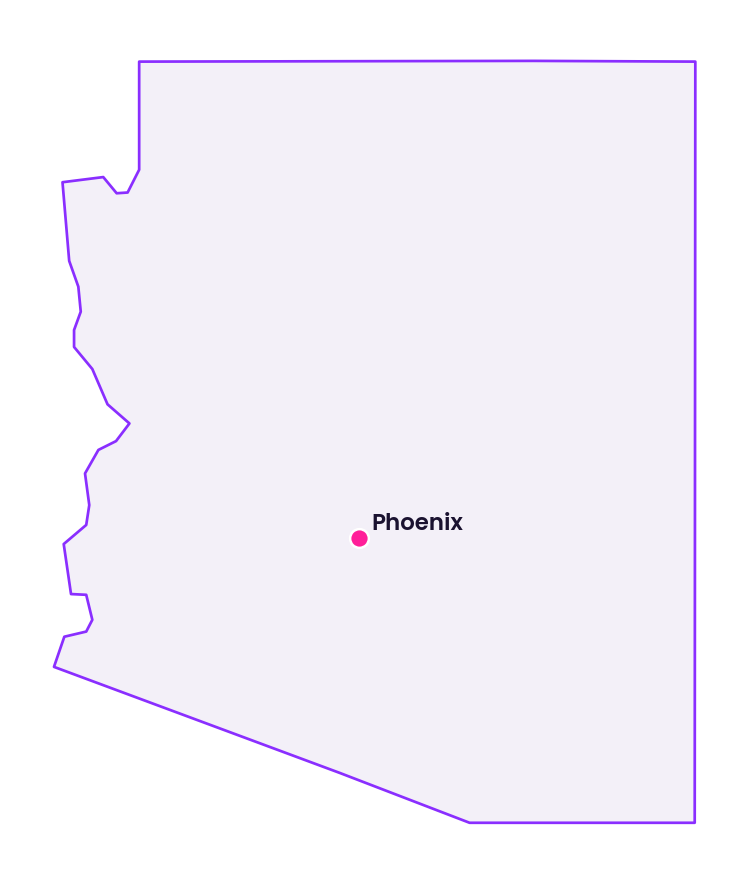
Section 02Population and Migration
Decennial census counts and American Community Survey estimates through the early twenty twenties show that Phoenix city and the broader Phoenix Mesa Chandler metropolitan area have experienced strong and sustained population growth over multiple decades. Phoenix evolved from a relatively small desert city in the mid twentieth century into one of the largest cities in the United States, driven by climate appeal, employment growth, availability of land for development, and relative housing affordability compared with coastal California and some other western regions.
While this review does not restate exact city population figures from the most recent census and intercensal estimates, qualitative patterns from those series and from state and regional planning documents indicate that Phoenix has grown faster than the national average and remains among the faster growing large metropolitan areas. Growth has been strongest in suburban and exurban areas of Maricopa County, but Phoenix city itself continues to add residents through infill development, densification of existing neighborhoods, and redevelopment of underused commercial and industrial parcels.
Migration patterns, using Phoenix Mesa Chandler metropolitan area and Maricopa County data as proxies, reveal significant domestic in migration from higher cost western states, notably California, and from the Midwest and Northeast, along with international migration from Latin America and Asia. These inflows reflect perceived lifestyle advantages, job opportunities in technology and manufacturing, business friendly regulation, and historically lower housing costs. At the same time, there is some out migration of long time residents, often retirees or households seeking different climates or lower summer heat exposure, but net flows into the region remain positive in most recent periods when data have been available.
For investors, these population and migration dynamics support a long run demand story for both rental and for sale housing, especially in neighborhoods that offer access to employment centers, transportation corridors, and amenities. However, rapid growth also strains infrastructure, increases congestion, and contributes to upward pressure on rents and prices in many submarkets, which can create affordability challenges and political pressure for policy responses. Whether these historical patterns continue is uncertain and not assured.
Section 03Jobs and Economic Anchors
Phoenix sits at the center of the Phoenix Mesa Chandler metropolitan labor market. The Bureau of Labor Statistics Economy at a Glance table for Phoenix Mesa Chandler, not seasonally adjusted, shows that in January twenty twenty six the civilian labor force was 2,751.2 thousand persons and total nonfarm employment was 2,460.9 thousand jobs. Unemployment that month was 119.7 thousand persons, yielding an unemployment rate of 4.4%. By preliminary June twenty twenty six data, the labor force was 2,666.9 thousand, employment was 2,536.4 thousand, unemployment was 130.5 thousand, and the unemployment rate stood at 4.9%. Over the same period, total nonfarm employment moved from 2,460.9 thousand in January to 2,451.1 thousand in June, while the twelve month change in total nonfarm employment improved from a small decline at the start of the year to a modest positive rate by June.
These monthly figures can be summarized as follows.
| Month 2026 | Unemployment rate Phoenix Mesa Chandler metro % | Total nonfarm employment thousands | Twelve month change in total nonfarm jobs | Source |
|---|---|---|---|---|
| Jan 2026 | 4.4% | 2,460.9 | down 0.3% | BLS |
| Feb 2026 | 4.2% | 2,485.7 | up 0.2% | BLS |
| Mar 2026 | 4.0% | 2,479.6 | down 0.1% | BLS |
| Apr 2026 | 3.8% | 2,491.4 | up 0.6% | BLS |
| May 2026 | 4.1% | 2,478.0 | up 0.8% | BLS |
| Jun 2026 p | 4.9% | 2,451.1 | up 1.4% | BLS |
The table uses metropolitan area data (Phoenix Mesa Chandler, not seasonally adjusted, 2026) as a proxy for Phoenix city employment conditions, since many large employers and commuting flows cross municipal boundaries. The data show a large, diversified labor market with low to moderate unemployment and modest net job growth over the prior year, consistent with a late cycle environment in which growth is slower than in the immediate post pandemic recovery, but the region remains relatively healthy.
Sector level data from the same Bureau of Labor Statistics table indicate that in June twenty twenty six, Phoenix Mesa Chandler had construction employment around the low one hundred eighties thousands, manufacturing in the mid one hundreds thousands, trade transportation and utilities close to the high four hundreds thousands, professional and business services near the high three hundreds thousands, education and health services around the low four hundreds thousands, leisure and hospitality in the mid two hundreds thousands, and government in the low to mid two hundreds thousands, all not seasonally adjusted and measured in thousands of jobs. Twelve month percentage changes vary by sector, with education and health services, professional and business services, and trade and transportation generally showing positive growth rates, while financial activities and leisure and hospitality have recently seen weaker or slightly negative twelve month changes.
Phoenix city itself hosts a substantial share of these jobs. Major employment anchors in and near Phoenix include large semiconductor and electronics manufacturers, notably advanced fabrication facilities under development in the metro, data centers, aerospace and defense operations, distribution and logistics centers that leverage interstate and air cargo connectivity, and regional or national offices of financial and business service firms. Health care systems, including major hospitals and clinics, and campuses of Arizona State University and other higher education institutions in downtown and central Phoenix add to the base. Government employment from state agencies, courts, and municipal departments further stabilizes demand.
For investors, this economic structure offers several important implications. First, the presence of advanced manufacturing and technology supply chain facilities creates durable, high wage jobs that can support higher rents and home prices in nearby neighborhoods. Second, logistics and distribution employment drives sustained demand for industrial and warehouse space in the urban periphery and in the West Valley, supporting strong industrial performance. Third, although financial activities have seen some employment softness in the most recent year according to the Bureau of Labor Statistics data, the sector still contributes meaningfully to office demand, particularly in suburban corridors. Finally, the mix of education, health care, and leisure and hospitality jobs supports diverse rental and retail demand, but also exposes the market to cyclical risk in lower wage service segments.
Section 04Income
American Community Survey data for Phoenix city, Maricopa County, and the Phoenix Mesa Chandler metropolitan area through the early twenty twenties show that median household incomes in the region have risen in real terms over the past decade, with Phoenix city incomes somewhat below those in higher income suburbs such as Scottsdale and Chandler, but above incomes in some inner ring suburbs and rural Arizona counties. This review does not restate exact current median income figures and their year by year changes, but the source tables indicate a steady climb in median household and per capita incomes, reflecting both wage growth and a changing mix of residents and occupations.
Income distribution data from the American Community Survey reveal a wide range of outcomes across Phoenix neighborhoods. Affluent areas in north and north east Phoenix, around the Biltmore area, and in parts of central infill corridors host high income households working in professional services, technology, management, and health care, or drawing investment and business income. In contrast, many neighborhoods in west and south Phoenix have lower median household incomes, higher shares of employment in lower wage service and production sectors, and higher poverty rates.
At the metropolitan scale, Bureau of Economic Analysis personal income statistics for the Phoenix region show that per capita personal income has grown faster than the national average during some years of the recent expansion, driven by job growth, inward migration of higher earning households, and investment income. However, income gains are unevenly distributed, and housing cost increases have outpaced income growth for many renter households in the lower half of the distribution.
For investors, this income profile supports a stratified housing market. High end multifamily and single family product in neighborhoods with strong school districts, amenities, and access to employment can command premium rents and prices from higher income households. At the same time, the broad base of middle and lower income households creates durable demand for workforce housing, but also limits the headroom for rent increases without causing significant rent burdens. Underwriting for Phoenix assets must account for local income levels by submarket rather than relying solely on metropolitan averages.
Section 05Housing and Multifamily
Census housing unit data and local planning documents indicate that Phoenix city has a very large housing stock dominated by single family detached homes but with a substantial and growing multifamily segment. Multifamily units include traditional garden style communities, low and midrise buildings, townhome style rentals, and mixed use projects with residential units above ground floor retail or office space. Many older apartment properties were built from the nineteen sixties through the nineteen eighties, while the last decade has seen a significant wave of new class A communities, particularly in central and north central Phoenix, in areas near light rail, and in the far north and north west parts of the city.
Private multifamily analytics from CoStar, Yardi Matrix, and RealPage for the Phoenix metropolitan area show that the region experienced rapid rent growth and declining vacancy during the years from roughly twenty fifteen through early twenty twenty two, reflecting strong population and job growth combined with limited new supply relative to demand. In response, developers launched a large pipeline of new multifamily projects, especially from twenty twenty through twenty twenty three, which has been delivering into the market and putting upward pressure on vacancy and concessions in some submarkets. Precise current rent and vacancy rates by class and submarket are available in those datasets and should be consulted directly for current figures.
Housing tenure data from the American Community Survey show that Phoenix has a relatively high share of renter households compared with some suburban communities, reflecting its role as the urban core, the presence of students and young adults, and the stock of multifamily properties. Renter shares are especially high in central and west Phoenix neighborhoods, in older apartment clusters, and near major employment centers.
From an investor perspective, Phoenix multifamily offers a range of strategies. Core and core plus investors can focus on stabilized urban and suburban class A properties in locations with resilient tenant demand and strong amenity bases. Value add strategies target class B and class C garden communities where upgrades to interiors and common areas can justify measured rent increases while maintaining relative affordability. Development and lease up opportunities exist in transit oriented sites, infill parcels, and emerging suburban nodes, though competition from other new projects and construction cost volatility introduce risk. Overall, multifamily in Phoenix city and the broader metro remains a central institutional asset class, but late cycle dynamics and the size of the supply pipeline require careful submarket analysis.
Section 06Rents
Rents in Phoenix are shaped by strong demand, the recent construction wave, and the region's position relative to national affordability benchmarks. The United States Department of Housing and Urban Development publishes fair market rents by bedroom size for the Phoenix metropolitan fair market rent area, which includes Phoenix and surrounding communities. Those fair market rents for one, two, and three bedroom units in recent fiscal years have been higher than statewide Arizona averages, reflecting the concentration of jobs and population in the metro, and have risen over time in line with market rent growth observed by private providers. Specific dollar amounts from the most recent fair market rent schedule are not restated here, but their trajectory reinforces the story of rising housing costs.
Private rental information from CoStar, Yardi Matrix, RealPage, Zillow, and Redfin for the Phoenix metropolitan area shows that average and median asking rents in institutional grade properties increased significantly in the period from the mid twenty tens through the early twenty twenties, with annual growth rates that at times exceeded national averages. Class A properties with new construction and amenities saw the fastest rent gains, while class B and class C stock also experienced meaningful increases, especially in neighborhoods with strong school districts or proximity to employment.
More recently, rent growth has cooled. As interest rates rose and a wave of new supply delivered, landlords in some submarkets introduced concessions such as free months and reduced upfront fees to maintain occupancy. Class A lease up properties in central and north Phoenix and in suburban nodes have been most affected, while more affordable properties with limited nearby new supply continue to experience steady demand and more stable effective rents.
For investors, the key takeaway is that Phoenix rents are no longer at the wide discount to other high growth metropolitan areas that existed a decade ago, but they still offer relative affordability compared with coastal markets. Strategies that depend on very rapid rent growth may be risky in the near term, particularly in submarkets with heavy new construction. Investments that provide durable quality at middle market price points, or that focus on specialized segments such as seniors or students where demand is steady, may offer more resilient rent trajectories, though no such outcome is assured.
Section 07Vacancy
Vacancy conditions in Phoenix multifamily and commercial real estate reflect the interplay between strong demand and substantial new supply. Regional surveys and private data for the Phoenix metropolitan area indicate that multifamily vacancy reached low levels during the late part of the last decade and the early pandemic years, then began to rise as new projects delivered and as national economic conditions normalized.
Class A multifamily properties in central and north central Phoenix, near major employment nodes and along light rail corridors, generally retained high occupancy during much of the expansion but have recently seen higher vacancy and more concessions as competition from new buildings increased. Suburban class A properties in the north and west have experienced similar patterns, though those in fast growing neighborhoods near new employment anchors may fare better. Class B and class C garden style communities in established neighborhoods often maintain lower vacancy, as they cater to renters who seek value and are less likely to move to new, more expensive properties.
In commercial real estate, office vacancy in downtown and suburban Phoenix has risen since the onset of widespread remote and hybrid work. Older office buildings with limited natural light, inflexible floor plates, or dated amenities have been especially affected. Newer office space with modern layouts and good access to transit or freeways has performed better, but lease up times are longer than in earlier periods. In contrast, industrial vacancy in logistics corridors to the west and south of central Phoenix remains low by historical standards, as distribution and manufacturing demand absorb new deliveries.
Because detailed current vacancy statistics for Phoenix city properties by class and use are contained in private data systems, investors should rely on local broker reports and asset level information in addition to these qualitative patterns. The overall picture is that vacancy risk is highest in over supplied luxury apartment and older commodity office segments, and lowest in well located workforce housing and modern industrial space with strong locational advantages.
Section 08Supply Pipeline
Phoenix has long been known as a market with a responsive development sector and a relatively permissive land use environment compared with many coastal cities. Residential building permits data from the United States Census Bureau for Maricopa County and the Phoenix Mesa Chandler metropolitan area show that the region experienced large swings in permitting over the last two decades, with very high construction volumes during the mid two thousands housing boom, a severe contraction during the global financial crisis, and a robust recovery starting in the mid twenty tens.
In the most recent cycle, multifamily permitting accelerated strongly from around twenty twenty through twenty twenty three as developers responded to rapid rent growth, strong absorption, and favorable financing conditions. Many of those permitted projects are in various stages of construction or lease up across Phoenix city, including midrise and podium style communities in central corridors, garden style properties along freeway loops, and mixed use developments in targeted infill locations. Single family permitting also increased, especially in suburban and exurban areas within and beyond Phoenix city limits.
This review does not list precise unit numbers under construction or scheduled for delivery by year, but metropolitan level planning documents and private pipeline tracking consistently describe Phoenix as one of the higher supply markets in the country in recent years. For investors, this means that understanding the depth of the pipeline at the submarket and even micromarket level is crucial. Areas with very large clusters of new multifamily or build to rent single family projects may face near term absorption challenges, while established neighborhoods with limited available land and infill constraints may see relatively tight conditions.
Section 09Single Family Homes
Single family homes are central to the Phoenix housing story. The city and its surroundings are characterized by extensive subdivisions of detached houses, often in master planned communities with shared amenities. Census data show that a large majority of housing units in Maricopa County are single family detached structures, and homeownership rates in many suburban areas are above national averages, although Phoenix city itself has a larger renter share.
Home value data from the Federal Housing Finance Agency and from private sources such as Zillow and Redfin for the Phoenix metropolitan area indicate that single family home prices increased significantly over the last decade. The region experienced strong appreciation from the mid twenty tens onward, with particularly rapid gains from about twenty twenty through early twenty twenty two as low mortgage rates, pandemic era migration, and investor demand converged. Following that period, prices in some submarkets plateaued or retrenched slightly as borrowing costs rose and affordability constraints became more evident, though longer run trends have been positive.
Inventory and months of supply metrics from local multiple listing services, as summarized in brokerage research, show that Phoenix shifted from a relatively tight seller oriented market in the early part of the decade to more balanced conditions as higher mortgage rates reduced buyer capacity and as new construction and resale listings added options. Entry level and midpriced homes near employment centers and with good school access remain competitive, while higher priced segments and outer exurban locations see longer marketing times.
Single family rental is a prominent feature of the Phoenix landscape. Many homes are owned by small investors and rented to local households, but the region has also seen significant activity from institutional single family rental platforms and build to rent developers. These investors were attracted by the region's historic affordability, growth prospects, and ease of operating scale. As mortgage rates increased, demand for rental single family homes strengthened among households who prefer detached living but cannot or choose not to buy.
For investors, single family opportunities in Phoenix span scattered site portfolios, dedicated rental communities, and development joint ventures. Returns depend on careful submarket selection, acquisition basis, management efficiency, and the trajectory of local property taxes, insurance, and maintenance costs. While the long run demand backdrop has been favorable, competition from other investors and from the for sale market, along with the need to price rents within reach of local incomes, create constraints.
Section 10Commercial Real Estate and Retail Centers
Phoenix commercial real estate reflects its role as a growing Sun Belt metro with important logistics, technology, and service functions. Office, industrial, and retail properties cluster in and around downtown, central and north central corridors, the airport area, and numerous suburban nodes.
Office inventory in Phoenix includes downtown towers that house government agencies, law firms, and corporate offices, midrise buildings in the Camelback corridor and the area around the Biltmore, low and midrise complexes along freeway loops, and medical office near major hospital campuses. National shifts toward remote and hybrid work have increased vacancy in many markets, and Phoenix is no exception. Older downtown buildings and commodity suburban offices with limited amenities are struggling to backfill space, while newer, more efficient buildings with strong locations and attractive environments perform better. Exact current office vacancy rates and asking rents by submarket are tracked by CoStar, JLL, CBRE, Cushman and Wakefield, and other private firms, and should be consulted for current figures.
Industrial and logistics real estate is one of Phoenix's strongest sectors. Large distribution centers, fulfillment facilities, and light manufacturing plants have been developed along Interstate highways and in the West Valley and south Phoenix corridors. Low state business taxes, proximity to the California markets and ports via overland routes, availability of land, and growing population make Phoenix an attractive logistics hub. Private market data show that industrial vacancy in key corridors has been at or near historic lows in recent years, even as millions of square feet of new space delivered, and rents have trended upward from prior cycles, though the pace of growth has moderated more recently.
Retail is anchored by grocery centers, power centers with large format retailers, and a smaller number of regional malls and lifestyle centers. Phoenix residents rely heavily on neighborhood and community centers located along major arterials. Grocery anchored centers and centers with daily needs tenants generally report stable occupancy, while properties that rely on purely discretionary spending or older mall configurations face more pressure from changing consumer behavior and competition from e commerce. In some older corridors, obsolete retail buildings are candidates for redevelopment into residential or mixed use projects.
For investors, the commercial landscape in Phoenix suggests that industrial and logistics assets with modern specifications and strong access are likely to remain in favor, while well located grocery anchored and medical retail centers can provide relatively stable income. Office investments require greater selectivity and may focus on medical office, creative or flexible office formats, or buildings with potential for conversion or partial repositioning. Overall, risk and return profiles vary widely by location and asset type, underscoring the importance of detailed local knowledge.
Section 11Transactions and Capital Markets
There is no single public dataset that aggregates all Phoenix property transactions, capitalization rates, and investor types across asset classes in a way that can be fully restated here. Transaction level information is captured in Maricopa County recorded deeds and in private systems such as CoStar and MSCI Real Assets, while brokerage firms publish periodic summaries of investment volumes and pricing for key sectors.
Qualitative evidence from those sources indicates that the Phoenix metropolitan area has been an important destination for institutional and private capital over the last decade, particularly for multifamily, industrial, and single family rental assets. Numerous large multifamily communities and industrial portfolios have traded between institutional owners, and new capital has entered the market through development and acquisition. Capitalization rates compressed significantly during the low interest rate environment of the late twenty teens and early twenty twenties, reflecting investor competition and expectations of continued rent growth.
As interest rates rose and financing conditions tightened, transaction volumes slowed, bid ask spreads widened, and capitalization rates began to expand especially for assets with value add or leasing risk. Assets with strong in place cash flow, modern construction, and prime locations remain more liquid, while older properties with functional challenges can be difficult to sell without price concessions. Lenders have generally adopted more conservative underwriting standards, requiring higher debt service coverage ratios and lower leverage.
For investors, these capital markets dynamics mean that entry pricing and capital structure are critical to achieving target returns. Phoenix still offers yield advantages compared with some coastal markets, but the margin has narrowed, and higher financing costs reduce levered returns. Investment strategies that align hold periods with expected capital market conditions and that contemplate multiple exit pathways, including sales to local operators and institutional buyers, are most prudent.
Section 12Taxes
Arizona's tax structure influences real estate investment outcomes in Phoenix. The state levies individual and corporate income taxes and a transaction privilege tax that functions as a sales tax, with local jurisdictions adding their own rates. Property taxes are administered at the county level. In Maricopa County, the assessor values property, and the treasurer collects taxes based on rates set by various taxing jurisdictions, including the county, the city of Phoenix, school districts, community college districts, and special districts.
Arizona distinguishes between property used as a primary residence and property used for rental or commercial purposes through classification ratios applied to assessed values. Historically, residential rental and commercial properties have faced higher effective tax burdens than owner occupied residences, even when market values are similar. Millage rates and assessment ratios vary over time as voters and policymakers respond to budget needs and tax policy debates.
This review does not state specific numeric tax rates or assessment ratios, because those are best confirmed against current Maricopa County and Arizona Department of Revenue schedules for the relevant year. For investors, property taxes in Phoenix represent a significant operating expense that must be carefully modeled at acquisition. Changes in assessed value following a sale or major improvement can increase tax bills. Knowledge of local tax jurisdiction structures, recent valuation trends, and any voter approved bond measures is important. State income and transaction privilege taxes also affect overall return calculations, especially for investors with significant operating income or development activity.
Section 13Insurance
Insurance in Phoenix and the surrounding region is shaped by exposure to extreme heat, monsoon thunderstorms, hail, dust storms, and occasional flooding, rather than the hurricane and coastal surge risks faced in some other Sun Belt markets. The Arizona Department of Insurance and Financial Institutions regulates carriers that provide property and casualty coverage in the state, while national reinsurance markets influence pricing through broader catastrophe loss experience.
Property insurance premiums for Phoenix assets depend on construction type, age, roof materials, building systems, loss history, and specific location factors such as proximity to washes or flood prone areas. Severe convective storms during the summer monsoon season can produce high winds, hail, and localized flooding that increase claims on roofs, exteriors, and mechanical systems. Wildfire risk is lower in the urban core than in some forested parts of northern and eastern Arizona, but edge communities near desert preserves may still face brush fire exposure.
Flood hazard maps from the Federal Emergency Management Agency show that many parts of Phoenix are outside designated special flood hazard areas, but there are zones along rivers, canals, and washes where flood risk is higher and where lenders may require flood insurance. Drainage infrastructure and the behavior of intense localized storms can produce street flooding even outside mapped zones.
For investors, insurance strategies in Phoenix involve balancing coverage levels, deductibles, and mitigation investments such as roof upgrades, improved site drainage, and resilience focused design. While property insurance costs are generally lower than in high risk coastal markets, recent increases in national catastrophe losses and reinsurance costs have contributed to upward pressure on premiums, and investors should model potential further increases over time.
Section 14Landlord Tenant and Regulatory Environment
Arizona has a landlord tenant regulatory framework that is considered relatively favorable to property owners compared with many coastal states. State statutes set out the rights and obligations of landlords and tenants for residential and commercial leases, including rules on security deposits, notices, remedies for nonpayment, repairs, and remedies for breaches. The state does not have broad rent control, and local governments are limited in their ability to impose rent regulation.
Landlords in Phoenix must maintain units in habitable condition, comply with building and housing codes, and follow specified procedures for evictions and remedies. Tenants have rights to safe and functional housing and may seek legal remedies when landlords fail to meet obligations or act unlawfully. Fair housing laws at federal and state levels prohibit discrimination on the basis of protected characteristics.
The city of Phoenix and other local jurisdictions may have additional ordinances related to rental registration, inspections for certain property types, nuisance abatement, and short term rentals. Arizona has adopted statewide rules that limit local authority to restrict short term rentals, though cities retain some powers related to health, safety, and neighborhood impacts.
For investors, this legal environment provides flexibility in setting rents and managing tenancies, subject to market constraints and legal safeguards. Eviction processes are generally more predictable and faster than in heavily regulated cities, though courts retain discretion and local practices matter. Investors must ensure compliance with all statutes and local ordinances and should consider reputational and political risks associated with aggressive practices in a market where housing affordability is an increasing concern.
Section 15Infrastructure
Phoenix benefits from extensive transportation and utility infrastructure that supports its role as a growing metropolitan region in the desert Southwest. The city is served by Interstate 10 running east west and Interstate 17 running north south, along with the Loop 101, Loop 202, and Loop 303 freeways that form a network connecting suburbs and employment centers. These corridors facilitate commuting and freight movement and help define commercial and residential submarkets.
Phoenix Sky Harbor International Airport is a major hub for passenger and cargo flights, providing connectivity across the United States and to international destinations. The regional light rail system connects central Phoenix with Tempe and Mesa, and recent extensions and planned expansions support transit oriented development in certain corridors. Bus networks and arterial roads provide additional connections, although congestion on key routes can be significant during peak periods.
Water infrastructure is central in a desert city. Phoenix relies on a combination of Colorado River water delivered through the Central Arizona Project canal, surface water from the Salt and Verde rivers, and groundwater. Treatment plants, canals, and distribution networks managed by the city and regional partners provide potable water and handle wastewater. Long term drought and Colorado River basin allocation challenges create strategic risk for water supply, though Phoenix has invested in storage, reuse, and planning to increase resilience.
Electric power is supplied by regional utilities, with a mix of natural gas, nuclear, and growing renewable generation. Transmission and distribution networks must contend with extreme heat, which can increase peak demand and stress equipment. Telecommunications and broadband infrastructure are well developed in most parts of the city, supporting technology and information intensive industries.
For investors, infrastructure quality and plans for expansion are vital. Properties with convenient freeway and transit access, reliable utilities, and good digital connectivity are better positioned to attract tenants and retain value. Water supply and infrastructure condition are particularly important in evaluating long duration investments in Phoenix.
Section 16Climate and Physical Risks
Phoenix has a hot desert climate, with very high summer temperatures, mild winters, and a summer monsoon season that brings thunderstorms, lightning, hail, dust storms, and heavy localized rain. National Oceanic and Atmospheric Administration climate data show that average high temperatures in the peak summer months routinely exceed ninety degrees Fahrenheit and often move well above one hundred degrees, while overnight lows remain elevated. Heat waves have become more frequent and intense over recent decades, contributing to health risks, energy demand spikes, and stress on buildings and infrastructure.
Federal Emergency Management Agency hazard assessments and the National Risk Index identify heat, drought, and severe storms as key hazards for Phoenix and Maricopa County. Flood risk is concentrated along rivers and washes, but intense localized storms can cause flash flooding on roadways and in basements or low lying structures. Dust storms and poor air quality episodes can also pose risks to health and outdoor operations.
Climate change projections suggest that Phoenix is likely to experience higher average temperatures, more frequent extreme heat days, and changes in precipitation patterns over coming decades. These changes may exacerbate water supply challenges in the Colorado River basin, increase cooling loads for buildings, and lengthen the season during which outdoor work and recreation are constrained by heat.
For real estate investors, climate and physical risks in Phoenix call for careful attention to building design, site selection, and long term operating strategies. Buildings should incorporate efficient cooling systems, robust envelopes, shade and landscaping that reduce heat gain, and backup systems for critical functions. Sites in flood prone areas or near washes may require additional mitigation measures. Investors should also consider how future regulations and market preferences may evolve in response to climate and water concerns, including potential premium values for properties that demonstrate resilience and reduced resource intensity.
Section 17Neighborhoods and Submarkets
Phoenix is a large and heterogeneous city with a wide range of neighborhoods and submarkets, each with distinct housing stock, income levels, and investment profiles. While boundaries are not always precise, the following table summarizes several major submarkets that are relevant from a real estate perspective.
| Submarket | Location and character | Dominant housing and property types | Investor themes |
|---|---|---|---|
| Downtown and central Phoenix | Urban core around the central business district, government buildings, cultural institutions, and stadiums | Midrise apartments and condominiums, older office towers, historic single family homes, mixed use projects | Urban infill multifamily, office repositioning, adaptive reuse, mixed use with street level retail |
| Midtown and Camelback corridor including Biltmore area | North of downtown along Central Avenue and Camelback Road, established commercial and residential corridor | Office buildings, midrise multifamily, townhomes, upscale retail, hotels | Office and mixed use repositioning, higher end multifamily, retail tied to affluent households and business travelers |
| North Phoenix and Desert Ridge area | North of central city toward Loop 101, with master planned communities and newer commercial nodes | Single family subdivisions, townhomes, newer apartment communities, retail centers | Stable single family and multifamily, build to rent projects, necessity retail, good access to freeways |
| West Phoenix and Maryvale area | Western neighborhoods with more modest incomes and older housing stock, significant immigrant communities | Older single family homes, garden apartments, strip retail, industrial pockets | Workforce housing, value add multifamily, local retail, attention to community needs and safety |
| South Phoenix and Laveen area | South of the Salt River and extending toward the south west, mix of older neighborhoods, new subdivisions, and agricultural remnants | Single family homes, smaller multifamily, some new subdivisions, industrial and logistics properties along corridors | Infill and redevelopment, single family and build to rent, industrial and last mile logistics, longer term transformation |
| Arcadia and east central corridors | Areas east of central Phoenix toward Scottsdale, including Arcadia neighborhoods | Higher value single family homes on larger lots, low and midrise multifamily, retail and dining | Luxury single family and townhome product, high end rental, mixed use tied to lifestyle and proximity to Scottsdale |
This segmentation highlights how Phoenix encompasses both affluent and modest income neighborhoods, established and emerging submarkets, and a mix of urban and suburban forms. Downtown and central corridors attract institutional interest in multifamily and office repositioning, while north and east neighborhoods offer stable single family and luxury opportunities. West and south areas present value add plays and potential long term appreciation, but they also involve greater operating and community engagement complexity.
Section 18Opportunities
Phoenix presents a broad set of opportunities across asset classes. In multifamily, there is still room for core and core plus investors to acquire well located properties in central and north central corridors, near employment and transit, with strong amenity packages and diversified tenant bases. Value add investors can focus on class B and class C assets in west, south, and some central neighborhoods, where thoughtful renovations and management improvements can enhance performance while maintaining relative affordability.
Single family investors can pursue strategies in established subdivisions that offer good access to jobs and schools and in newer communities where residents prefer rental tenure. Build to rent communities and scattered site portfolios can both be viable, depending on management capabilities and acquisition costs. Longer term, land positions in growth corridors may support development when infrastructure and demand align.
In commercial real estate, industrial and logistics assets in west Phoenix and nearby cities such as Goodyear, Glendale, and Tolleson benefit from strong demand from distribution and manufacturing users. Phoenix city sites near major interchanges and the airport are well positioned. Grocery anchored and medical oriented retail centers in stable neighborhoods can deliver steady income, while selected lifestyle and entertainment projects may capture discretionary spending if they are well executed.
There are also opportunities in specialized segments such as student housing near downtown campuses, senior housing in areas with high retiree concentrations, and mixed use developments along transit corridors. Public private partnerships and collaborations with local agencies and community organizations can unlock complex infill and redevelopment projects. The observations in this section are general and educational, are not projections, forecasts, or assurances of any particular return, yield, occupancy, rent level, or appreciation, and any specific investment must be evaluated on its own facts.
Section 19Risks
Phoenix investments carry several categories of risk that investors must weigh. Market cycle risk is significant in a region that has experienced pronounced booms and corrections in prior housing cycles. Overbuilding in specific submarkets, particularly in luxury multifamily and certain suburban corridors, can lead to elevated vacancy and weaker rent growth in the near term. Office properties face structural headwinds from remote work, and some buildings may require extensive capital or even conversion to achieve long term viability.
Climate and resource risks are central. Extreme heat affects health, building performance, and operating costs. Long term uncertainty about Colorado River allocations and drought conditions raises questions about water availability and pricing over investment horizons of a decade or more. While Phoenix has made investments and plans to manage these challenges, changes in climate, regulation, or public perception could alter the risk profile of particular locations or property types.
Liquidity risk is present despite Phoenix's size, particularly for niche assets or properties outside the most institutional submarkets. During periods of financial stress or higher interest rates, buyer pools can shrink, and marketing times can increase. Regulatory changes at the state or local level affecting property taxes, zoning, short term rentals, or tenant protections could also alter cash flows and valuations.
Finally, social and political dynamics around housing affordability, displacement, and neighborhood change may introduce reputational and policy risks, especially for strategies that rely on significant rent increases or that target lower income communities without clear community benefits. Real estate investments are speculative, are subject to market, financing, liquidity, tax, regulatory, insurance, and physical hazard risks, and can result in the loss of some or all of an investor's invested capital, including the possible loss of principal.
Section 20Investor Implications
For accredited investors, Phoenix should be considered as part of a diversified national portfolio that balances growth potential with risk control. The city and its metropolitan area offer a combination of strong long run population and job growth, a large and diverse housing stock, robust industrial and logistics demand, and a relatively favorable regulatory environment. These factors support income oriented and growth oriented strategies in multifamily, single family rental, and industrial assets.
At the same time, the scale of recent construction, the exposure to climate and water risks, and the structural changes in office demand call for careful underwriting and submarket selection. Investors should prioritize assets with durable demand drivers, such as proximity to major employers, transit, or schools, and with physical characteristics that support resilience, including efficient systems and robust design. Capital structures should be conservative enough to withstand interest rate volatility and potential periods of slower rent growth or elevated vacancy.
Engagement with capable local operating partners, reliance on detailed data from the official and private sources cited here, and attention to regulatory and community developments are essential parts of a considered Phoenix strategy. Investors who integrate these considerations into asset selection and portfolio construction can seek to weigh Phoenix growth opportunities against the distinct risks of this desert metropolitan market. Nothing in this section is a recommendation to pursue any specific strategy or investment, and there is no assurance that any objective or outcome described will be achieved.
Section 21Conclusion
Phoenix has evolved into one of the major metropolitan regions in the United States, with a diverse economy, a large and growing population, and a complex real estate landscape that spans dense urban neighborhoods, expansive suburbs, and industrial corridors. Public data from federal, state, county, and city sources, along with private market analytics, portray a market that has, to date, outperformed in population and job growth, that has experienced significant housing and rent appreciation, and that remains a focal point for institutional and private capital.
This review has used Phoenix Mesa Chandler metropolitan and Maricopa County data as proxies for city conditions where necessary and has relied on qualitative descriptions of census and housing series where it does not restate exact numeric values. Within those constraints, it outlines how multifamily, single family, and commercial segments function, how rents and vacancy respond to supply and demand, how capital and credit conditions shape transactions, and how taxes, insurance, regulation, infrastructure, and climate risk frame long term outcomes.
For accredited investors, Phoenix may offer potential for risk adjusted returns, especially in well located multifamily, industrial, and necessity based commercial assets and in carefully selected single family rental strategies, though no particular outcome or return is assured. Pursuing that potential requires disciplined underwriting, awareness of climate and resource constraints, sensitivity to community dynamics, and alignment with partners and borrowers who understand the on the ground realities of this fast changing region.
Sources
- United States Census Bureau, Decennial Census of Population and Housing, Phoenix city, Maricopa County, and Arizona,, https://www.census.gov/programs-surveys/decennial-census.html
- United States Census Bureau, American Community Survey one year and five year estimates, Phoenix city, Maricopa County, and Phoenix Mesa Chandler metropolitan area,, https://www.census.gov/programs-surveys/acs
- United States Census Bureau, Population and Housing Unit Estimates, Maricopa County and Phoenix Mesa Chandler metropolitan area,, https://www.census.gov/programs-surveys/popest.html
- United States Census Bureau, Building Permits Survey, Maricopa County and Phoenix Mesa Chandler metropolitan area,, https://www.census.gov/construction/bps
- United States Bureau of Labor Statistics, Economy at a Glance, Phoenix Mesa Chandler AZ metropolitan area,, https://www.bls.gov/eag/eag.az_phoenix_msa.htm
- United States Bureau of Labor Statistics, Local Area Unemployment Statistics, Maricopa County and Phoenix region,, https://www.bls.gov/lau
- United States Bureau of Labor Statistics, Quarterly Census of Employment and Wages, Maricopa County,, https://www.bls.gov/cew
- United States Bureau of Economic Analysis, Local Area Personal Income, Maricopa County and Phoenix metropolitan area,, https://www.bea.gov/data/income-saving/local-area-personal-income
- United States Bureau of Economic Analysis, Gross Domestic Product by metropolitan area, Phoenix Mesa Chandler AZ,, https://www.bea.gov/data/gdp/gdp-metropolitan-area
- United States Department of Housing and Urban Development, Fair Market Rents and income limits, Phoenix Mesa Chandler AZ HUD Metro FMR Area,, https://www.huduser.gov
- Federal Housing Finance Agency, House Price Index, Arizona and Phoenix metropolitan area,, https://www.fhfa.gov/DataTools/Downloads/Pages/House-Price-Index.aspx
- Arizona Department of Housing, statewide and regional housing reports and program information,, https://housing.az.gov
- Maricopa County Assessor, property assessment and parcel information for Phoenix,, https://mcassessor.maricopa.gov
- Maricopa County Treasurer, property tax billing information for Phoenix,, https://treasurer.maricopa.gov
- Arizona Department of Revenue, property tax and state tax guidance,, https://azdor.gov
- Arizona Department of Insurance and Financial Institutions, property and casualty insurance information,, https://difi.az.gov
- City of Phoenix, Planning and Development and long range planning materials,, https://www.phoenix.gov/pdd
- City of Phoenix, water services and infrastructure information,, https://www.phoenix.gov/waterservices
- Federal Emergency Management Agency, Flood Map Service Center, Maricopa County and Phoenix,, https://msc.fema.gov
- Federal Emergency Management Agency, National Risk Index, Phoenix and Maricopa County,, https://hazards.fema.gov/nri
- National Oceanic and Atmospheric Administration, National Centers for Environmental Information, climate data for Phoenix and central Arizona,, https://www.ncei.noaa.gov
- CoStar Group, Phoenix metropolitan multifamily, office, industrial, and retail market analytics,, https://www.costar.com
- Yardi Matrix, Phoenix multifamily market reports,, https://www.yardimatrix.com
- RealPage, multifamily analytics for Phoenix market,, https://www.realpage.com/analytics
- Zillow Research, Phoenix metropolitan home value and rent data,, https://www.zillow.com/research/data
- Redfin Data Center, Phoenix housing market data,, https://www.redfin.com/news/data-center
- CBRE Research, Phoenix commercial real estate market reports,, https://www.cbre.com/insights
- JLL Research, Phoenix commercial real estate insights,, https://www.us.jll.com/en/trends-and-insights/research
- Cushman and Wakefield, Marketbeat reports for Phoenix,, https://www.cushmanwakefield.com/en/insights
- MSCI Real Assets, United States Capital Trends including transactions in Phoenix,, https://www.msci.com/our-solutions/real-estate/real-assets