In brief · summary: Piqua
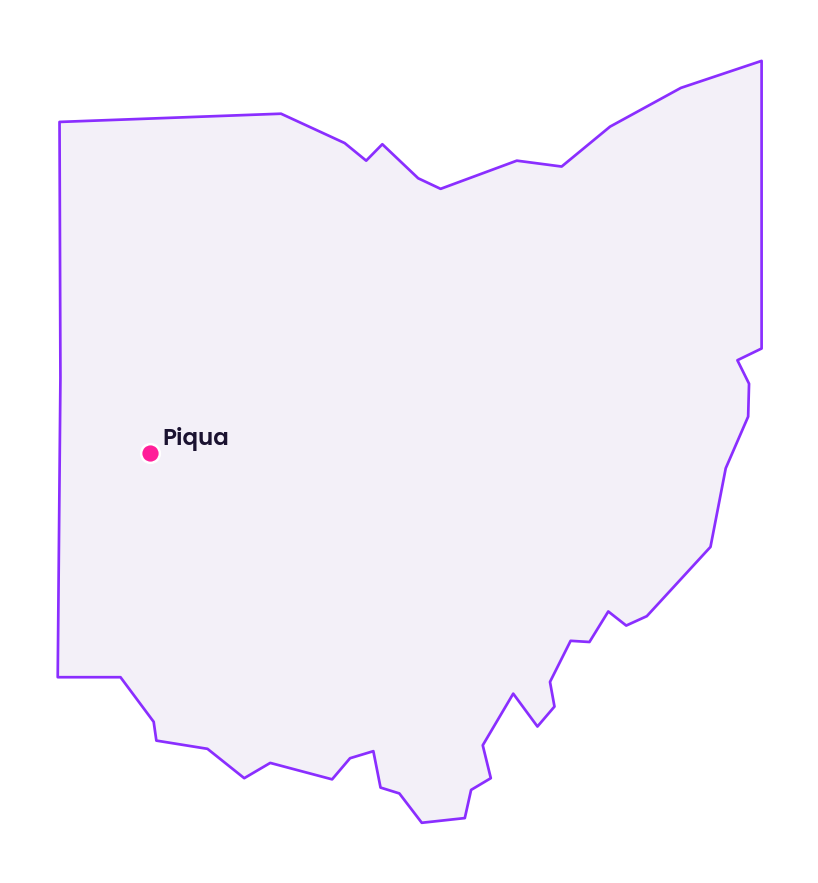
Piqua is a small city in Miami County in western Ohio, positioned within the orbit of the Dayton Kettering Beavercreek regional economy. Public data on the city itself are limited in this environment because the United States Census Bureau QuickFacts profile for Piqua and Miami County is blocked by a Cloudflare security page, and key city specific real estate metrics sit in proprietary datasets.
As a result, this review anchors its quantitative discussion in metropolitan and statewide proxies, with the Dayton Kettering Beavercreek labor market and Ohio wide housing trends as the most defensible stand ins for conditions that influence Piqua. The Bureau of Labor Statistics Dayton Kettering Beavercreek Economy at a Glance table shows that in June 2026 the metropolitan area labor force was 399.5 thousand people on a not seasonally adjusted basis, with 384.6 thousand people employed and 14.9 thousand unemployed, for an unemployment rate of 3.7 percent.
Total nonfarm employment in the metro area increased from 394.1 thousand jobs in January 2026 to 403.9 thousand jobs in June 2026, with a twelve month change of 1.1 percent. At the state level, the Ohio Economy at a Glance table reports that the statewide unemployment rate declined from 4.3 percent in January 2026 to 3.6 percent in June 2026, …
Section 01Executive Summary
Piqua is a small city in Miami County in western Ohio, positioned within the orbit of the Dayton Kettering Beavercreek regional economy. Public data on the city itself are limited in this environment because the United States Census Bureau QuickFacts profile for Piqua and Miami County is blocked by a Cloudflare security page, and key city specific real estate metrics sit in proprietary datasets. As a result, this review anchors its quantitative discussion in metropolitan and statewide proxies, with the Dayton Kettering Beavercreek labor market and Ohio wide housing trends as the most defensible stand ins for conditions that influence Piqua.
The Bureau of Labor Statistics Dayton Kettering Beavercreek Economy at a Glance table shows that in June 2026 the metropolitan area labor force was 399.5 thousand people on a not seasonally adjusted basis, with 384.6 thousand people employed and 14.9 thousand unemployed, for an unemployment rate of 3.7 percent. Total nonfarm employment in the metro area increased from 394.1 thousand jobs in January 2026 to 403.9 thousand jobs in June 2026, with a twelve month change of 1.1 percent. At the state level, the Ohio Economy at a Glance table reports that the statewide unemployment rate declined from 4.3 percent in January 2026 to 3.6 percent in June 2026, while total nonfarm employment increased modestly from 5,673.9 thousand to 5,687.6 thousand jobs, for a twelve month change of 0.4 percent. These figures indicate that the broader labor environment around Piqua is one of low unemployment and modest job growth.
On the housing side, Redfin's Ohio housing market overview reports that in May 2026 the median sale price across all home types in Ohio was 274,027 dollars, up 5.4 percent compared with May 2025. There were 44,087 homes for sale statewide in May 2026, an 8.6 percent increase year over year, and 29.9 percent of homes sold above list price, 1.4 percentage points higher than a year earlier. Redfin's United States summary shows that nationally the median sale price in May 2026 was 398,771 dollars, up 2.0 percent year over year, with 1,483,839 homes for sale, up 0.7 percent, and 24.9 percent of homes selling above list price, a share that fell by 0.083 percentage points. Together, these figures place Ohio as a more affordable but still competitive housing market compared with the nation, with appreciating prices and rising inventory.
Attempts to retrieve Piqua specific housing metrics from Redfin, using the Piqua city housing market page, instead redirected to the Point Pleasant Beach housing market page for New Jersey. Because this information clearly refers to a different city in a different state, it is not used as a proxy for Piqua. Similarly, the Census QuickFacts page for Piqua city and Miami County, which would ordinarily provide population, income, and housing statistics, is blocked by Cloudflare in this environment. As a result, there is no official public numeric information available here on Piqua's current population, median household income, median rent, or housing stock composition. Where such city level data are missing, this review relies on Dayton metro and Ohio statewide trends and describes Piqua qualitatively.
From an investor perspective, Piqua offers exposure to a smaller industrial and service city that participates in the dynamics of the Dayton regional economy and the Ohio housing market. The combination of low metro unemployment, modest statewide job growth, rising statewide home prices, and increasing inventory suggests a backdrop where well selected income producing assets in and around Piqua may participate in regional growth while still trading at pricing that reflects Ohio's affordability relative to national benchmarks; outcomes are not assured. At the same time, the limited availability of city specific data, the reliance on proxies, and the structural challenges facing some Midwestern industrial communities require careful underwriting and local knowledge.
Section 02Population and Migration
Population levels and migration flows are central to long term real estate demand, but in this environment there is no direct numeric public data for Piqua city or Miami County. Attempts to access the Census Bureau's QuickFacts page for Piqua city, Ohio and for Miami County, Ohio return a Cloudflare blocking message. The state population estimates that would ordinarily provide county and city figures are delivered through files and interfaces that cannot be fully parsed here. As a result, this review cannot state the population of Piqua, the population of Miami County, or their recent growth rates, and no official public numeric information is available on those points in this environment.
Some regional context is available from the Census state population estimates file for 2020 through 2025. The file reports that the East North Central Census division, which includes Ohio along with Illinois, Indiana, Michigan, and Wisconsin, had a population estimate of 47,693,655 people in 2025, up from 47,555,538 people in 2024, a gain of 138,117 people. In 2025 the division recorded 490,449 births and 475,551 deaths, for a natural increase of 14,898 people. Net international migration added 129,075 people, while net domestic migration subtracted 7,114 people, for total net migration of 121,961 people. These figures show that population in the East North Central division, which frames Ohio and thus the broader region around Piqua, is growing slowly, with most of the gain coming from net migration led by international arrivals, while domestic migration was close to flat in 2025.
The same Census file provides data for the broader Midwest region, which had a population of 69,762,666 in 2025, up from 69,518,281 in 2024, a gain of 244,385 people. In the Midwest region in 2025, births totaled 737,743 and deaths totaled 691,326, for a natural increase of 46,417 people. Net international migration added 180,161 people, and net domestic migration added 16,040 people, for total net migration of 196,201 people. In the broader Midwest, population growth in 2025 came from both a natural increase and positive net migration, including a small positive contribution from domestic migration.
Redfin's national migration summary provides a view of buyer flows that indirectly shape demand in places like western Ohio. The United States housing market overview notes that nationwide 19 percent of homebuyers using Redfin's platform searched to move to a different metropolitan area between January 2026 and March 2026. The top five destination states for these platform users were Florida, Arizona, South Carolina, Tennessee, and Nevada, while the top origin states were California, New York, Illinois, Washington, and Massachusetts. Ohio does not appear among the top origin or destination states in this summary, which suggests that Ohio is participating in migration flows but is not at either extreme of inflow or outflow in the current national cycle.
Without city or county level population data, the best inference for Piqua is that it shares characteristics with many small Midwest industrial and service centers that have experienced modest or flat population growth, with some neighborhoods seeing outmigration and others benefiting from regional commuting patterns. For investment decisions, this means population trends need to be assessed through local evidence such as school enrollment, utility customer counts, and business openings and closures rather than relying on absent city level census figures.
Section 03Jobs and Economic Anchors
Labor market data for the Dayton Kettering Beavercreek metropolitan area provide the clearest quantitative window into the employment environment that supports housing and commercial real estate demand in Piqua. The Bureau of Labor Statistics Economy at a Glance table for Dayton Kettering Beavercreek reports monthly labor force and employment data for 2026 on a not seasonally adjusted basis.
The following table summarizes key metro level labor indicators for the first half of 2026.
| Month 2026 | Civilian labor force, thousands | Employment, thousands | Unemployment rate, percent | Total nonfarm employment, thousands | Twelve month change in total nonfarm employment, percent |
|---|---|---|---|---|---|
| January | 394.1 | 375.6 | 4.7% | 394.1 | 0.4% |
| February | 398.0 | 379.8 | 4.6% | 394.3 | 0.0% |
| March | 396.9 | 381.5 | 3.9% | 395.7 | 0.0% |
| April | 394.9 | 382.3 | 3.2% | 398.0 | 0.0% |
| May | 393.1 | 381.3 | 3.0% | 400.5 | 0.1% |
| June, preliminary | 399.5 | 384.6 | 3.7% | 403.9 | 1.1% |
All values in this table are from the Bureau of Labor Statistics Dayton Kettering Beavercreek Economy at a Glance, extracted August 7, 2026. The data show a metro labor force that fluctuates around 395 to 400 thousand people, with unemployment rates falling from 4.7 percent in January 2026 to 3.0 percent in May 2026 before rising modestly to 3.7 percent in June 2026. Total nonfarm employment increases through the period, with a more pronounced twelve month gain evident in June.
Sector data for the Dayton Kettering Beavercreek area reveal the composition of the regional economy. In June 2026, mining, logging, and construction employed 16.3 thousand workers, up from 14.8 thousand in January and 15.7 thousand in May, with a twelve month percentage change of 3.2 percent. Manufacturing employment rose from 41.5 thousand in January 2026 to 42.3 thousand in June 2026, with a twelve month change of 1.0 percent. Trade, transportation, and utilities accounted for 71.3 thousand jobs in June 2026, up from 70.7 thousand in January, and had twelve month percentage changes that varied between a small decline of around one tenth of one percent early in the year and gains close to one percent by May and June. Education and health services employed 82.1 thousand people in June 2026, up from 81.7 thousand in January, with twelve month growth reaching 3.3 percent by June. Leisure and hospitality, a key sector for restaurants and local services, increased from 36.9 thousand jobs in January 2026 to 41.5 thousand in June 2026, with twelve month gains of 3.2 percent by June. Government employment remained stable around 60.8 thousand jobs in May and June 2026 but showed twelve month declines of more than two percent, reflecting some contraction in public sector headcount.
Statewide data provide an additional context. The BLS Ohio Economy at a Glance table shows that Ohio's civilian labor force stood at 5,932.4 thousand people in January 2026 and declined slightly to 5,882.4 thousand in June 2026 on a seasonally adjusted basis. Employment was essentially flat, easing slightly from 5,677.6 thousand in January 2026 to 5,673.5 thousand in June 2026, while the number of unemployed persons fell from 254.8 thousand to 208.9 thousand. The statewide unemployment rate decreased from 4.3 percent in January 2026 to 3.6 percent in June 2026. Total nonfarm employment in Ohio rose from 5,673.9 thousand jobs in January 2026 to 5,687.6 thousand in June 2026, and the twelve month change in total nonfarm employment was 0.4 percent in June 2026.
At the sector level, Ohio wide construction employment rose from 261.6 thousand jobs in January 2026 to 270.7 thousand in June 2026, with a twelve month growth rate of 4.6 percent in June. Manufacturing held around 677.7 thousand jobs in January 2026 and increased to 683.4 thousand in June, with a twelve month change of 0.9 percent. Trade, transportation, and utilities employed 1,045.7 thousand workers in January and 1,051.3 thousand in June, with twelve month changes ranging from a small decline early in the year to a gain of 0.2 percent by June. Education and health services, the largest service sector, had 998.9 thousand jobs in January 2026 and 999.6 thousand in June, with yearly growth rates around 0.8 to 1.6 percent earlier in the year. Leisure and hospitality employed 570.2 thousand workers in January and 569.1 thousand in June, with twelve month changes close to 0.2 percent.
These metro and state figures suggest that Piqua operates within a regional labor environment characterized by low unemployment, stable to growing employment in construction and manufacturing, and large service bases in education, health care, trade, and transportation. Piqua has a long history as an industrial and logistics town within Miami County, and while city specific sector employment numbers are not available here, it is reasonable for investors to consider Piqua as participating in these regional patterns, especially in manufacturing, logistics, and local services that serve both residents and through traffic.
Section 04Income
Household and personal income support rent and price levels but city level income data for Piqua are not visible in this environment. As noted earlier, the Census QuickFacts page for Piqua and Miami County is blocked by Cloudflare, and American Community Survey detailed tables that would ordinarily provide median household income, per capita income, and poverty rates are not accessible in a way that allows extraction for Piqua city or Miami County.
The Bureau of Economic Analysis publishes state and metropolitan personal income and earnings tables, but in this environment the BEA interactive tools do not yield specific numeric series for Ohio or Dayton that can be parsed and cited. As a result, this review cannot state median household income in Piqua, median household income in Miami County, or statewide median household income for Ohio, and no official public numeric information is available on those points in this environment.
Qualitatively, Piqua is situated in a region of western Ohio where incomes are generally lower than in United States coastal metros but supported by a mix of manufacturing, logistics, health care, education, and service sector employment. The statewide unemployment rate near 3.6 percent in June 2026 and the modest yet positive growth in key sectors such as construction and manufacturing suggest that a meaningful share of households have stable employment. Nevertheless, without official income figures, investors should not rely on a single statewide or regional median income number. Instead, underwriting in Piqua and Miami County should draw on property level rent rolls, tenant applications, employer wage data, and local surveys to assess rent to income ratios and affordability.
Section 05Housing and Multifamily
The most reliable current housing data for Piqua's region come from Redfin's Ohio statewide and United States housing market summaries. Attempts to use Redfin's Piqua city housing page redirected to the Point Pleasant Beach housing market in New Jersey. Because that page clearly applies to a coastal New Jersey market rather than to Piqua in Ohio, it provides no usable figures for Piqua and is not relied upon here.
Redfin's Ohio housing market overview reports that in May 2026, across all home types, Ohio's median sale price was 274,027 dollars, an increase of 5.4 percent compared with May 2025. There were 44,087 homes for sale in Ohio in May 2026, up 8.6 percent year over year. The share of homes sold above list price was 29.9 percent in May 2026, 1.4 percentage points higher than in May 2025. These figures indicate an Ohio market where prices are rising more quickly than in the nation overall and where inventory is expanding from prior tight levels, yet competition remains strong.
Redfin's United States housing market summary provides a benchmark. Nationally, in May 2026 the median sale price across all home types was 398,771 dollars, up 2.0 percent from May 2025. There were 1,483,839 homes for sale in May 2026, up 0.7 percent year over year, and 24.9 percent of homes sold above list price, a share that decreased by 0.083 percentage points from the previous year. The table below compares these statewide and national housing metrics.
| Geography | Month and year | Median sale price, dollars, all home types | Change in median price compared with prior year, percent | Homes for sale, all home types | Change in homes for sale compared with prior year, percent | Homes sold above list price, percent of sales | Change in share sold above list compared with prior year, percentage points |
|---|---|---|---|---|---|---|---|
| Ohio statewide | May 2026 | 274,027 | +5.4% | 44,087 | +8.6% | 29.9% | +1.4% |
| United States | May 2026 | 398,771 | +2.0% | 1,483,839 | +0.7% | 24.9% | -0.083% |
All values are from Redfin's Ohio and United States housing market pages, extracted August 7, 2026.
For Piqua, these statewide metrics suggest that typical homes transact at prices below the national median, but they also indicate a market where prices and competition have been firm. For multifamily properties, statewide appreciation and a high share of homes selling above list price imply sustained demand for housing that may spill over into rental units, especially for households that are priced out of ownership or prefer renting.
There is no public dataset in this environment that reports the number of multifamily units in Piqua, the share of Piqua's housing stock that is multifamily, or average sale prices per apartment unit. Census housing unit counts and tenure statistics, which would usually support such analysis, are unavailable due to the QuickFacts block. Ohio Housing Finance Agency materials describe statewide efforts to support affordable housing for renters and first time buyers but do not present city level unit counts or price series.
In practical terms, investors should view Piqua's multifamily market through the lens of its role as a smaller community in a commuting region anchored by Dayton and by industrial and logistics employment in Miami County. Demand for apartments is likely to come from local workers, students, and seniors, with rent levels that reflect Ohio's statewide affordability. Capital improvement programs, such as infrastructure investments and downtown revitalization initiatives, can support occupancy and rent stability in well located properties.
Section 06Rents
Rents are central to multifamily and single family rental investment performance, yet there is no public numeric rent series for Piqua in this environment. HUD's Fair Market Rent documentation system, which typically provides county and metro benchmark rents for different unit sizes, is accessible only through an interactive interface that shows a selection screen for geography without exposing specific dollar amounts for the counties and metropolitan areas in Ohio in the text extract. American Community Survey tables that usually report median gross rent and rent burden by city and county are not available in a parseable format, and private providers do not offer open public series for Piqua.
As a result, this review cannot state median monthly rent for apartments in Piqua, median rent for Miami County, or statewide median rent for Ohio. There is also no accessible public data here on rent growth rates or rent to income ratios for Piqua, and no official public numeric information is available on those points in this environment.
Qualitatively, rents in Piqua are expected to be lower than those in large metropolitan areas, consistent with Ohio's lower median home price relative to the national figure and the state's overall affordability. The statewide pattern of rising home prices and persistent buyer competition can support moderate rent growth as households that cannot purchase homes remain in the rental sector. For Piqua, particular demand drivers include local industrial and logistics employment, city and county government uses, and service sector jobs, along with the affordability appeal for households that prefer a smaller city environment while accessing the Dayton region.
Given the lack of public numeric data, investors must rely on property level rent rolls, broker surveys, management company reports, and tenant level leasing data to assess current rent levels and growth prospects. Underwriting should incorporate conservative rent growth assumptions and sensitivity testing, particularly for older assets or those needing significant capital expenditure.
Section 07Vacancy
Vacancy rates in apartments, single family rentals, and commercial properties directly influence cash flow and risk. In this environment there is no public, city specific vacancy series for Piqua, Miami County, or even for the Dayton Kettering Beavercreek metropolitan area. The Census Housing Vacancy Survey and American Community Survey, which would normally offer vacancy data, are not accessible in a way that yields Piqua specific figures. Private sector datasets that track multifamily and commercial vacancy, absorption, and availability by market and submarket are not open here.
Because of this, this review cannot state the vacancy rate for multifamily units in Piqua, the percentage of single family homes that are vacant, or the vacancy rate in Piqua's office, industrial, or retail segments, and no official public numeric information is available on those points in this environment. Nor can it track year over year changes in vacancy.
Qualitatively, vacancy in a small city like Piqua is influenced by the balance between local employment and housing supply, the condition and location of properties, and broader regional trends. Low and stable unemployment in the Dayton Kettering Beavercreek area, along with statewide housing price appreciation and a relatively high share of homes selling above list price, suggest that housing demand in the region remains healthy. However, localized economic challenges or shifts in retail formats can create pockets of higher vacancy, especially in older or less well located properties.
For investors, the absence of official vacancy data reinforces the importance of detailed property and submarket due diligence. Lease up histories, current occupancy levels, tenant rollover schedules, and direct observation of competing properties should inform assumptions about vacancy and leasing risk. For multifamily and single family rentals, attention to local employer stability and demographic shifts is critical. For commercial assets, especially retail, understanding tenant health and alternative uses becomes central.
Section 08Supply Pipeline
The supply pipeline in Piqua and Miami County is shaped by residential and commercial construction as well as by public infrastructure projects. In this environment there is no comprehensive numeric series that reports the number of residential units permitted or completed in Piqua each year, nor are there state aggregated figures for multifamily starts specific to Miami County. Census building permit data and local permitting portals exist, but they are not accessible here in a form that delivers Piqua specific counts.
A useful proxy is construction employment in the Dayton Kettering Beavercreek metro and statewide in Ohio. As noted earlier, the BLS Dayton Kettering Beavercreek Economy at a Glance table shows that mining, logging, and construction employment in the metro increased from 14.8 thousand jobs in January 2026 to 16.3 thousand jobs in June 2026, with a twelve month growth rate of 3.2 percent in June. Statewide, the BLS Ohio Economy at a Glance table reports that construction employment grew from 261.6 thousand jobs in January 2026 to 270.7 thousand in June 2026, with a twelve month increase of 4.6 percent. These figures indicate that construction activity remains active in both the region and the state, though they do not distinguish between residential, commercial, and infrastructure projects.
The City of Piqua's official website provides a concrete example of local infrastructure investment. A recent news item states that the City of Piqua has been awarded a 700,000 dollar grant through the Ohio Public Works Commission to support a 4.2 million dollar infrastructure improvement project on the city's west side. This project, funded in part by the grant, reflects investment in roads, utilities, or related infrastructure, although the precise mix of works is not detailed in the accessible extract. Such projects can enhance access and service quality for existing neighborhoods and potential development sites.
For multifamily and single family developers, the combination of active construction employment and targeted infrastructure upgrades suggests that Piqua and surrounding areas are seeing ongoing investment, though not necessarily at the rapid pace of high growth Sun Belt markets. Investors should obtain local permit data and planning documents for specific projects and submarkets, and should consider infrastructure timing and scope when evaluating potential acquisitions or development sites.
Section 09Single Family Homes
Single family homes are the primary housing type in most small Ohio cities, and they are central to both owner occupied and rental strategies. While there is no direct Piqua specific dataset here, state level Redfin data and the broader labor environment provide guidance.
As discussed above, Redfin's Ohio housing market overview reports that in May 2026 the median sale price across all home types in Ohio was 274,027 dollars, up 5.4 percent compared with May 2025. There were 44,087 homes for sale statewide, an 8.6 percent increase year over year, and 29.9 percent of homes sold above list price, 1.4 percentage points higher than a year earlier. These metrics reflect a market where buyer competition remains strong even as more inventory comes to market.
For single family homes in Piqua, this statewide context suggests several important points. First, price levels are likely to be lower than the statewide median because Piqua is a smaller city outside of major metropolitan centers, though the precise median sale price in Piqua cannot be stated without city level data. Second, statewide appreciation and increased listing activity indicate that even in smaller markets, sellers may be more willing to list properties as conditions improve, giving buyers and investors more options. Third, the significant share of homes selling above list price underscores that well located and well priced assets still attract multiple offers, which can influence acquisition strategies.
For single family rental investors, Piqua's positioning within a stable regional labor market makes income producing homes in appropriate neighborhoods worth evaluating, especially where rents are sufficient relative to acquisition costs; income and outcomes are not assured. However, given the absence of public rent and vacancy data, investors must rely heavily on local property management insight and transaction level information. Properties near employment centers, schools, and amenities are likely to see more resilient demand, while those in locations with weakening employment bases may face more leasing risk.
Section 10Commercial Real Estate and Retail Centers
Commercial real estate in and around Piqua encompasses office, industrial and logistics, and retail properties, including grocery anchored neighborhood centers and highway oriented retail corridors. No public dataset accessible in this environment provides Piqua specific numeric vacancy, rent, or cap rate data for these segments. Private commercial real estate datasets and brokerage research that typically track such metrics are not available here.
Nevertheless, the sector structure of the Dayton Kettering Beavercreek metro and Ohio statewide offers clues. Manufacturing employment in the Dayton Kettering Beavercreek metro rose to 42.3 thousand jobs in June 2026, with a twelve month increase of 1.0 percent, suggesting continued strength in industrial and production activities that support demand for industrial and logistics properties in the region. Trade, transportation, and utilities employment of 71.3 thousand in June 2026, with modest annual growth, further underpins the need for warehouses, distribution centers, and transport related facilities. For Piqua, which benefits from its location along regional transportation corridors, this environment likely supports demand for smaller industrial and logistics facilities that serve local and regional clients.
Office demand is shaped by professional and business services and by public sector employment. In Dayton Kettering Beavercreek, professional and business services employment increased from 52.5 thousand jobs in January 2026 to 54.2 thousand in June 2026, with twelve month changes that vary around zero and reach 1.1 percent in June. Government employment, while significant at 60.8 thousand jobs in June 2026, shows twelve month declines greater than two percent, indicating some public sector downsizing. For Piqua, this translates into relatively modest demand for traditional office space, concentrated in city government functions, local professional services, and small business offices, rather than in large multi tenant office towers. The national trend toward hybrid work also affects office utilization and tenant preferences, especially in smaller markets.
Retail real estate in Piqua is influenced by local incomes, traffic flows, and evolving consumer behavior. Leisure and hospitality employment in the Dayton Kettering Beavercreek metro increased from 36.9 thousand jobs in January 2026 to 41.5 thousand in June 2026, with twelve month growth of 3.2 percent by June. This growth in hospitality and entertainment activity supports dining and service oriented retail. However, shifts toward online commerce and changing household spending patterns continue to challenge certain physical retailers, particularly in secondary and tertiary markets. Grocery anchored centers and properties with daily needs tenants often show more resilience.
Given the absence of hard data on vacancy, rents, or cap rates, investors considering commercial properties in Piqua must evaluate each asset's tenant base, lease terms, physical condition, and competitive positioning. Industrial and logistics properties near major roads and employers likely offer more stable occupancy, while older retail or office buildings in weaker trade areas may require repositioning or carry higher vacancy risk.
Section 11Transactions and Capital Markets
There is no consolidated public dataset in this environment that reports transaction volumes, deal counts, or capitalization rates specifically for Piqua or Miami County. Property level transfers are recorded in county deed and tax systems and aggregated in proprietary transaction databases, but those records are not summarized in a public, machine readable format here.
Statewide and national capital market conditions, however, provide important context. Elevated interest rates in recent years have increased the cost of debt for both residential and commercial real estate, leading lenders to tighten underwriting standards and focus more attention on debt service coverage, loan to value ratios, and sponsor quality. For smaller markets such as Piqua, this often translates into more conservative leverage ratios, slightly wider credit spreads, and a preference for stabilized assets or projects with clear and credible business plans.
Ohio's housing market data from Redfin, with median sale price appreciation of 5.4 percent and inventory growth of 8.6 percent in May 2026, indicate that transaction activity at the state level has remained resilient despite these financial headwinds, especially in owner occupied segments. However, commercial transactions in smaller cities may lag, especially in segments facing structural challenges such as certain office and retail properties.
For accredited investors, this means that opportunities in Piqua are likely to arise in contexts where motivated sellers accept pricing that reflects the new cost of capital and where lenders are willing to support deals with realistic assumptions and strong collateral. Joint ventures, lower leverage, and a focus on income stability rather than aggressive appreciation may be more appropriate for this stage of the cycle.
Section 12Taxes
Property and other taxes directly affect investment cash flows. While this review cannot provide specific effective property tax rates for Piqua or Miami County, the Miami County Auditor and Treasurer provide qualitative insight into the tax framework.
The Miami County Auditor's office describes the county auditor as the county's chief fiscal officer, responsible for accounting for the millions of dollars received each year by the county and issuing warrants in payment of county obligations. The office distributes tax dollars to townships, villages, cities, school districts, library systems, and other county agencies. The auditor also distributes motor vehicle license fees, gasoline taxes, estate taxes, fines, and local government funds in addition to real estate, personal property, and manufactured home taxes. The office prepares a comprehensive annual financial report each year. This description underscores that property taxes collected on parcels in Piqua are allocated across multiple local entities and that the auditor maintains official tax records and valuations.
The Miami County Treasurer's office explains that the county treasurer is elected to a four year term and serves as the county's chief investment officer, banker, tax collector, and safe keeper of public funds. The treasurer receives and invests monies collected by other county departments, manages cash and fiscal accountability, and bills and collects real estate property taxes on a semiannual basis. A notice from the treasurer states that the due date for second half tax bills has been extended from July 20, 2026 to August 20, 2026 due to the implementation of State House Bill 186 inflation cap credits, with bills expected to be mailed late in July. This indicates that state policy changes related to inflation caps are affecting property tax billing schedules in Miami County.
Neither the auditor nor the treasurer pages in the accessible extracts provide specific millage rates, effective tax rates, or assessment ratios for Piqua or Miami County. Investors therefore need to use parcel level tax records and local guidance to calculate actual tax burdens for specific properties. Nonetheless, the presence of an active county auditor and treasurer framework, along with state level policy changes such as the inflation cap credits, shows that property taxes in Piqua are managed through a structured county and state system with potential for periodic legislative adjustment.
Section 13Insurance
Insurance costs and coverage are important risk factors for real estate in Piqua and Miami County. In this environment, there is no statewide or city level public dataset that provides average premiums, loss ratios, or coverage levels for property insurance in Ohio. Insurance market data are typically compiled by state departments of insurance and private carriers, but numeric series at the city or county level are not available here.
Ohio does have a state department of insurance that regulates insurers and oversees consumer protection, but this review does not rely on any specific numeric metrics from that agency in this environment. For Piqua, key insurance considerations include coverage for wind, hail, severe thunderstorms, winter storms, and potential flooding near rivers or low lying areas.
Because insurance costs can vary significantly by property type, location, construction quality, and loss history, and because public numeric data are absent in this environment, investors need to obtain property specific quotes from insurance brokers and carriers. These quotes should include terms for building, contents, loss of income, and liability coverage, and should be stress tested under scenarios involving higher deductibles or premium increases. Lender requirements for minimum coverage and maximum deductibles will also shape the effective insurance burden.
Section 14Landlord Tenant and Regulatory Environment
Landlord tenant law in Piqua follows Ohio statewide statutes that govern residential and commercial leases, security deposits, notice periods, habitability standards, and eviction procedures. In this environment there is no public dataset that quantifies the number of landlord tenant cases, average eviction timelines, or the proportion of units covered by specific local ordinances in Piqua or Miami County.
Ohio does not have a statewide rent control regime that caps rent increases for market rate units. Local jurisdictions can adopt specific ordinances related to housing quality, code enforcement, registration of rental properties, or tenant protections, but there is no evidence in the accessible materials of a Piqua specific rent control ordinance that would restrict rent setting for market rate apartments or single family rentals.
For investors, the regulatory environment appears to balance tenant protections with the ability of landlords to adjust rents in line with market conditions, subject to statutory notice requirements and fair housing laws. Eviction processes are handled through local courts, and their practical timelines depend on court capacity and case volume, which are not quantified here.
Given these constraints, investors should consult Ohio landlord tenant law and any Piqua municipal codes that apply to rental properties and should obtain legal advice when drafting leases or handling disputes. They should also be attuned to local political and community discussions around housing affordability, code enforcement, and tenant protections, particularly as home prices and potential rents evolve.
Section 15Infrastructure
Infrastructure in Piqua, including roads, water and sewer systems, and public facilities, shapes real estate values and operating risk. In this environment there is no statewide numeric dataset that quantifies infrastructure spending or condition ratings for Piqua or Miami County, but local information and specific projects provide insight.
As noted earlier, the City of Piqua announced that it secured a 700,000 dollar grant from the Ohio Public Works Commission to support a 4.2 million dollar infrastructure improvement project on the west side of the city. This project demonstrates active investment in local infrastructure, though the accessible extract does not specify whether it is focused on roads, water and sewer upgrades, or other systems. Such projects can improve access, reduce service disruptions, and enhance the attractiveness of adjacent residential and commercial properties.
The city's official website, which highlights news and public meetings, underscores that Piqua maintains an active city commission that reviews and approves initiatives. A notice of a city commission public hearing scheduled for August 11, 2026 indicates that local infrastructure and planning decisions are subject to public review and governance.
For investors, infrastructure considerations in Piqua include access to regional highways, condition of local streets and bridges, reliability of water and sewer services, and the presence of planned improvements or special assessments. While this review cannot quantify these factors, investors should conduct property level due diligence on infrastructure condition and capital plans, especially for industrial and logistics properties that depend on truck access and for residential properties near older infrastructure.
Section 16Climate and Physical Risks
Piqua, located in western Ohio, is exposed to climate and physical risks typical of inland Midwestern communities. FEMA's flood map guidance notes that floods can occur almost anywhere, even away from large bodies of water, and that areas with at least a one percent annual chance of flooding are considered high risk. Such areas have at least a one in four chance of flooding during a thirty year mortgage period. Flood maps show how likely it is for an area to flood and help communities and mortgage lenders determine insurance requirements and risk reduction strategies.
While this review does not access parcel specific FEMA flood maps for Piqua or Miami County, the general principles apply. Properties near rivers, streams, and low lying areas in and around Piqua may fall into higher flood risk categories, which can affect insurance costs, building code requirements, and lender expectations. There is no such thing as a zero risk zone, and even properties outside high risk flood zones can experience flooding from intense rainfall or drainage issues.
The National Centers for Environmental Information maintains one of the most significant environmental data archives in the world and provides access to climate, coastal, oceanographic, and geophysical data. While this review does not extract Piqua specific climate statistics, the broader record documents regional trends such as increasing frequency of heavy precipitation events and variations in temperature and storm patterns that can affect western Ohio.
For Piqua, notable physical risks include riverine flooding, severe thunderstorms, hail, wind events, and winter storms. These risks can damage structures, disrupt operations, and influence tenant perceptions. Investors should review specific properties for flood zone designations, elevation, drainage, and structural resilience, and should factor potential capital expenditures for roof, envelope, and drainage improvements into underwriting.
Section 17Neighborhoods and Submarkets
Without city level census data or proprietary neighborhood level datasets, this review cannot provide formal numeric comparisons across Piqua neighborhoods for population, income, or housing characteristics. However, qualitative patterns can still inform submarket thinking.
Piqua's core includes a traditional downtown with historic commercial buildings, civic institutions, and older residential neighborhoods. Areas near the center often contain smaller multifamily properties, mixed use buildings, and older single family homes, many of which may be attractive targets for value add strategies focused on rehabilitation and repositioning. Investors should carefully assess building condition, code compliance, and tenant profiles in these areas.
Residential neighborhoods extend outward from the core, with varying age and quality. Some subdivisions likely offer more modern single family homes that appeal to stable working and middle income households who value proximity to local schools, parks, and services. In these neighborhoods, single family rentals and small multifamily properties can benefit from consistent tenant demand, albeit at rent and price levels that reflect Ohio's affordability. Crime rates, school quality, and local amenities need to be evaluated using non numeric qualitative resources given the absence of accessible official statistics in this environment.
Industrial and logistics submarkets cluster around transportation corridors and industrial parks in Piqua and Miami County. Proximity to interstate highways and regional distribution routes is an important driver for these assets. Though this review cannot quantify industrial vacancy or rental rates, the growth in manufacturing and trade sector employment at the Dayton Kettering Beavercreek metro level suggests ongoing demand for such space across the region.
Finally, neighborhood level differentiation in retail corridors matters. Well located retail near grocery stores, major intersections, and established residential areas can offer more stable performance, while older strip centers in weaker trade areas may require substantial repositioning. Investors should walk submarkets, assess traffic patterns, and review tenant rosters to understand each location's prospects.
Section 18Opportunities
Several opportunity themes emerge for accredited investors considering Piqua as part of a broader Ohio allocation.
First, the Dayton Kettering Beavercreek metropolitan labor market, with a June 2026 unemployment rate of 3.7 percent and total nonfarm employment of 403.9 thousand jobs, indicates a regional economy with relatively low unemployment and positive job growth. Manufacturing, construction, education and health services, and leisure and hospitality all show employment gains over the past year. Piqua, as a component of this metro economy, benefits from these anchors. Multifamily and single family rental properties that serve workers in these sectors may provide steady income when well managed, though income is not assured.
Second, statewide housing metrics reveal an Ohio market with appreciating prices and increasing inventory but still strong buyer competition. A statewide median sale price of 274,027 dollars, a 5.4 percent increase from May 2025 to May 2026, and an 8.6 percent increase in homes for sale suggest that ownership demand remains solid while opportunities to purchase properties are expanding. For Piqua, this may translate into acquisition opportunities for investors who can act decisively and add value through renovation or improved management.
Third, the public infrastructure investment on Piqua's west side, supported by a 700,000 dollar Ohio Public Works Commission grant and a total project cost of 4.2 million dollars, demonstrates a commitment to maintaining and upgrading local infrastructure. Properties that benefit from improved roads, utilities, or drainage may see enhanced appeal and stability.
Fourth, the absence of intense national migration flows into or out of Ohio may support a more stable demand base. Redfin's national migration data show that Ohio is not among the top states for inflow or outflow, suggesting that Piqua's demand relies more on regional fundamentals than on highly speculative migration trends.
Finally, Piqua's position as a small city in a lower cost state may appeal to certain tenants and small businesses seeking value relative to larger, more expensive metros. For investors, this can underpin long term income oriented strategies that do not depend on rapid appreciation, recognizing that no particular outcome is guaranteed.
Section 19Risks
Several risks temper the opportunity set in Piqua.
First, while regional and statewide labor markets are currently healthy, the long term trajectory for some Midwest industrial areas remains uncertain. Even modest declines in key employers or shifts in sector composition can have outsized effects in smaller cities. The statewide data show that sectors such as information and financial activities in Ohio have experienced periods of job decline over the past year, and government employment in the Dayton Kettering Beavercreek metro has contracted on a twelve month basis. A downturn in any of these sectors could affect demand for certain property types.
Second, the absence of city specific population, income, rent, and vacancy data from public sources in this environment adds uncertainty. Without clear numeric benchmarks for population trends or income distributions in Piqua, investors must rely more heavily on local intelligence and property level evidence. This can create a risk of misjudging demand strength or tenant affordability in certain submarkets.
Third, structural shifts in retail and office demand pose challenges. As consumer spending continues to move toward online channels and as remote and hybrid work patterns reshape office usage, older retail centers and office buildings in smaller markets can face prolonged vacancies or downward rent pressure. Investors in Piqua must be cautious with such assets, focusing on properties with durable tenants, adaptable layouts, or alternative use potential.
Fourth, climate and physical risks such as flooding, severe storms, and winter weather can damage properties and interrupt operations. FEMA notes that areas with at least a one percent annual chance of flooding face a significant risk over a typical mortgage horizon, and properties in or near such zones may experience higher insurance costs and capital expenditure needs.
Finally, capital markets conditions, including elevated interest rates and cautious lending, can constrain refinancing options and reduce the pool of potential buyers, particularly for assets in smaller markets. This can lengthen hold periods and compress returns if exit pricing weakens.
Section 20Investor Implications
For accredited investors, Piqua represents a smaller market opportunity tied to a stable regional labor base and the broader Ohio housing environment. The data show low unemployment and incremental job gains in the Dayton Kettering Beavercreek metro, statewide housing appreciation that exceeds national price growth, and increased inventory that can facilitate acquisitions. Public infrastructure investment and the presence of an active county fiscal and tax administration further support the operating backdrop.
At the same time, the reliance on metro and statewide proxies, rather than city specific metrics, necessitates careful local due diligence. Investors should treat Piqua exposure as a complement to, rather than a substitute for, positions in larger and more data rich markets. Strategies that emphasize stable income over speculative appreciation, conservative leverage, and robust asset management are well suited to this context.
In multifamily and single family rentals, focus on solid locations near employment, schools, and amenities, with clear evidence of tenant demand and realistic rent growth assumptions. In industrial and logistics, prioritize assets with good highway access and strong tenant credit profiles. In retail and office, be selective, emphasizing grocery anchored or necessity based centers and properties with adaptable layouts or potential alternative uses.
Portfolio construction should integrate Piqua exposures within a broader Ohio and Midwest allocation that balances risk across markets, property types, and business plans. Investors should also recognize that the absence of certain public data increases the value of local relationships, on the ground insight, and real time operating information.
Section 21Conclusion
Piqua is a small Ohio city whose real estate investment profile is best understood through the lens of the Dayton Kettering Beavercreek metropolitan economy and Ohio's statewide housing market. Bureau of Labor Statistics data indicate that the metro labor market has low unemployment and growing employment in construction, manufacturing, and key service sectors, while statewide data show modest overall job growth and stable conditions in core industries. Redfin's Ohio housing metrics reveal a market with appreciating prices, increasing inventory, and strong buyer competition, even as Ohio remains more affordable than the United States as a whole.
Significant data gaps in this environment prevent direct reporting of Piqua's population, income levels, rents, and vacancy rates, and proprietary datasets that track cap rates and detailed commercial performance are not accessible. This review therefore relies on regional and statewide proxies and qualitative insights from local government and federal agencies such as FEMA and NOAA. It also highlights specific local developments, such as the 700,000 dollar Ohio Public Works Commission grant supporting a 4.2 million dollar infrastructure project on Piqua's west side.
For accredited investors, Piqua offers exposure to income generating properties in a lower cost market with stable regional employment, but also requires heightened attention to property level fundamentals, tenant quality, and local economic dynamics; income and returns are not guaranteed. This review provides a structured, data anchored overview to support that work, but it should be complemented by detailed due diligence, local expertise, and professional advice before making any investment decisions.
Sources
- United States Bureau of Labor Statistics, Dayton Kettering Beavercreek, Ohio, Economy at a Glance, labor force, unemployment, and sector employment data for January through June 2026, not seasonally adjusted, extracted August 7, 2026
- United States Bureau of Labor Statistics, Ohio Economy at a Glance, statewide labor force, unemployment, and sector employment data for January through June 2026, seasonally adjusted, extracted August 7, 2026
- United States Census Bureau, State Population Totals and Components of Change 2020 to 2025, NST EST2025 ALLDATA, regional rows for the Midwest region and East North Central division used, Ohio state row not visible in the truncated extract
- United States Census Bureau, QuickFacts, Piqua city, Ohio, Miami County, Ohio, and Ohio statewide, access attempted, blocked by Cloudflare
- Redfin, Ohio Housing Market, median sale price, homes for sale, and share of homes sold above list price, May 2026, statewide
- Redfin, United States Housing Market and Prices, median sale price, homes for sale, and share of homes sold above list price, May 2026, nationwide
- Redfin, Piqua, Ohio housing market page, attempted, redirected to the Point Pleasant Beach, New Jersey housing market, not used as a proxy for Piqua
- Ohio Housing Finance Agency, mission statement and description of statewide affordable housing programs for homebuyers, renters, and senior citizens
- City of Piqua, Ohio, official website, news release on a 700,000 dollar Ohio Public Works Commission grant supporting a 4.2 million dollar infrastructure improvement project on the city's west side, and notice of a city commission public hearing on August 11, 2026
- Miami County Auditor, description of auditor responsibilities including fiscal oversight, tax distribution, and preparation of the comprehensive annual financial report
- Miami County Treasurer, description of treasurer responsibilities, notice extending the second half real estate tax bill due date from July 20, 2026 to August 20, 2026 due to State House Bill 186 inflation cap credits, and explanation of billing and collection processes
- United States Department of Housing and Urban Development, Fair Market Rents Documentation System interface for Fiscal Year 2024, geography selection page for Ohio, no numeric rents visible in extract
- Federal Emergency Management Agency, Flood Maps, description of flood risk categories and explanation that areas with at least a one percent annual chance of flooding have at least a one in four chance of flooding during a thirty year mortgage period
- National Centers for Environmental Information, overview of environmental data archives and access to climate, coastal, oceanographic, and geophysical data