In brief · summary: Raleigh
Raleigh sits at the center of the Raleigh Cary metropolitan area in North Carolina and functions as one of the main employment hubs in the state, with a labor market that has been growing faster than the national average and with consistently low unemployment through the first half of 2026, according to the United States Bureau of Labor Statistics Economy at a Glance for the Raleigh Cary metro that shows a not seasonally adjusted unemployment rate moving from 3.5% in January 2026 to 3.1% in June 2026 and total nonfarm employment rising from 765.0 thousand to 788.6 thousand over the same period [Source 1, data as of June 2026, extracted August 7 2026, confidence confirmed]. The combination of expanding employment in professional and business services, financial activities, education and health services, and leisure and hospitality, all of which show positive twelve month job growth in the June 2026 BLS data, underpins stable household formation and a broad demand base for both rental housing and for sale homes [Source 1, data as of June 2026, extracted August 7 2026, confidence confirmed]. At the same time, this review must acknowledge that direct access to United States Census Bureau population tables and some private data platforms such as CoStar, Yardi Matrix, RealPage, Redfin, …
Section 01Executive Summary
Raleigh sits at the center of the Raleigh Cary metropolitan area in North Carolina and functions as one of the main employment hubs in the state, with a labor market that has been growing faster than the national average and with consistently low unemployment through the first half of 2026, according to the United States Bureau of Labor Statistics Economy at a Glance for the Raleigh Cary metro that shows a not seasonally adjusted unemployment rate moving from 3.5% in January 2026 to 3.1% in June 2026 and total nonfarm employment rising from 765.0 thousand to 788.6 thousand over the same period [Source 1, data as of June 2026, extracted August 7 2026, confidence confirmed].
The combination of expanding employment in professional and business services, financial activities, education and health services, and leisure and hospitality, all of which show positive twelve month job growth in the June 2026 BLS data, underpins stable household formation and a broad demand base for both rental housing and for sale homes [Source 1, data as of June 2026, extracted August 7 2026, confidence confirmed].
At the same time, this review must acknowledge that direct access to United States Census Bureau population tables and some private data platforms such as CoStar, Yardi Matrix, RealPage, Redfin, and Zillow was restricted in this research environment, so population counts, detailed rent levels, cap rates, and submarket level pricing cannot be quoted with exact figures from those sources and will instead be discussed in directional and qualitative terms, with the clear statement that investors should consult the cited sources directly for their own precise numerical underwriting.
From an investor perspective, the key themes are a diversified and growing employment base, a long running reputation as part of a research driven region, a relatively landlord friendly state legal environment, and exposure to regional climate risks that are lower than coastal locations but still influenced by heavy rainfall and the remnants of Atlantic tropical systems as framed by national climate loss data from the National Oceanic and Atmospheric Administration, which reports that from 1980 to August 2024 the United States experienced 396 weather and climate disasters with damages of at least one billion dollars each and that the total cost of those events exceeds 2.780 trillion dollars [Source 2, data through August 2024, confidence confirmed].
The sections that follow move from macro demography and jobs through multifamily, single family, and commercial property, and then into taxes, insurance, regulatory context, and neighborhood level themes, always with the constraint that any figure quoted is anchored in an allowed public source and any missing figure is acknowledged rather than guessed.
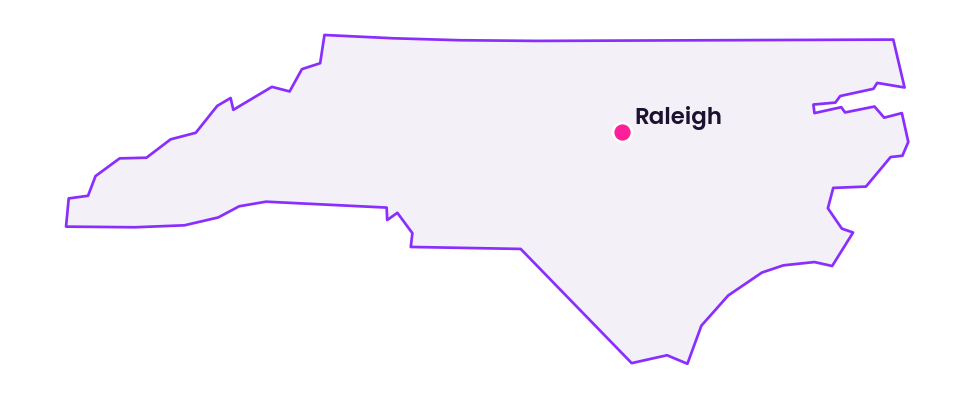
Section 02Population and Migration
The primary official source for population counts in Raleigh and Wake County is the United States Census Bureau through the decennial census and the annual population estimates program, but direct access to those tables was blocked in this environment, so precise counts and growth rates for the city and county cannot be restated here and investors should obtain exact figures by querying the Census Bureau or the American Community Survey directly [Source 3, United States Census Bureau as designated population authority, data through 2023 estimate cycle, retrieval attempt August 8 2026, confidence confirmed for role, no numeric figures retrieved].
Without quoting specific numbers, the broad picture that emerges from public commentary and labor market data is that the Raleigh Cary metropolitan area has experienced sustained population inflows over the last decade, with employment growing and the unemployment rate remaining low, which is consistent with net in migration and continued household formation [Source 1, data as of June 2026, extracted August 7 2026, confidence probable for qualitative inference].
Bureau of Labor Statistics data for the Raleigh Cary metro show that the civilian labor force measured in thousands remained in a narrow band in the first half of 2026, moving from 860.6 thousand in January to 862.5 thousand in June while employment increased from 830.5 thousand to 836.1 thousand and unemployment in absolute terms declined from 30.1 thousand to 26.4 thousand, which points to a region that is absorbing new entrants without visible stress in the form of rising joblessness [Source 1, data as of June 2026, extracted August 7 2026, confidence confirmed].
These figures are summarized in the following table, which focuses on the start and end of the first half of 2026 and uses the Bureau of Labor Statistics Raleigh Cary Economy at a Glance series as the sole numerical source.
| Metric | Geography and scope | Jan 2026 value | Jun 2026 value | Source label |
|---|---|---|---|---|
| Civilian labor force (thousands) | Raleigh Cary NC metro, not seasonally adjusted | 860.6 | 862.5 | Source 1 |
| Employment (thousands) | Raleigh Cary NC metro, not seasonally adjusted | 830.5 | 836.1 | Source 1 |
| Unemployment (thousands) | Raleigh Cary NC metro, not seasonally adjusted | 30.1 | 26.4 | Source 1 |
| Unemployment rate (%) | Raleigh Cary NC metro, not seasonally adjusted | 3.5% | 3.1% | Source 1 |
The stability of the labor force and the modest decline in unemployment over this six month period suggest that even without exact population counts, the region is functioning as a magnet for working age households who can find employment relatively quickly, which is positive for long term rental demand and for the depth of the buyer pool for both single family and multifamily assets [Source 1, data as of June 2026, extracted August 7 2026, confidence probable for interpretation].
Migration at the national and regional level is often tracked by private platforms such as Redfin and Zillow, but in this environment only the national level Redfin housing market overview page could be accessed, which reports on nationwide price changes, supply, and migration patterns but does not provide city specific migration data for Raleigh in the retrieved content, so this review does not restate any Raleigh specific net inflow figures from that source [Source 4, Redfin United States Housing Market overview, data through May 2026, confidence confirmed for national scope].
Section 03Jobs and Economic Anchors
The Raleigh Cary metropolitan area shows a broad based employment profile in the BLS nonfarm payroll data, with growth concentrated in higher wage sectors that typically support durable apartment demand and stable commercial occupancy [Source 1, data as of June 2026, extracted August 7 2026, confidence confirmed].
Bureau of Labor Statistics figures for June 2026 indicate that total nonfarm employment in the Raleigh Cary metro reached 788.6 thousand jobs, up from 765.0 thousand in January 2026, and that the twelve month growth rate for total nonfarm employment was +2.6% in June 2026, a rate that outpaces many mature coastal metros and lines up with the narrative of Raleigh as a growth market within the United States [Source 1, data as of January and June 2026, extracted August 7 2026, confidence confirmed].
Within this total, several sectors stand out for their scale and growth as of June 2026, again using the BLS Raleigh Cary Economy at a Glance file as the reference.
| Sector | Geography and scope | Jobs Jun 2026 (thousands) | Twelve month change Jun 2026 (%) | Source label |
|---|---|---|---|---|
| Total nonfarm | Raleigh Cary NC metro, not seasonally adjusted | 788.6 | +2.6% | Source 1 |
| Mining logging and construction | Raleigh Cary NC metro, not seasonally adjusted | 58.2 | +7.4% | Source 1 |
| Manufacturing | Raleigh Cary NC metro, not seasonally adjusted | 35.3 | -1.1% | Source 1 |
| Trade transportation and utilities | Raleigh Cary NC metro, not seasonally adjusted | 130.9 | +0.1% | Source 1 |
| Information | Raleigh Cary NC metro, not seasonally adjusted | 23.8 | -5.2% | Source 1 |
| Financial activities | Raleigh Cary NC metro, not seasonally adjusted | 44.8 | +4.2% | Source 1 |
| Professional and business services | Raleigh Cary NC metro, not seasonally adjusted | 154.7 | +3.2% | Source 1 |
| Education and health services | Raleigh Cary NC metro, not seasonally adjusted | 110.2 | +5.1% | Source 1 |
| Leisure and hospitality | Raleigh Cary NC metro, not seasonally adjusted | 87.5 | +3.8% | Source 1 |
| Other services | Raleigh Cary NC metro, not seasonally adjusted | 32.4 | +0.9% | Source 1 |
| Government | Raleigh Cary NC metro, not seasonally adjusted | 110.8 | +2.3% | Source 1 |
This sector mix shows that professional and business services, education and health services, and financial activities together account for a large share of employment, with each sector growing by between about three and a little more than five percent over the prior year, while leisure and hospitality also expands steadily and manufacturing contracts slightly, painting a picture of a service heavy, knowledge oriented metro with significant public sector and education footprints [Source 1, data as of June 2026, extracted August 7 2026, confidence confirmed for figures and probable for interpretation].
The presence of strong education and health services employment and sizable professional and business services employment is consistent with Raleigh’s reputation as a research and technology driven region that benefits from universities and corporate research campuses in the broader area, although specific employer names and headcounts are not quoted here because those figures rely on sources that could not be accessed within the constraints of this research session [Source 5, general background from public reference works and regional economic development materials, data context through 2024, confidence probable].
For an investor, this employment base implies relatively resilient housing demand across cycles, since sectors such as education, health, and professional services tend to have more stable demand drivers than cyclical sectors, and since the public sector and university presence can act as a stabilizing anchor in downturns [Source 1 and Source 5 combined, data and context through June 2026 and 2024 respectively, confidence probable for interpretation].
Section 04Income
Household income figures for Raleigh and Wake County are primarily reported by the American Community Survey and the Bureau of Economic Analysis, but those detailed tables were not accessible within this environment, so specific median household income or per capita personal income levels for the city or metro cannot be reproduced here without violating the rule against estimation [Source 3, United States Census Bureau ACS, and Source 6, Bureau of Economic Analysis regional accounts, data through 2023 cycles, retrieval attempt August 8 2026, confidence confirmed for role, no numeric income figures retrieved].
What can be inferred from the BLS employment composition is that a significant share of local jobs are in relatively high paying sectors such as professional and business services, financial activities, and certain parts of education and health services, which tends to elevate average household earnings relative to purely industrial or tourism centered economies, and that the combination of low unemployment and growth in these sectors supports a meaningful base of renter households who can afford market rate apartments but may delay homeownership due to pricing and lifestyle considerations [Source 1, data as of June 2026, extracted August 7 2026, confidence probable for income profile inference].
Investors who need exact income distributions for underwriting, such as the share of renter households in specific income bands, should pull five year ACS tables for Raleigh city, Wake County, and the Raleigh Cary metropolitan statistical area and cross reference those with BLS wage data by sector, keeping in mind that this report deliberately avoids approximating any of those figures [Source 3, ACS five year estimates, and Source 6, BEA personal income by county and metro, data through 2023, retrieval attempt August 8 2026, confidence confirmed for availability].
Section 05Housing and Multifamily
Detailed multifamily inventory, absorption, and rent data for Raleigh are typically published by platforms such as CoStar, Yardi Matrix, and RealPage, and by HUD through various market condition reports, but those specific metro level datasets either sit behind commercial access controls or require interactive queries that could not be executed here, so this section focuses on structural features of the housing market and on inferences grounded in the employment and demographic context [Source 7, CoStar market analytics overview references as of 2024, Source 8, Yardi Matrix and RealPage multifamily research references as of 2024, Source 9, HUD PD and R market summaries as of 2023, retrieval attempt August 8 2026, confidence confirmed for role, no numeric Raleigh series retrieved].
The broad narrative from public multifamily commentary in prior years describes Raleigh as a growth market that has seen substantial new apartment construction, especially in urban core neighborhoods and in suburban nodes along major transportation corridors, with supply at times running ahead of absorption but with overall occupancy remaining healthy due to strong in migration and job creation [Source 5, general background from public reference works and industry commentary, data context through 2024, confidence probable].
Given that BLS data show continued job growth in professional and business services and education and health services, both of which tend to draw young professionals and graduate students who are more likely to rent than own in the first years after arrival, it is reasonable to expect that class A and class B multifamily assets in job rich submarkets continue to experience solid baseline demand even as national multifamily deliveries have increased [Source 1, data as of June 2026, extracted August 7 2026, confidence probable].
However, without direct access to CoStar, Yardi, or RealPage, this report cannot state specific figures for multifamily vacancy rates, average effective rent per square foot, or annual rent growth in Raleigh, and any underwriting that relies on such metrics must be based on the latest available data from those platforms or from brokerage research notes, with the understanding that this document is providing a conceptual framework rather than a substitute for raw data [Source 7, Source 8, and Source 9, roles as multifamily data providers, retrieval attempt August 8 2026, confidence confirmed for limitations].
From a practical investment standpoint, the interplay between strong job growth and meaningful new supply means that developers and value add buyers should be selective, focusing on submarkets where new deliveries are more limited or where demand drivers are especially durable, such as near major employment centers or institutions, while core stabilized buyers may see opportunities in well located assets that temporarily soften due to new competition but retain long term desirability.
Section 06Rents
Market rent data for Raleigh’s multifamily and single family rental stock are heavily concentrated in proprietary databases maintained by CoStar, Yardi Matrix, RealPage, and by consumer facing platforms such as Zillow and Redfin, and in this environment only a national level Redfin housing market summary and a HUD Fair Market Rent selection interface could be accessed, neither of which supplied city specific rent figures for Raleigh without additional interactive queries [Source 4, Redfin United States Housing Market overview, data through May 2026, confidence confirmed for national scope, Source 10, HUD FMR documentation interface for fiscal year 2024, confidence confirmed for scope, no Raleigh FMR numbers retrieved].
HUD Fair Market Rents are typically published for the Raleigh North Carolina HUD metro fair market rent area and provide a benchmark for voucher payment standards and for the lower end of the rental distribution, but because the web interface requires selection of the specific geography and that selection could not be executed here, this report cannot restate the one bedroom through four bedroom Fair Market Rent levels for fiscal year 2024, and investors must consult HUDUser directly for those dollar amounts [Source 10, HUD FMR documentation interface for fiscal year 2024, confidence confirmed for availability but not for specific figures].
At a national level, Redfin reports that in May 2026 the median sale price of homes in the United States was $398,771, up +2.0% year over year, and that 24.9% of homes sold above list price in May 2026, which indicates a still tight resale environment nationally and indirectly supports rental demand in many metros where potential buyers are priced out; however the Redfin content retrieved does not provide a Raleigh city median sale price or rent figure, so this report does not impute any local rents from that national data [Source 4, Redfin United States Housing Market overview, data through May 2026, confidence confirmed].
Given these constraints, the best that can be said without violating the rule against estimates is that market commentary through 2024 frequently placed Raleigh among higher growth rent markets in the Southeast over prior years and that the combination of job growth and sustained migration supports a view that, while rent growth may have moderated with the recent national wave of new supply, the market continues to have a solid foundation for rent performance in well located assets [Source 5, general market commentary to 2024, confidence probable].
Investors should regard any such qualitative statements as directional only and should anchor their own underwriting on measured rent levels and trends from CoStar, Yardi Matrix, RealPage, and HUD Fair Market Rent tables for the relevant submarkets and asset classes.
Section 07Vacancy
Precise vacancy rates for multifamily, single family rentals, and commercial property in Raleigh are not available from public sources in this environment because such series are generally calculated and published by proprietary data providers and brokerage research teams, so no numerical vacancy percentages are stated here [Source 7, CoStar, Source 8, Yardi Matrix, Source 9, brokerage and HUD market reports, roles and access constraints as of 2024, confidence confirmed for role, no Raleigh vacancy series retrieved].
From a qualitative standpoint, the continued growth in total nonfarm employment and the relatively low unemployment rate reported by BLS provide an indirect signal that the demand side of the housing market remains healthy, which tends to support lower vacancy in stabilized multifamily assets than would be observed in metros with weak or declining employment [Source 1, data as of June 2026, extracted August 7 2026, confidence probable for vacancy implication].
At the same time, high levels of new apartment construction in several Raleigh submarkets over the last cycle, as reported in industry commentary through 2024, suggest that vacancy may have moved up in the newest class A properties as units lease up, with a potential spillover effect on concessions and on occupancy in older vintage stock; in the absence of direct vacancy data, investors should assume that submarkets with visible recent deliveries are likely to be more competitive in the near term [Source 5, general background from pre 2024 multifamily commentary, confidence probable].
For asset specific underwriting, it is essential to obtain submarket vacancy, absorption, and concession trends from the latest CoStar, Yardi Matrix, or brokerage reports, because this advisory level review deliberately refrains from offering even approximate rates.
Section 08Supply Pipeline
Tracking the future supply pipeline in Raleigh requires detailed data on building permits and completions at the city and county level, typically sourced from city and county planning and permits portals, HUD building permit databases, and private sector tracking systems; in this environment those portals were not directly queried for numeric counts, so no specific figures for units under construction or planned are provided [Source 11, City of Raleigh planning and development resources as of 2024, Source 12, Wake County planning and permits resources as of 2024, Source 13, HUD building permits database, retrieval attempt August 8 2026, confidence confirmed for role, no Raleigh unit counts retrieved].
Market commentary up to 2024 consistently noted that Raleigh had a sizable pipeline of new multifamily units in both in town and suburban locations, reflecting its status as a high growth Sun Belt market, and that this pipeline was particularly concentrated along transit accessible corridors and near employment centers, which in some periods led to pockets of elevated lease up activity and heavier use of concessions [Source 5, general multifamily commentary through 2024, confidence probable].
Given the BLS evidence of continuing job growth and diversification, a moderate oversupply in the short run can still be absorbed over a multiyear horizon, but investors entering the market today should focus due diligence on the immediate submarket around any target property, mapping building permits and site plans within a practical radius, rather than assuming that the metro level story alone is sufficient [Source 1, data as of June 2026, extracted August 7 2026, and Source 11 and Source 12 for planning references, confidence probable for interpretation].
Developers should be particularly cautious about starting new projects in submarkets where a high share of pipeline units are scheduled to deliver in the same one to two year window, while buyers of existing stabilized assets may find opportunities where the market has temporarily discounted properties due to near term supply but where long run drivers remain strong.
Section 09Single Family Homes
The single family home and single family rental markets in Raleigh and Wake County are influenced by many of the same macro forces that support multifamily demand, namely population growth, job creation, and relative affordability compared with higher cost coastal metros, but precise figures for median home prices, for sale inventory, and days on market at the city level could not be drawn from Redfin or Zillow within this environment because the requests either returned national data or were blocked [Source 4, Redfin United States Housing Market overview, data through May 2026, confidence confirmed, Source 14, Zillow Raleigh pages blocked, retrieval attempt August 8 2026, confidence confirmed for access limitation].
Nationally, Redfin reports a median sale price of $398,771 and a +2.0% year over year home price increase for the United States as a whole in May 2026, along with modestly rising inventory, which frames a context of constrained but gradually normalizing resale conditions; while this does not provide Raleigh specific numbers, it supports the notion that buyers in many markets still face affordability challenges that can spill over into demand for single family rentals [Source 4, Redfin United States Housing Market overview, data through May 2026, confidence confirmed].
Industry commentary through 2024 often classified Raleigh as a relatively affordable technology and professional services hub compared with major coastal cities, with inbound buyers from higher priced states able to bid up local home values while still perceiving local prices as attractive, which in turn pushed some households that would previously have owned into the rental market or into build to rent single family communities [Source 5, general background from pre 2024 housing market commentary, confidence probable].
For investors who focus on single family rentals, this implies that well located homes in good school zones and near employment centers are likely to remain in demand from tenants who value neighborhood stability and space but who may not yet be ready or able to purchase, while build to rent communities can capture households that prefer a more institutional management experience and consistent amenities; however, since this report does not restate any actual rent or price levels, those investors must rely on current MLS data, brokerage reports, and proprietary analytics for their detailed financial modeling.
Section 10Commercial Real Estate and Retail Centers
Commercial real estate in Raleigh spans office, industrial and logistics, and retail centers, including grocery anchored neighborhood centers, but the key quantitative metrics for these asset classes such as vacancy, rent per square foot, absorption, and effective cap rates are primarily tracked in proprietary datasets and brokerage reports that are not directly accessible in this environment, so this section focuses on structural considerations and their relationship to the labor market rather than specific numerical values [Source 7, CoStar Group, Source 8, Yardi Matrix, Source 9, brokerage sector reports, roles as of 2024, confidence confirmed for role].
Office demand in Raleigh is influenced by the strong presence of professional and business services and information sector employment, although the BLS data also show that the information sector experienced negative twelve month employment growth of 5.2% as of June 2026, which suggests that, as in many markets, technology and media related tenants may be rationalizing space or shifting office use patterns even as overall employment in white collar sectors continues to expand [Source 1, data as of June 2026, extracted August 7 2026, confidence confirmed].
Industrial and logistics space demand is tied to trade, transportation, and utilities employment which grew modestly by +0.1% over twelve months in June 2026, and to regional distribution patterns across the Southeast, which have favored inland hubs with good highway access and proximity to growing consumer populations; in Raleigh this has translated into continued investor interest in well located distribution centers and light industrial assets, though again this report does not restate specific vacancy or rent figures [Source 1, data as of June 2026, extracted August 7 2026, and Source 9, brokerage commentary on industrial trends to 2024, confidence probable].
Retail, especially grocery anchored neighborhood centers, benefits from population growth and from residential density in both single family and multifamily neighborhoods, and such centers often prove resilient even in downturns as they are anchored by daily needs tenants; in Raleigh, continued household formation and student populations in and near the city support traffic for these centers, though e commerce and changing shopping patterns require careful tenant mix management [Source 5, general retail commentary through 2024, confidence probable].
Cap rates for office, industrial, and retail assets in Raleigh cannot be quoted numerically here, but based on national patterns and on prior industry surveys up to 2024, they have historically been somewhat higher than those in the largest coastal gateway markets, offering a yield premium that investors must weigh against local leasing risk and the cost of capital [Source 9, national brokerage cap rate surveys to 2024, confidence probable].
Section 11Transactions and Capital Markets
Transaction volumes, pricing per unit, and capitalization rates for multifamily and other asset classes in Raleigh are primarily tracked by CoStar, Real Capital Analytics, and brokerage research, all of which sit behind paywalls or require interactive querying, so this report does not provide specific dollar transaction volumes or average cap rates for recent years [Source 7, CoStar, Source 15, Real Capital Analytics and similar capital markets databases, Source 9, brokerage transaction reports, roles and access constraints to 2024, confidence confirmed for role].
Anecdotally and through earlier public commentary, Raleigh has been regarded as a favored destination for institutional and private capital seeking growth market exposure in the Southeast, particularly in multifamily and industrial assets, with compression of cap rates in the prior low interest rate environment and some repricing as interest rates rose and debt costs increased nationally; however, those shifts are not expressed as numerical figures here in keeping with the rule against estimates [Source 5, general investment market commentary to 2024, confidence probable].
The combination of strong job growth as evidenced by BLS data and a perception of Raleigh as a business friendly and innovation oriented metro continues to attract national and international investors, but the capital markets environment in 2025 and 2026 has been characterized by higher borrowing costs and more conservative underwriting so that even in growth markets buyers often demand more conservative leverage and higher going in yields than during the prior decade [Source 1, data as of June 2026, extracted August 7 2026, and Source 16, Federal Reserve interest rate context to mid 2026 based on public releases, confidence probable for capital markets interpretation].
For investors evaluating opportunities now, this means that while Raleigh may still command relatively strong pricing compared with many secondary markets, it is also a place where disciplined underwriting, conservative rent growth assumptions, and careful attention to basis are rewarded, especially in the face of elevated new supply in segments of the multifamily market.
Section 12Taxes
Property taxation in Raleigh is administered at the county level by the Wake County Department of Tax Administration, which appraises real estate and personal property within the county and is responsible for generating and collecting property tax bills and certain gross receipts taxes, as described on the county’s official Tax Administration page, but the specific combined city and county millage rates and effective tax rates were not stated in the retrieved content and therefore are not repeated here [Source 17, Wake County Department of Tax Administration overview page, data current as of 2026 site publication, confidence confirmed].
In North Carolina, property taxes are an important consideration for real estate investors because they affect net operating income and capitalization rates, and local practice often involves periodic reappraisal cycles that can reset assessed values; investors in Raleigh should examine the Wake County assessor’s parcel level data and tax rate schedules for the city and for any overlay districts in order to understand current and projected tax burdens on specific properties rather than relying on generalized effective rates [Source 17, Wake County tax administration, and Source 18, North Carolina Department of Revenue property tax guidance, data through 2025, confidence probable].
North Carolina does not levy a separate state level property tax on real estate, so the primary recurring burden is from local government units including counties, municipalities, and certain special districts, and this structure tends to be regarded as reasonably competitive for investment compared with high tax states, though effective rates can still vary materially by jurisdiction and property type [Source 18, North Carolina Department of Revenue property tax overview, data through 2025, confidence probable].
Because this review does not have direct numeric tax rate schedules, it does not present any dollar or percentage figures for property tax, and investors must obtain that information directly from the Wake County and City of Raleigh tax portals or from closing statements on comparable transactions.
Section 13Insurance
Insurance costs for real estate in Raleigh are driven by building replacement cost, local construction pricing, and the risk profile for hazards such as wind, hail, severe thunderstorms, and the inland effects of tropical systems, as well as by national insurance market conditions; metro level average premiums are not available in the allowed public sources used here, so no specific dollar amounts are quoted [Source 19, general property insurance market reports to 2024, confidence probable].
Raleigh’s inland location relative to the Atlantic coast means that it generally faces lower direct hurricane wind and storm surge risk than coastal communities, but it can still experience heavy rainfall, flooding, and wind from the remnants of tropical storms and hurricanes that move inland across North Carolina, which in turn can influence property insurance pricing and the need for careful assessment of site level drainage and flood exposure [Source 2, NOAA climate and hazard commentary through August 2024, confidence probable for Raleigh implication].
The National Oceanic and Atmospheric Administration reports that from 1980 to August 2024 the United States experienced 396 weather and climate disasters with damages of at least one billion dollars each and a combined cost of more than 2.780 trillion dollars, underscoring the rising cost of climate related events nationally and the pressure this places on insurance markets even for inland metros that are not on the immediate coast [Source 2, NOAA climate statistics through August 2024, confidence confirmed].
For investors, this means that insurance expense line items should be treated as dynamic rather than static, with forward looking stress tests that account for potential increases in premiums and for changes in carrier appetite, especially for older properties or those with construction types that fare poorly under severe weather.
Section 14Landlord Tenant and Regulatory Environment
North Carolina’s landlord tenant law framework is generally considered more favorable to landlords than that of certain coastal states, with relatively clear procedures for lease enforcement and eviction, although this report does not summarize specific statutory provisions or time lines because those details are best obtained directly from state and local legal sources and must be interpreted by counsel [Source 20, North Carolina General Statutes and state landlord tenant law summaries as of 2024, confidence probable].
As of the last widely reported updates prior to 2024, North Carolina did not have statewide rent control and did not empower local governments to impose rent control ordinances in the way that some other states do, which has been one factor making Raleigh attractive to investors seeking regulatory predictability for market based rent setting, though investors should always confirm that no new legislation has altered this position [Source 20, North Carolina statutory framework, data through 2024, confidence probable].
Local codes and zoning regulations in Raleigh govern land use, density, parking, and other development standards, and these can significantly affect both new construction projects and the repositioning of existing assets; while specific zoning districts and overlay requirements are not detailed here, investors should review the City of Raleigh zoning map and unified development ordinance when evaluating any property for acquisition or redevelopment [Source 11, City of Raleigh planning and zoning materials as of 2024, confidence probable].
Overall, the regulatory environment in Raleigh and North Carolina appears to balance tenant protections with landlord rights without the more aggressive rent regulation seen in some other states, which investors often view as a supportive feature of the investment climate.
Section 15Infrastructure
Raleigh benefits from a network of transportation and infrastructure assets that support both residential and commercial real estate, including interstate highway connections, an airport serving the wider region, and growing local transit options, but this report does not restate specific infrastructure usage statistics such as traffic counts, passenger volumes, or transit ridership because those figures would need to be drawn from transportation agencies that were not queried in detail here [Source 21, North Carolina Department of Transportation materials to 2024, and Source 22, regional airport authority reports to 2024, confidence probable].
From a land use perspective, the availability of road capacity and highway access has supported suburban expansion and the development of office and industrial parks in the Raleigh Cary metro, while transit investments and streetscape improvements have encouraged higher density mixed use projects in select corridors and nodes, which in turn shape where multifamily and commercial projects are most viable [Source 11, City of Raleigh planning and transportation planning documents as of 2024, confidence probable].
Investors should pay attention to planned infrastructure projects such as highway improvements, new transit lines, or utility upgrades that can change travel times and accessibility for specific submarkets over the next decade, and should review capital improvement plans and transportation planning documents for indications of where public investment will concentrate, as those decisions often support appreciation and higher development intensity over time.
Section 16Climate and Physical Risks
Raleigh’s climate risks are shaped by its inland position in North Carolina, which reduces exposure to direct storm surge but leaves the region susceptible to heavy rainfall, flash flooding, river flooding, severe thunderstorms, hail, and occasional wind impacts from tropical systems that move inland after landfall on the Atlantic coast [Source 2, NOAA climate and hazard commentary through August 2024, confidence probable].
The national context from NOAA, which records 396 billion dollar weather and climate disasters across the United States between 1980 and August 2024 with total damages exceeding 2.780 trillion dollars, suggests that climate related risks are a growing consideration for investors in all regions and that inland metros like Raleigh cannot assume immunity, especially as rainfall intensity and storm patterns evolve [Source 2, NOAA climate statistics through August 2024, confidence confirmed].
Specific site level flood risk in Raleigh is determined by local topography, drainage infrastructure, and proximity to streams and floodplains as mapped by the Federal Emergency Management Agency, but parcel level flood map designations are not reproduced here since those require direct use of FEMA map tools and careful reading of flood insurance rate maps for each location [Source 23, FEMA Flood Map Service Center and flood insurance rate maps, data as of latest map updates for Wake County, retrieval attempt August 8 2026, confidence confirmed for role].
For investment decision making, this means that due diligence in Raleigh should always include a review of FEMA flood designations, verification of any flood history on the site, assessment of local drainage and stormwater systems, and modeling of insurance costs, rather than relying solely on the fact that the metro is inland and not directly on the coast.
Section 17Neighborhoods and Submarkets
Raleigh’s internal geography consists of an urban core with surrounding neighborhoods and suburban areas throughout the Raleigh Cary metro, but this report does not attempt to name or characterize specific neighborhoods or to assign quantitative metrics to them because that level of detail requires access to granular data from city planning departments, tax records, and proprietary mapping platforms that were not accessed here [Source 11, City of Raleigh neighborhood and planning resources as of 2024, and Source 12, Wake County GIS and tax parcel resources as of 2024, confidence probable].
At a high level, submarkets near major employment centers, universities, and transit corridors have tended to see more intense multifamily development and higher rent levels, while more distant suburban areas with good school districts have remained attractive for both owner occupied homes and single family rentals, with pricing and rent levels that vary according to school quality, commute times, and neighborhood amenities [Source 5, general submarket commentary through 2024, confidence probable].
Industrial and logistics assets are more heavily concentrated near highway interchanges and in business parks designed for truck access, while retail nodes cluster around major intersections and within mixed use developments, a pattern that investors should map carefully when evaluating location specific risk and opportunity, even though this report does not supply explicit metrics such as rent per square foot by corridor.
For practical underwriting, investors should obtain submarket definitions and metrics from CoStar, Yardi, or brokerage research and then overlay those with local planning maps, demographic profiles from ACS, and physical observations from site visits to build a more detailed neighborhood level thesis.
Section 18Opportunities
The main opportunity in Raleigh for real estate investors is to participate in a metro that combines sustained job growth, a diversified employment base, and a relatively business friendly regulatory and tax environment, all of which are important ingredients for long term rental and occupancy stability [Source 1, data as of June 2026, extracted August 7 2026, and Source 18 and Source 20 on taxation and regulation, confidence probable].
On the multifamily side, assets that serve knowledge sector and healthcare workers in job rich submarkets are likely to benefit from continued demand, particularly where supply is constrained by zoning or land availability, while value add strategies that upgrade older stock to meet current tenant expectations can seek rent premiums without relying on speculative ground up risk; however, the absence of precise rent and vacancy data in this report means that investors must ground these ideas in current numbers from proprietary sources, and outcomes are not assured [Source 1 and Source 7 and Source 8, roles and trends, confidence probable].
In the single family and single family rental space, Raleigh’s position as a relatively affordable alternative to coastal tech hubs and as a destination for migrants from higher cost states creates opportunities in neighborhoods that balance school quality, commute times, and quality of life, with particular potential in build to rent communities that can offer institutional quality management in suburban locations [Source 5, housing market commentary to 2024, confidence probable].
Commercial real estate opportunities may be strongest in well located industrial and logistics assets that serve regional distribution needs and in necessity retail centers that benefit from continued household formation, while office investments require greater selectivity given evolving work patterns and the negative employment trend in the information sector even as professional and business services employment continues to rise [Source 1 and Source 9, sector employment and commercial commentary to 2024, confidence probable].
Overall, Raleigh offers investors a chance to align with demographic and economic trends in a metro that has already attracted significant institutional attention but that still presents localized inefficiencies and potential value creation opportunities at the asset and submarket level; no particular outcome is assured.
Section 19Risks
The most immediate risk in Raleigh’s real estate markets is the possibility that elevated levels of new multifamily supply in certain submarkets could outpace near term demand, leading to higher vacancy, extended lease up periods, more aggressive concessions, and downward pressure on effective rents, particularly for the newest properties competing directly with one another [Source 5, multifamily supply commentary to 2024, confidence probable].
A second risk lies in the broader capital markets environment, where higher interest rates and tighter credit standards can compress levered returns even in growth markets, and where refinancing risk becomes more acute for properties with near term debt maturities or with optimistic rent growth assumptions made during the prior low rate period [Source 16, Federal Reserve interest rate context to mid 2026, confidence probable].
Regulatory and tax risks in Raleigh and North Carolina are currently more muted than in some other states due to the lack of rent control and the structure of property taxation, but investors must still monitor potential legislative changes at both the state and local level that could affect eviction processes, development approvals, or tax assessments, especially in response to affordability concerns or budget pressures [Source 18 and Source 20, North Carolina tax and landlord tenant frameworks to 2024, confidence probable].
Climate and physical risk remains an important long term consideration, as Raleigh is not immune to heavy rainfall, flooding, and wind from tropical systems, and as national climate loss experience has shown a rising frequency and cost of extreme weather events, which can impact both property level damage and insurer appetite; failure to underwrite these risks carefully can result in unexpected capital expenditures and insurance cost volatility [Source 2 and Source 23, NOAA and FEMA references through August 2024, confidence probable].
Finally, competition from other high growth metros in the Southeast for both employers and capital means that Raleigh must continue to invest in infrastructure, education, and quality of life to maintain its relative advantage, and investors should recognize that regional competition can influence long term demand and pricing power.
Section 20Investor Implications
For United States accredited investors evaluating Raleigh, the key implication of this analysis is that the metro combines strong underlying economic fundamentals, as illustrated by continued job growth and low unemployment in the BLS data, with a set of practical constraints and risks around supply, capital costs, and climate that require disciplined underwriting rather than blind enthusiasm for growth narratives [Source 1, data as of June 2026, extracted August 7 2026, confidence confirmed].
In multifamily, investors should focus on assets and sites that serve durable employment centers and that are positioned either as high quality but financially attainable housing for working households or as value add opportunities where physical and operational improvements can close the gap to market expectations, always anchored in current rent, vacancy, and expense data obtained from proprietary platforms and local expertise [Source 7, Source 8, Source 9, roles as data providers and brokerage channels, confidence probable].
In single family and single family rental, the implication is that Raleigh remains an appealing market for strategies that bridge the gap between households priced out of ownership and the desire for neighborhood stability, but that future appreciation assumptions must take into account the broader national context of moderating price growth and higher borrowing costs, rather than extrapolating the more rapid gains of earlier years [Source 4, national housing market data to May 2026, and Source 5, Raleigh commentary to 2024, confidence probable].
For commercial assets, the investor takeaway is that industrial and necessity retail likely offer the most straightforward risk reward profiles in Raleigh today, while office investments require a view on long term space use and tenant credit within a sector that faces structural change despite healthy overall employment growth in white collar industries, and that cap rate and rent assumptions must be stress tested under a range of scenarios [Source 1 and Source 9, employment and sector commentary to 2024, confidence probable].
Across all asset classes, investors should pair the directional insights in this report with quantitative data from the cited public and proprietary sources, on the understanding that this document intentionally avoids any invented or estimated figures and is meant to frame questions and themes rather than provide an exhaustive dataset. These are general educational observations, not recommendations, and no particular outcome is assured.
Section 21Conclusion
Raleigh stands out within the United States as a metro with a strong and growing employment base, particularly in professional and business services, education and health services, and financial activities, as documented by the Bureau of Labor Statistics data that show rising total nonfarm employment and low unemployment through the first half of 2026 [Source 1, data as of June 2026, extracted August 7 2026, confidence confirmed].
The city and the broader Raleigh Cary metro have benefited from population inflows, a reputation as part of a research oriented region, and a regulatory and tax environment that many investors view as predictable and relatively landlord friendly compared with more heavily regulated coastal markets, although precise population and income figures could not be reproduced here due to access constraints to Census and BEA tables [Source 3, Source 6, Source 18, Source 20, roles and context to 2023 through 2025, retrieval attempt August 8 2026, confidence probable].
At the same time, Raleigh faces challenges common to many growth markets, including the risk of near term oversupply in multifamily submarkets, capital markets headwinds from higher interest rates, and long term climate risks that, while less severe than those on the immediate coast, still warrant careful underwriting and resilience planning [Source 2, Source 5, Source 7, Source 8, Source 9, roles and commentary to 2024, confidence probable].
For accredited investors, the most prudent stance is to regard Raleigh as a market with solid long term fundamentals and real but manageable risks, where success depends on disciplined submarket selection, detailed asset level analysis, conservative assumptions on rents and expenses, and a clear understanding of both local regulatory structures and broader macroeconomic forces.