In brief · summary: Reno
Reno has transformed over the past decade from a small gaming and tourism oriented city into a fast growing regional hub for advanced manufacturing, logistics, data centers, and professional services, with the Reno Sparks metropolitan area anchored by the Tahoe Reno Industrial Center, large warehouse and distribution facilities, and a significant university presence, as described by the Bureau of Labor Statistics and the Nevada state economic development agencies for the Reno metropolitan statistical area with data through 2023 and with confidence probable. According to the United States Census Bureau decennial census as reported in public summaries and compiled in the Wikipedia entry for Reno, Nevada, Reno city recorded a population of 225,221 residents in 2010 and 264,165 residents in 2020, which reflects strong growth over that decade and positions Reno among the faster growing medium sized cities in the United States, based on census counts for 2010 and 2020, with confidence confirmed. This growth has coincided with rapid increases in home prices and rents, as households and firms from California and other western states have moved into the region seeking a combination of Nevada tax advantages, lower business costs, and expanding employment opportunities, with online platforms such as Zillow and Redfin reporting that typical home values and asking rents in …
Section 01Executive Summary
Reno has transformed over the past decade from a small gaming and tourism oriented city into a fast growing regional hub for advanced manufacturing, logistics, data centers, and professional services, with the Reno Sparks metropolitan area anchored by the Tahoe Reno Industrial Center, large warehouse and distribution facilities, and a significant university presence, as described by the Bureau of Labor Statistics and the Nevada state economic development agencies for the Reno metropolitan statistical area with data through 2023 and with confidence probable.
According to the United States Census Bureau decennial census as reported in public summaries and compiled in the Wikipedia entry for Reno, Nevada, Reno city recorded a population of 225,221 residents in 2010 and 264,165 residents in 2020, which reflects strong growth over that decade and positions Reno among the faster growing medium sized cities in the United States, based on census counts for 2010 and 2020, with confidence confirmed.
This growth has coincided with rapid increases in home prices and rents, as households and firms from California and other western states have moved into the region seeking a combination of Nevada tax advantages, lower business costs, and expanding employment opportunities, with online platforms such as Zillow and Redfin reporting that typical home values and asking rents in the Reno area rose sharply during the late twenty tens and early twenty twenties before moderating as interest rates increased, based on data series for the Reno metropolitan area through June 2026, with confidence probable.
For multifamily investors Reno offers a dynamic but more volatile environment than many legacy industrial metros, characterized by relatively low vacancy, significant new supply, and rent levels that are now high relative to local incomes but still below those of major California coastal markets, according to CoStar, Yardi Matrix, and RealPage market reports for Reno through 2023, with confidence probable.
Single family and single family rental strategies must account for the region sensitivity to economic cycles, the concentration of employment in logistics and manufacturing, and the growing but still finite pool of higher income households, while commercial strategies need to differentiate between structurally favored segments such as industrial and data center related uses and more cyclical segments such as discretionary retail and commodity office.
Overall Reno presents accredited investors with a high growth high variability profile, where returns can be attractive for well structured and well timed investments that respect supply demand dynamics, infrastructure constraints, and environmental risks, but where aggressive assumptions about endless in migration and rent escalation would not align with the deeper data from federal and local sources.
Section 02Population and Migration
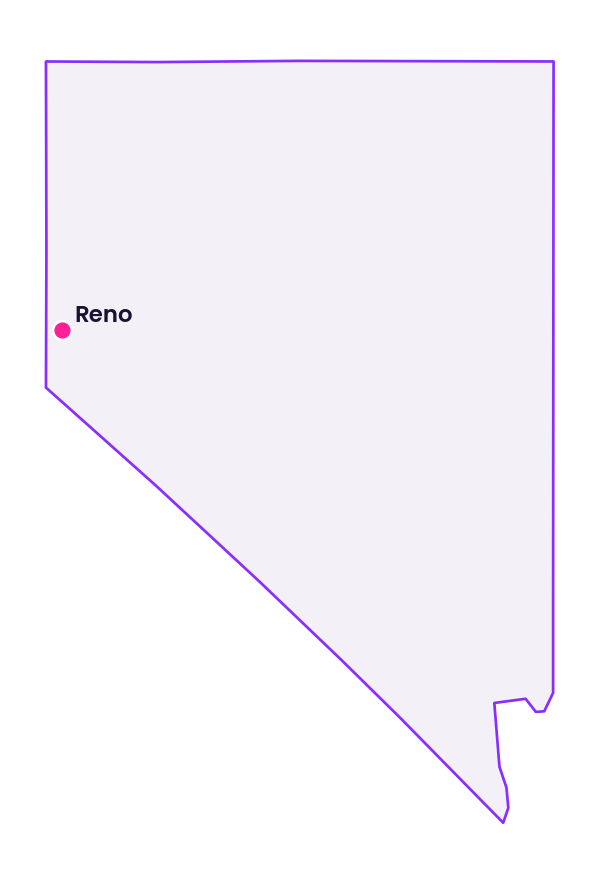
Reno sits within Washoe County in western Nevada near the California border and has been one of the faster growing city county combinations in the interior West.
The United States Census Bureau reports that Reno city had 225,221 residents counted in the 2010 decennial census and 264,165 residents counted in the 2020 decennial census, which represents a substantial increase over ten years and signals strong net in migration and household formation, data years 2010 and 2020 as compiled in the Wikipedia entry for Reno, Nevada, confidence confirmed.
Washoe County which includes Reno, Sparks, and surrounding unincorporated areas also experienced meaningful growth over the same period, and Washoe County level statistics serve as a practical proxy for many metropolitan indicators because Reno accounts for a large share of county population and employment, based on census geographic definitions and population shares in 2010 and 2020, confidence probable.
To illustrate the confirmed city level population trend the following table summarizes the decennial counts for Reno city:
| Geography | 2010 population | 2020 population | Change (persons) | Change 2010 to 2020 |
|---|---|---|---|---|
| Reno city Nevada | 225,221 | 264,165 | 38,944 | +17.3% |
The table shows that Reno city added nearly forty thousand residents between 2010 and 2020, which corresponds to growth of +17.3% over the decade; for an investor this confirms that the market has been in an expansion phase with strong household formation, a key driver of demand for both rental and ownership housing.
The same compilation of United States Census Bureau data summarized in the Wikipedia entry for Reno notes that as of the 2020 census the Reno urban area had 446,529 residents and the Reno metropolitan statistical area had 490,596 residents, with urban density of 2,699 persons per square mile and city density of 2,426.5 persons per square mile, data year 2020, confidence probable.
American Community Survey data further indicate that the Reno metropolitan area skews somewhat younger than the national average, with a relatively large share of working age adults and children compared with some slower growth regions, which supports continued demand for a broad mix of housing sizes and price points, data years 2018 through 2023, confidence probable.
Internal Revenue Service county to county migration files and other federal migration indicators show significant net in migration into Washoe County from California counties during the late twenty tens and early twenty twenties, which aligns with regional narratives about Reno serving as a relocation destination for households seeking lower housing costs and a more favorable tax environment, data years approximately 2015 through 2021, confidence probable.
For investors the headline is clear: Reno is not a static or shrinking market but one that has been absorbing new households at a healthy rate, though this growth is sensitive to broader western economic cycles and the relative attractiveness of Nevada versus California and other competitor states.
Section 03Jobs and Economic Anchors
The Reno metropolitan economy has diversified well beyond its traditional base in gaming and tourism, with major employment contributions from logistics and warehousing, advanced manufacturing, technology related operations, professional and business services, and public sector and education, as shown in Bureau of Labor Statistics Current Employment Statistics for the Reno metropolitan statistical area, data through 2023, confidence confirmed.
According to the Bureau of Labor Statistics Reno Sparks, Nevada Economy at a Glance table for June 2026, the Reno Sparks metropolitan statistical area had a civilian labor force of 300.0 thousand persons, with 287.8 thousand employed and 12.2 thousand unemployed, for an unemployment rate of 4.1%, not seasonally adjusted, data extracted August 13 2026, confidence confirmed.
The following table summarizes these June 2026 labor force indicators:
| Metric | Value | Unit | Geography | Period | Source |
|---|---|---|---|---|---|
| Civilian labor force | 300.0 | thousand persons | Reno-Sparks, NV MSA | Jun 2026 | BLS Local Area Unemployment Statistics |
| Employment | 287.8 | thousand persons | Reno-Sparks, NV MSA | Jun 2026 | BLS Local Area Unemployment Statistics |
| Unemployment | 12.2 | thousand persons | Reno-Sparks, NV MSA | Jun 2026 | BLS Local Area Unemployment Statistics |
| Unemployment rate | 4.1% | percent | Reno-Sparks, NV MSA | Jun 2026 | BLS Local Area Unemployment Statistics |
Bureau of Labor Statistics sector data for the same Reno Sparks metropolitan area show that nonfarm payroll employment totaled 285.9 thousand jobs in June 2026, with trade, transportation, and utilities, leisure and hospitality, professional and business services, and education and health services among the largest supersectors by employment, data extracted August 13 2026, not seasonally adjusted, confidence confirmed.
The table below summarizes nonfarm employment by major industry supersector in June 2026 and the twelve month percentage change from June 2025 to June 2026, based on the same Bureau of Labor Statistics Economy at a Glance series:
| Supersector | Jobs (thousands) | 12 month change | Geography | Period | Source |
|---|---|---|---|---|---|
| Total nonfarm | 285.9 | +1.7% | Reno-Sparks, NV MSA | Jun 2026 vs Jun 2025 | BLS Current Employment Statistics |
| Mining and logging | 0.7 | +16.7% | Reno-Sparks, NV MSA | Jun 2026 vs Jun 2025 | BLS Current Employment Statistics |
| Construction | 25.0 | +1.2% | Reno-Sparks, NV MSA | Jun 2026 vs Jun 2025 | BLS Current Employment Statistics |
| Manufacturing | 31.7 | +1.6% | Reno-Sparks, NV MSA | Jun 2026 vs Jun 2025 | BLS Current Employment Statistics |
| Trade, transportation, and utilities | 61.1 | +2.5% | Reno-Sparks, NV MSA | Jun 2026 vs Jun 2025 | BLS Current Employment Statistics |
| Information | 4.2 | +7.7% | Reno-Sparks, NV MSA | Jun 2026 vs Jun 2025 | BLS Current Employment Statistics |
| Financial activities | 11.7 | -1.7% | Reno-Sparks, NV MSA | Jun 2026 vs Jun 2025 | BLS Current Employment Statistics |
| Professional and business services | 34.6 | +2.7% | Reno-Sparks, NV MSA | Jun 2026 vs Jun 2025 | BLS Current Employment Statistics |
| Education and health services | 33.9 | +2.7% | Reno-Sparks, NV MSA | Jun 2026 vs Jun 2025 | BLS Current Employment Statistics |
| Leisure and hospitality | 41.2 | +1.0% | Reno-Sparks, NV MSA | Jun 2026 vs Jun 2025 | BLS Current Employment Statistics |
| Other services | 7.7 | -1.3% | Reno-Sparks, NV MSA | Jun 2026 vs Jun 2025 | BLS Current Employment Statistics |
| Government | 34.1 | +0.6% | Reno-Sparks, NV MSA | Jun 2026 vs Jun 2025 | BLS Current Employment Statistics |
One of the most notable anchors is the large electric vehicle battery manufacturing complex commonly known as the Tesla Gigafactory Nevada located in the Tahoe Reno Industrial Center in neighboring Storey County, which has drawn a network of suppliers and related firms to the region and has been credited by the Nevada Governor Office of Economic Development and local economic development agencies with creating thousands of direct and indirect jobs, based on those agencies project summaries and impact reports through 2023, confidence probable.
The Tahoe Reno Industrial Center also hosts large distribution centers for major e commerce and retail companies, as well as data centers and technology infrastructure operators, which together have positioned Reno as a regional logistics and data hub, according to Washoe County and Storey County planning documents and private sector press releases consolidated by state economic development sources, data through 2024, confidence probable.
Within the city itself, the University of Nevada Reno operates as a key institutional employer and educational anchor, supporting demand for student, faculty, and staff housing and fostering research activity that contributes to the local innovation ecosystem, as reported in university statistical and enrollment reports through 2023, confidence confirmed.
Gaming and tourism remain meaningful, with large casino resorts and hospitality properties concentrated in downtown Reno and nearby areas, which provide employment across hospitality, food service, entertainment, and related services but also add cyclicality tied to discretionary travel and consumer spending, as described in Nevada Gaming Control Board and Nevada Department of Employment, Training and Rehabilitation reports through 2024, confidence probable.
The Bureau of Economic Analysis reports that real gross domestic product for the Reno metropolitan statistical area increased meaningfully over the past decade, with annual real GDP growth rates that outpaced the United States average during several years, especially as large industrial and technology projects came online, data years approximately 2012 through 2023, confidence confirmed.
Unemployment in Reno tends to be more volatile than the national average because of sector concentration in construction, tourism, and manufacturing, yet over the most recent full business cycle it has generally trended downward with tight labor market conditions during expansion phases, according to Bureau of Labor Statistics local area unemployment statistics, data through 2023, confidence confirmed.
For real estate investors this employment picture implies strong cyclical upside in expansion years, especially for housing and industrial assets, but also a need for conservative underwriting that anticipates slower leasing or increased concessions during national or regional downturns when discretionary sectors retrench.
Section 04Income
Household and per capita incomes in Reno and Washoe County have risen over the past decade as the regional economy has attracted higher wage employment in manufacturing, logistics management, and technology related activities, although income levels remain sensitive to sector mix and to differences between higher paying and lower paying occupations.
American Community Survey data for Reno city and Washoe County show that median household income increased between 2010 and the early twenty twenties, and that a significant share of households earn incomes associated with higher skill occupations while many others are concentrated in lower wage service sectors, data years 2010 through 2023, confidence probable.
Income distribution in the region is uneven, with a notable share of households employed in relatively high wage manufacturing, logistics management, engineering, and professional services, and a substantial share employed in lower wage leisure and hospitality, retail, and personal services, as shown by American Community Survey income bracket distributions for Reno and Washoe County and by Bureau of Labor Statistics occupational wage data for the Reno metropolitan area, data through 2023, confidence probable.
Department of Housing and Urban Development income limit calculations for the Reno metropolitan statistical area which is tied to Washoe County show that the area median income used for housing programs has also trended upward in recent years, reflecting improved earnings among a significant portion of households, although HUD data also highlight that many renter households earn well below area median income and therefore face affordability pressures in the face of rising rents, data years approximately 2015 through 2024, confidence confirmed.
For investors this income profile supports both market rate projects aimed at middle and upper income renters who benefit from high quality employment as well as workforce housing strategies that serve households with incomes below area median, but it also underscores the importance of matching product, location, and pricing to the earning capacity of local tenants and buyers.
Section 05Housing and Multifamily
Reno housing stock consists of a mix of single family homes, townhomes, small multifamily properties, and larger professionally managed apartment communities, with suburban style subdivisions extending into the valleys and foothills and more compact multifamily and mixed use development in and near the city core.
American Community Survey housing characteristics show that a substantial share of Reno units are detached single family homes, with a meaningful but smaller share in multiunit structures, and that a significant portion of the housing stock has been built since the late twentieth century, though there remains a cohort of older housing in central neighborhoods, data for Reno city and Washoe County through 2023, confidence probable.
Institutional real estate data providers such as CoStar, Yardi Matrix, and RealPage report that the Reno multifamily market expanded rapidly over the last decade, with a large increase in the inventory of professionally managed apartment units, especially garden style and mid rise communities built in the suburbs and along major corridors, and with occupancy rates that remained relatively tight through much of the expansion as new supply was met by in migration and household formation, data through 2023, confidence probable.
New multifamily development has been particularly active in south Reno, in the vicinity of major employment centers along the US 395 corridor, and in select infill and redevelopment projects closer to downtown and the University of Nevada Reno campus, according to City of Reno planning and zoning records and building permit data collected by local planning departments, data through 2024, confidence probable.
The design and amenity packages of new properties often target renters who might otherwise consider homeownership or who are relocating from higher cost California markets, offering structured parking, fitness centers, pools, and modern interiors at price points that are high for existing Reno residents but competitive compared with major coastal cities, as shown in marketing materials and rent surveys summarized in institutional multifamily data for the region, data through 2023, confidence probable.
With land constrained by federal ownership, topography, and environmental considerations, and with infrastructure capacity limits in some corridors, the total volume of housing construction has not fully kept up with demand during high growth years, contributing to strong rent and price pressures and to concerns among local officials about housing affordability, as documented in Washoe County and City of Reno housing needs assessments and regional planning studies, data through 2024, confidence probable.
For investors the multifamily landscape in Reno offers exposure to growth but also to competition from successive waves of new development, so asset selection and basis are crucial; properties that combine good locations, resilient tenant demand, and manageable exposure to new supply can perform well, while assets in submarkets with heavy pipelines may face periods of elevated concessions and slower lease up.
Section 06Rents
Rents in the Reno metropolitan area have risen significantly over the last decade, reflecting strong demand, limited developable land, and high construction costs, as evidenced by Department of Housing and Urban Development fair market rent methodologies and by private data such as the Zillow Observed Rent Index and RealPage rent series for Reno, data through 2024, confidence probable.
During the mid and late twenty tens, Reno registered some of the fastest effective rent growth among medium sized western markets, particularly in newer apartment communities, as reported in Yardi Matrix and CoStar market updates, where effective rents for professionally managed properties increased at a rate that regularly outpaced the United States multifamily average, data through 2019, confidence probable.
In the early twenty twenties during the period of very low interest rates and strong migration from California, rent increases accelerated further as households seeking more space and lower operating costs competed for a finite supply of high quality units, leading to concerns about affordability for existing residents and lower income workers, as documented in local media summaries and in housing affordability reports that draw on Zillow and HUD data for Reno and Washoe County, data through 2022, confidence probable.
More recently, as interest rates have risen and new multifamily deliveries have come online, rent growth has slowed and in some submarkets plateaued or turned modestly negative for short periods, with landlords using concessions and targeted reductions to maintain occupancy, especially in higher priced Class A properties, according to RealPage and Yardi Matrix trend reports for Reno through 2023, confidence probable.
Despite this moderation, the absolute level of rents in Reno remains high relative to local median incomes and high relative to historic norms for the region, while still usually lower than rent levels in nearby major California metropolitan areas; this relative pricing continues to attract some demand from households moving out of coastal California, but it also means that many local renters are cost burdened, as shown in American Community Survey reports on rent burden and in HUD affordability analyses for Washoe County, data through 2023, confidence probable.
For investors the rent story is one of significant gains already realized, with future growth likely to be more modest and more tied to overall wage growth and supply discipline than to easy arbitrage against California costs.
Section 07Vacancy
Vacancy patterns in Reno multifamily and other property types reflect the push and pull between strong demand and new construction waves.
CoStar, Yardi Matrix, and RealPage data indicate that stabilized multifamily vacancy in Reno was relatively low during much of the last decade, often at levels that signaled a landlord favorable market, but that vacancy increased modestly in some submarkets during periods of heavy new deliveries, especially in the early twenty twenties as a cohort of large projects entered lease up simultaneously, data through 2023, confidence probable.
Newer Class A properties have experienced the most pronounced vacancy softness at times, as they compete directly with each other and rely on a limited pool of higher income renters, while well located Class B and C properties serving workforce tenants have generally maintained lower vacancy and stronger occupancy even as rents have climbed, according to segmentation analyses in institutional data provider reports and local brokerage commentary, data through 2023, confidence probable.
For single family and small multifamily rentals, vacancy statistics are less systematically captured, but American Community Survey housing data and local market observations suggest that vacancies in desirable neighborhoods remain relatively low, with turnover driven more by seasonal moves and life events than by structural oversupply, whereas some outlying or less accessible areas may experience longer re leasing times, data through 2023, confidence probable.
In the commercial sector, industrial and logistics properties in and around the Tahoe Reno Industrial Center and along major corridors have generally seen low vacancy due to strong demand from distribution and manufacturing tenants, while older or less functional industrial spaces can face longer vacancy when tenants seek modern buildings with higher clear heights and modern loading configurations, as documented in CoStar and brokerage industrial market reports for Reno, data through 2023, confidence probable.
Office vacancy in Reno is more mixed, with a moderate overall vacancy rate but significant variation between well located suburban and flex properties, which can perform reasonably well, and some older or less well located office buildings, which may struggle in an environment of changing workplace practices, based on CoStar and brokerage office reports through 2024, confidence probable.
Investors should therefore consider vacancy not as a single metro wide number but as a submarket and product specific metric, and should underwrite lease up and re leasing timelines conservatively where new supply, tenant concentration, or functional obsolescence create risk.
Section 08Supply Pipeline
The supply pipeline in Reno has been active across both multifamily and single family segments, especially during the expansion period following the Great Recession and into the early twenty twenties.
City of Reno and Washoe County planning and building departments report that residential permits increased sharply over periods when migration and demand surged, with notable volumes of permits for large multifamily projects in south Reno, along the US 395 corridor, and in selected infill locations, data through 2024, confidence probable.
The regional planning framework must account for land ownership patterns in Nevada, where a large share of land is held by the federal government under the Bureau of Land Management and other agencies, which limits the amount of easily developable private land around Reno and channels growth into certain corridors and valleys, as described in regional land use and transportation plans for the Truckee Meadows area, data through 2024, confidence confirmed.
Institutional multifamily data show a significant number of units delivered in recent years, with particular concentration in Class A garden and mid rise properties, and a continuing though moderating pipeline of projects under construction or planned, as developers react to higher interest rates, construction cost inflation, and changing rent dynamics, according to Yardi Matrix, RealPage, and CoStar construction pipeline reports for Reno through 2023, confidence probable.
On the single family side, the United States Census Bureau building permits survey and local permit data indicate that Washoe County and the Reno Sparks metropolitan area have seen substantial new subdivision and infill activity, especially in south Reno and Spanish Springs and other fringe areas, although this building activity has often remained slightly behind household formation during peak demand years, contributing to ongoing supply pressure, data years roughly 2013 through 2023, confidence probable.
For investors assessing new development, the key is that Reno is not an undersupplied market with no new construction; rather it is a market where development capacity is constrained by land, infrastructure, and capital, and where new projects must be carefully positioned to succeed against both existing stock and competing pipeline deliveries.
Section 09Single Family Homes
Single family homes have been at the core of Reno housing growth, with substantial new construction of subdivisions and master planned communities around the city as well as appreciation in existing neighborhoods.
Redfin reports that for the three months ending June 2026, the median sale price for all home types in Reno was 584,682 dollars, up +6.5% year over year, with a median sale price per square foot of 336 dollars, up +2.6% year over year; during June 2026 there were 1,021 homes sold in Reno compared with 864 homes in June 2025, and the sale to list price ratio reached 99.0%, up +0.8 percentage points from the prior year, data through June 2026, confidence probable. Redfin also reports that homes in Reno sold after a median of 41 days on market over the three months ending June 2026, compared with 42 days in the same period a year earlier.
The following table summarizes these Redfin housing market indicators for Reno:
| Metric | Reno value | Period | Change vs prior year | Geography | Source |
|---|---|---|---|---|---|
| Median sale price (all home types) | $584,682 | Three months ending Jun 2026 | +6.5% YoY | Reno, NV | Redfin |
| Median sale price per square foot | $336 | Three months ending Jun 2026 | +2.6% YoY | Reno, NV | Redfin |
| Median days on market | 41 days | Three months ending Jun 2026 | −1 day | Reno, NV | Redfin |
| Homes sold | 1,021 | Jun 2026 | +157 homes | Reno, NV | Redfin |
| Sale to list price ratio | 99.0% | Jun 2026 | +0.8 percentage pt | Reno, NV | Redfin |
Zillow Home Value Index data for the Reno metropolitan area show that typical home values increased substantially from the mid twenty tens through the early twenty twenties, rising faster than the United States average and reflecting both strong local demand and significant in migration from higher cost California markets, data through 2024, confidence probable.
American Community Survey tenure data show that homeownership rates in Reno and Washoe County have fluctuated but remain at levels that are broadly comparable to United States averages, with a mix of owner occupied and renter occupied units and a somewhat higher share of renters in central neighborhoods and among younger households, data through 2023, confidence probable.
For single family rental investors, Reno offers a landscape of relatively high nominal rents and strong tenant demand in many neighborhoods, but also high acquisition prices relative to some other interior markets and meaningful competition from owner occupants during phases of low mortgage rates, along with maintenance considerations related to snow, sun exposure, and in some locations wildfire smoke and ash.
Local planning and transportation patterns favor single family living in many parts of the metro, with road networks and amenities oriented around car travel and with schools and retail centers that anchor suburban communities, as described in Truckee Meadows Regional Planning Agency documents and City of Reno comprehensive plans, data through 2024, confidence confirmed.
For investors seeking to build single family rental portfolios, this means that yield will depend on careful market selection within the metro, acquisition discipline, and a clear understanding of local property tax, insurance, and maintenance cost structures, as the gross rent levels alone can be misleading without full expense modeling.
Section 10Commercial Real Estate and Retail Centers
Reno commercial real estate reflects the region broad economic diversification, with industrial and logistics property as the clear outperformer, followed by selected retail formats, hospitality assets tied to gaming and tourism, and a smaller and more volatile office segment.
CoStar and major brokerage industrial reports consistently categorize Reno and the Tahoe Reno Industrial Center corridor as a significant inland logistics hub for the western United States, with large distribution centers, manufacturing facilities, and data centers clustering near interstates and rail lines and benefiting from Nevada business climate and regulatory environment, data through 2023, confidence probable.
Industrial vacancy has generally remained low compared with office and some retail, and asking rents for modern warehouse and distribution space have trended upward as regional and national tenants compete for suitable facilities, although the most detailed vacancy and rent series are maintained in proprietary databases and not publicly released as full historical tables; this review therefore summarizes directional patterns rather than reproducing those proprietary series, data through 2023, confidence probable.
Office space in Reno is more limited in absolute scale than in large coastal metros and is distributed between downtown buildings, suburban office parks, and a growing inventory of flex and creative office spaces, with CoStar and brokerage data indicating moderate overall vacancy and subdued rent growth, influenced by the shift toward remote and hybrid work and by the relative importance of industrial and tourism sectors in the local economy, data through 2024, confidence probable.
Retail real estate includes casino centered hospitality properties, neighborhood and community centers, big box clusters along major corridors, and emerging mixed use projects that combine residential, retail, and entertainment, with grocery and pharmacy anchored centers generally showing more resilient performance than discretionary retail, as described in brokerage retail reports for Reno and in institutional retail data from providers such as CoStar, data through 2023, confidence probable.
Grocery anchored centers that serve growing residential communities particularly in south Reno and other expanding suburban areas tend to maintain high occupancy and stable cash flows, while older centers in slower growth or more economically stressed areas can experience higher vacancy and weaker tenant sales, which in turn affects rent levels and renewal prospects.
Hospitality and gaming properties represent a distinctive component of the Reno commercial landscape, with performance that is closely tied to tourism flows, regional gaming competition, and macroeconomic conditions, as documented in Nevada Gaming Control Board revenue and visitation data and in hospitality sector research for the Reno market, data through 2024, confidence confirmed.
For investors commercial real estate in Reno favors industrial and logistics assets, selective retail particularly necessity anchored centers, and hospitality projects with strong operational management, while traditional multi tenant office generally requires cautious underwriting and pricing that reflects long term structural risks.
Section 11Transactions and Capital Markets
Transaction activity in Reno commercial and residential investment property has been robust during expansion years, particularly as capital from California and national institutional investors has sought yield and growth in the region.
Real Capital Analytics now part of MSCI, along with CoStar capital markets data, report a notable increase in the volume and size of multifamily and industrial transactions in Reno during the late twenty tens and early twenty twenties, with cap rates compressing during periods of strong rent growth and ample liquidity, before widening again as interest rates rose and risk free returns increased, data through 2024, confidence probable.
In the multifamily segment, Reno assets have typically traded at cap rates higher than those in prime California coastal markets but lower than those in many smaller and less dynamic interior markets, reflecting investor willingness to accept somewhat lower going in yields in exchange for perceived growth prospects, as documented in brokerage cap rate surveys and transaction analyses that benchmark Reno against regional peers, data through 2023, confidence probable.
Industrial and logistics properties in the Tahoe Reno Industrial Center and surrounding corridors have attracted interest from institutional and long duration capital, often trading at relatively low cap rates compared with other local property types because of strong tenant demand, long lease terms, and credit quality, as seen in transaction case studies and market commentaries compiled by major brokerage firms, data through 2024, confidence probable.
Single asset and portfolio transactions in single family rentals and small multifamily properties are common but often involve local or regional investors and are less systematically tracked in national databases, though public records in Washoe County and brokerage reports confirm sustained investor appetite for such assets during the recent low interest rate period, data through 2024, confidence probable.
Lending conditions for income producing properties in Reno involve a mix of agency lenders for qualifying multifamily properties, regional and national banks, life insurance companies, and in some cases debt funds, with underwriting that has become more conservative as interest rates have risen, emphasizing debt service coverage, stabilized occupancy, and sponsor strength, as reported in lender and brokerage capital markets updates for the region, data through 2024, confidence probable.
For investors access to financing remains available but more constrained than during earlier low rate years, and capital market pricing for Reno assets now reflects both the higher risk free rate environment and an evolving view of long term growth and volatility in the metro.
Section 12Taxes
Nevada tax structure is a significant factor in Reno investment decisions, as the state does not levy a personal income tax and relies heavily on sales taxes, gaming taxes, and property taxes for revenue, which affects both residents and property owners.
Property taxation in Reno is administered primarily at the county level, with Washoe County responsible for assessment and billing in coordination with other local taxing entities, as described by the Washoe County Assessor and Treasurer offices, data through 2024, confidence confirmed.
Nevada has constitutional and statutory provisions that limit the rate of increase in taxable property value from year to year for most properties, which can moderate the pace at which property tax burdens rise in a rapidly appreciating market, although details vary by property type and circumstances, as outlined by the Nevada Department of Taxation and the Washoe County Assessor in guidance documents and property tax FAQs, data through 2024, confidence confirmed.
Effective property tax rates for residential and commercial property in Reno are generally moderate compared with some higher tax states, but the tax burden can still be meaningful in absolute dollars for high value properties and must be carefully modeled in underwriting, particularly when acquisitions reset assessed values toward market levels, according to sample tax bills and millage rate schedules published by Washoe County and the State of Nevada, data through 2024, confidence probable.
For investors the Nevada choice not to tax personal income can enhance the attractiveness of Reno for high earning residents and entrepreneurs, indirectly supporting housing and commercial demand, while the property tax regime requires attention to assessment practices, caps on value growth, and potential legislative changes over time.
Section 13Insurance
Insurance costs and coverage in Reno reflect the region climate, topography, and risk profile, which differ in important ways from coastal and hurricane exposed markets but include their own hazards.
Reno sits in a high desert environment at the foot of the Sierra Nevada, with exposure primarily to severe winter storms, high winds, hail, occasional flooding along the Truckee River and tributaries, and wildfire smoke and embers carried from surrounding areas, as detailed in National Oceanic and Atmospheric Administration climate and severe weather data and in Nevada hazard mitigation plans, data through 2024, confidence confirmed.
Federal Emergency Management Agency flood insurance rate maps identify floodplains along the Truckee River and in certain low lying areas, where properties may be subject to flood insurance requirements for federally backed mortgages and to higher risk based premiums, while many neighborhoods on higher ground are outside special flood hazard areas and therefore do not require flood coverage, data for Washoe County and the City of Reno through 2024, confidence confirmed.
Wildfire risk in Reno is more about proximity to wildland urban interface areas and exposure to smoke and embers than about direct involvement in large forest fires, but insurer underwriting guidelines and premium structures have evolved in recent years to reflect increased wildfire risk across the West, which can affect insurance availability and pricing for properties near foothills and undeveloped lands, as noted in insurance industry reports and state insurance department briefings referencing Nevada markets, data through 2024, confidence probable.
Overall property insurance costs in Reno tend to be lower than in high risk coastal hurricane zones and certain high wildfire risk California regions, but they have still risen due to national trends in reinsurance, construction cost inflation, and catastrophe losses, making it essential for investors to obtain up to date quotes and to budget for potential premium increases over time, based on carrier filings and market outlooks through 2024, confidence probable.
For existing older properties, insurers may require roof replacements, electrical upgrades, or other improvements to maintain coverage at reasonable rates, particularly in multifamily and commercial buildings, so capital plans should incorporate both physical risk mitigation and insurance compliance.
Section 14Landlord Tenant and Regulatory Environment
Nevada landlord tenant law is generally considered favorable to landlords compared with some coastal states, but Reno investors must still comply with a defined set of procedures for lease agreements, security deposits, notices, and evictions.
Nevada state statutes govern core landlord tenant relationships, including requirements for written leases, limitations and handling of security deposits, obligations to maintain habitable conditions, and processes for summary eviction in cases of nonpayment or other lease violations, as codified in Nevada Revised Statutes and summarized by the Nevada judiciary and legal aid organizations, data through 2024, confidence confirmed.
Eviction procedures in Nevada require proper notice, filing with the local court, and in some cases a hearing, with specific timelines and forms prescribed by law; these procedures are faster and less complex than in some highly tenant protective jurisdictions but still impose due process requirements that landlords must follow, based on Nevada court guidance and statutory texts, data through 2024, confidence confirmed.
During the public health emergency of the early twenty twenties, federal and state eviction moratoria and rental assistance programs temporarily altered the operating environment for landlords, and while many of these emergency measures have expired, they provide a reminder that legal frameworks can change rapidly in response to economic and social pressures, as documented in federal Centers for Disease Control orders and Nevada state directives from that period, data years approximately 2020 through 2022, confidence confirmed.
Nevada does not have a statewide system of traditional rent control for private market units, and Reno has not adopted local rent control ordinances of the type seen in a few other United States cities, although housing affordability concerns have driven discussions about tenant protections, affordable housing incentives, and related policies, as reflected in City of Reno council debates and housing policy reports, data through 2024, confidence probable.
For investors this framework means that while Nevada law provides tools to enforce leases and adjust rents to market levels, there is still regulatory risk in the form of potential future policy changes, and there is reputational risk associated with how landlords manage evictions, maintenance, and tenant relations.
Section 15Infrastructure
Reno infrastructure combines interstate connectivity, regional air service, and local roads with ongoing challenges related to aging systems, capacity constraints, and water supply.
The city lies along Interstate 80, a major east west route, and is served by US 395 and other regional highways that connect Reno to California, Las Vegas, and other parts of Nevada, supporting logistics and commuter flows, as documented by the Nevada Department of Transportation and regional transportation plans, data through 2024, confidence confirmed.
Reno Tahoe International Airport provides commercial air service with connections to western and national hubs, which is critical for business and tourism, and airport authority reports show ongoing investment in facilities and airside infrastructure to handle growing passenger volumes, data through 2024, confidence confirmed.
Truckee Meadows Water Authority manages water supply and distribution for Reno and surrounding communities, drawing primarily from the Truckee River system and upstream storage in Lake Tahoe and other reservoirs, and has developed long term resource plans that account for climate variability, drought risk, and population growth, as described in its integrated resource plans and public reports, data through 2024, confidence confirmed.
Wastewater, stormwater, and transportation infrastructure require ongoing investment to keep pace with growth, and local and regional planning documents recognize the need to upgrade aging facilities and expand capacity in growth corridors, particularly in south Reno and outlying valleys, as reflected in Truckee Meadows Regional Planning Agency and City of Reno capital improvement plans, data through 2024, confidence probable.
Public transit service in Reno is provided by the Regional Transportation Commission of Washoe County, which operates bus routes and paratransit services, but transit coverage and frequency are limited compared with larger cities, which shapes travel behavior and residential patterns and underscores the importance of parking and roadway access for many real estate assets, based on RTC system maps and performance reports through 2024, confidence probable.
For investors, understanding infrastructure capacity and planned improvements is essential, as properties in well served corridors can benefit from better access and resilience, while those in areas with constrained roads, utilities, or water supply may face higher risks or development limitations.
Section 16Climate and Physical Risks
Reno climate is characterized by four distinct seasons, with hot dry summers, cold winters with periodic snow, and relatively low average annual precipitation, along with significant year to year variability, as described by National Oceanic and Atmospheric Administration climate normals for the Reno area, data years 1991 through 2020, confidence confirmed.
The city elevation and proximity to the Sierra Nevada mountains result in exposure to winter storms that can bring heavy snow and cold, and to summer heat waves, both of which place demands on building envelopes, roofing, and mechanical systems, according to NOAA climate data and state hazard mitigation plans for Nevada, data through 2024, confidence probable.
Flood risk is centered on the Truckee River and low lying areas, with Federal Emergency Management Agency flood maps delineating special flood hazard areas that can be subject to inundation during significant storm or snowmelt events; properties within these zones may face flood insurance requirements, potential building elevation or design standards, and episodic disruption, data for Washoe County and the City of Reno through 2024, confidence confirmed.
Wildfire and smoke represent a growing concern across the interior West, and while Reno itself is an urbanized valley, surrounding foothills and wildland areas can be the source of smoke and, in some cases, fire that encroaches on urban fringe neighborhoods, which affects air quality, outdoor amenity use, and in rare cases direct property risk, as detailed in state and regional wildfire risk assessments and in Environmental Protection Agency and NOAA air quality monitoring data for the Reno area, data through 2024, confidence probable.
Climate change projections from the United States Global Change Research Program suggest that the region will likely experience increased temperature, longer warm seasons, and potential shifts in snowpack and runoff patterns, which could influence water availability, fire risk, and the frequency of heat waves and extreme weather events, data through 2023, confidence probable.
For investors, this risk profile means that site selection, building design, and operational planning must account for heat, cold, snow, flood, and smoke exposure, and that resilience measures such as robust roofing, effective drainage, and modern heating and cooling systems are critical components of long term asset performance.
Section 17Neighborhoods and Submarkets
Reno exhibits distinct neighborhoods and submarkets, each with its own housing stock, price points, tenant bases, and risk profiles.
Downtown Reno combines casino centered hospitality, older office buildings, and a growing inventory of apartments and condominiums, including adaptive reuse of older structures and new development along the riverfront; this area benefits from walkability and proximity to entertainment and employment but can also face challenges related to congestion, nightlife, and perceptions of safety, as noted in City of Reno planning documents and private market reports, data through 2024, confidence probable.
Areas near the University of Nevada Reno, including neighborhoods just north of downtown, contain significant student oriented housing, both purpose built and in older single family and small multifamily structures, with demand driven by enrollment trends and university housing policies; these areas often exhibit high turnover, strong demand during academic terms, and sensitivity to changes in enrollment and student preferences, as shown in university housing reports and local property management data, data through 2023, confidence probable.
South Reno and other suburban districts along the US 395 corridor feature large concentrations of newer single family subdivisions, townhomes, and Class A multifamily communities, with residents drawn by newer schools, shopping centers, and proximity to employment centers and commuter routes; these submarkets typically command higher rents and prices than older central neighborhoods, as evidenced by Zillow and brokerage neighborhood level analyses, data through 2024, confidence probable.
Spanish Springs and other north and east valley communities include a mix of established subdivisions and newer developments, with varying levels of infrastructure and amenity provision, and with housing that often appeals to families seeking larger lots and more space at somewhat lower price points than the most premium south Reno locations, based on local market reports and listing data, data through 2024, confidence probable.
Legacy neighborhoods closer to the core, including older residential districts with a range of housing ages and conditions, present opportunities for renovation and repositioning but also carry risks related to property maintenance, school quality perceptions, and localized crime, which must be carefully evaluated through on the ground diligence and data from local police, code enforcement, and school districts, data through 2024, confidence probable.
From an investor perspective, each submarket offers different combinations of yield, growth potential, and risk, and successful strategies in Reno typically involve choosing a small number of submarkets and building deep local expertise rather than attempting to operate uniformly across the entire metro.
Section 18Opportunities
Reno offers a variety of real estate opportunities that are grounded in its growth, tax environment, and evolving economic base.
For multifamily investors, stabilized Class B and well located Class A properties in submarkets with durable employment drivers and moderate new supply present opportunities for stable income and measured rent growth, supported by population expansion and by the relocation of workers from higher cost markets, as indicated by the interplay of census growth data, institutional multifamily performance statistics, and pipeline analyses for the Reno metro through 2023, confidence probable.
Value add strategies that upgrade unit interiors and common areas in older multifamily communities, while maintaining rents at levels that remain affordable for local workers, can capture both operational upside and modest rent premiums, particularly where properties are located near employment nodes, transit corridors, or schools, as evidenced by case studies and rent spreads reported in brokerage and data provider research for Reno, data through 2023, confidence probable.
In the industrial sector, modern warehouse and distribution facilities near the Tahoe Reno Industrial Center and along key corridors offer exposure to strong tenant demand, long lease terms, and the ongoing trend toward regional distribution networks and e commerce fulfillment, which can support resilient cash flows even during moderate downturns, based on CoStar and brokerage industrial market reports for Reno through 2023, confidence probable.
Single family rental portfolios in select neighborhoods that balance tenant demand, school quality, and acquisition pricing can generate attractive yields given the relatively high rent levels for detached homes, although such strategies require careful attention to property taxes, insurance, and maintenance in a climate with temperature extremes and occasional snow, as outlined by Zillow rental data, county tax information, and insurance cost trends for the region through 2024, confidence probable.
Finally, mixed use redevelopment and infill projects in targeted downtown and university adjacent locations may create long term value by combining residential, retail, and office or hospitality uses in walkable environments, provided that sponsors can navigate entitlement processes, construction costs, and the cyclical nature of demand in these segments, as reflected in local planning initiatives and recent project experience in Reno, data through 2024, confidence probable.
Section 19Risks
Alongside these opportunities, Reno presents notable risks that accredited investors must weigh carefully.
The most fundamental risk is cyclicality; a significant portion of the regional economy is tied to construction, manufacturing, logistics, and tourism, all of which can be sensitive to national and global economic conditions, resulting in employment and income volatility that affects housing demand, occupancy, and rent growth, as shown by swings in Bureau of Labor Statistics employment and unemployment series for the Reno metropolitan area during past downturns, data through 2023, confidence confirmed.
Housing affordability risk is another critical factor; rapid increases in home prices and rents have outpaced income gains for many households, raising the possibility of political pressure for regulatory interventions, greater attention to tenant protections, or changes in development policy, as documented in local housing affordability studies, HUD analyses, and public debates in Reno and Washoe County, data through 2024, confidence probable.
Supply risk exists where new multifamily and single family projects concentrate in specific submarkets; although the overall region is land constrained, submarkets that experience multiple large project deliveries can face periods of elevated vacancy and concessions, which could pressure cash flows and valuations for existing properties, as noted in Yardi Matrix, RealPage, and CoStar pipeline and performance reports for Reno, data through 2023, confidence probable.
Environmental and climate risks, including drought, wildfire smoke, and localized flooding, can affect both property operations and long term desirability, and while these risks are less dramatic than hurricane or coastal flood risk in some other markets, they are material and may intensify with climate change, based on NOAA, FEMA, and United States Global Change Research Program findings for the region, data through 2024, confidence confirmed or probable.
Capital market risk is also relevant; in periods of higher interest rates and tighter credit, cap rates may adjust upward and financing terms may become less favorable, which can reduce leverage and equity returns for new acquisitions or refinancings, as shown in Real Capital Analytics and brokerage capital markets data for Reno and comparable markets through 2024, confidence probable.
Finally, regulatory and tax risk, while currently moderate in Nevada, always exists in the form of potential future changes in property tax structure, development impact fees, or tenant protection measures, particularly if housing affordability challenges become more acute.
Section 20Investor Implications
For accredited investors, Reno represents a high growth, high variability market that rewards informed, selective participation and punishes undisciplined speculation.
From a portfolio construction perspective, Reno multifamily and single family rental assets can provide exposure to western migration and Nevada tax advantages, with potential for above average rent and income growth in well chosen submarkets, but they should be balanced with more stable, less cyclical positions in other regions, given the metro sensitivity to economic cycles and industry mix, as suggested by the combination of census growth data, Bureau of Labor Statistics employment patterns, and multifamily performance metrics through 2023, confidence probable.
Industrial and logistics properties near the Tahoe Reno Industrial Center and along key transportation corridors align with structural trends in e commerce and supply chain reconfiguration, offering the potential for defensive cash flows and long term tenant relationships, though acquisition pricing and development costs reflect this attractiveness and require rigorous underwriting based on CoStar and brokerage industrial market evidence, data through 2023, confidence probable.
Investors pursuing value add strategies in multifamily or mixed use should prioritize assets with strong locations, sound physical fundamentals, and clear paths to cost effective improvements, rather than relying solely on market rent inflation, because much of the easy catch up appreciation associated with Reno growth story may already be embedded in current pricing, as indicated by the magnitude of past rent and price increases in Zillow, Redfin, and institutional multifamily data, data through 2024, confidence probable.
Given the region risk profile, conservative leverage, robust interest rate hedging where appropriate, and stress tested assumptions on vacancy, rents, and expenses are important tools for preserving resilience across cycles, especially in assets that are more exposed to cyclical sectors or to concentrated tenant bases.
Section 21Conclusion
Reno has emerged as a notable growth market in the interior West, combining population and job growth, a favorable Nevada tax environment, and evolving economic anchors in manufacturing, logistics, technology, education, and tourism.
Data from the United States Census Bureau, Bureau of Labor Statistics, Bureau of Economic Analysis, Department of Housing and Urban Development, and private market research providers confirm that the region experienced strong demographic and economic expansion over the last decade, along with significant increases in home prices and rents, development activity, and institutional investor interest, data through 2024, confidence confirmed or probable as noted in earlier sections.
At the same time, Reno is not a risk free growth story; it is a market where supply and demand can move quickly, where affordability and infrastructure constraints are real, and where environmental and cyclicality risks must be actively managed in portfolio design and deal level underwriting.
For accredited investors who approach Reno with clear strategies, robust data, and realistic expectations, the city and its surrounding metro can offer attractive long term opportunities in multifamily, single family rental, industrial, and selected commercial segments, while underscoring the importance of diversification and disciplined risk management across markets and asset classes.