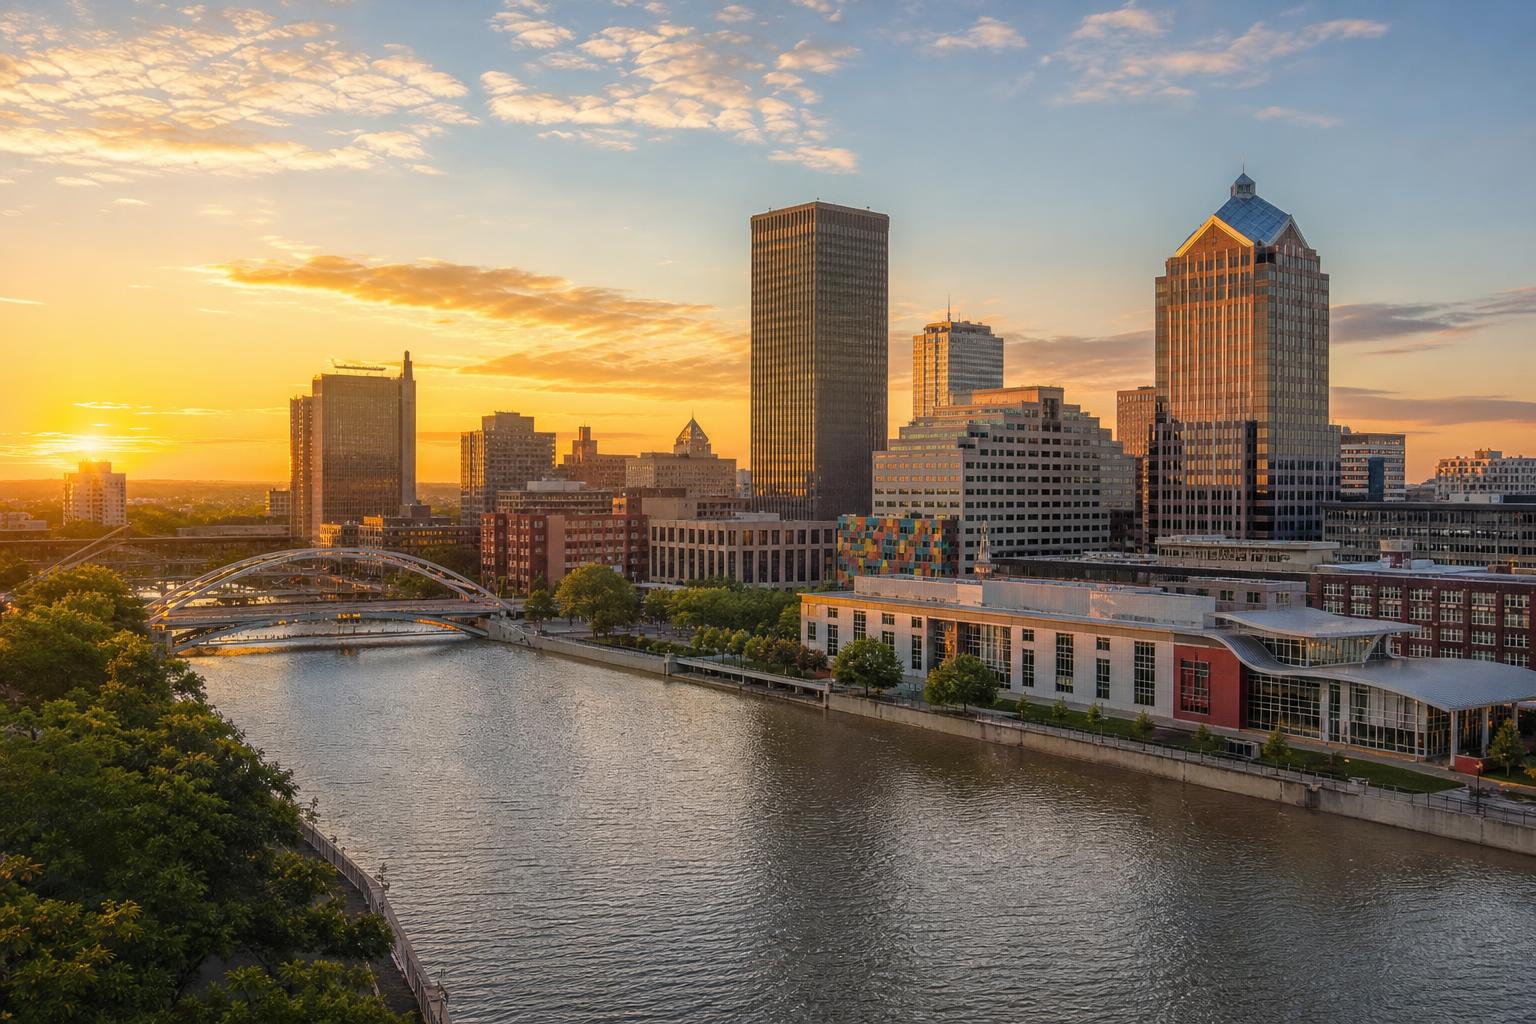
In brief · summary: Rochester
Rochester enters the fall of 2026 as one of the smaller and steadier metropolitan economies in the Northeast, and its real estate markets sit in a very different place in the cycle than fast growing Sunbelt metros. The Census Bureau's July 2025 vintage estimate, released in March 2026 and tracked through the Federal Reserve Bank of St. Louis, put the Rochester metropolitan statistical area's population at 1,056,149, while Monroe County, the urban core county, had an estimated population of 750,506, down from its 2020 peak. The city of Rochester itself has been losing residents gradually since the pandemic, a trend that is central to how an investor should read every other number in this review.
That slow, low growth backdrop is not a story of collapse. It is a story of stability layered on top of legacy industrial decline, now stabilizing around a healthcare, education, and advanced manufacturing base. The apartment market illustrates the current turn most clearly.
HUD's Market at a Glance report, citing CoStar data, put Rochester metro apartment vacancy at 5.4 percent in the first quarter of 2026, up slightly from 5.1 percent a year earlier, while separate Fannie Mae backed data cited by Apartment Loan Store showed vacancy at a tighter 4.6 percent with a forecast rise to 5.1 percent by the third quarter. Rents have climbed steadily but off a very low base, with the city's own tracked median rent up 40 percent over nine years to $1,081 a month in 2024. Home prices are rising faster than incomes, and downtown Rochester has quietly added more than 10,000 residents through a wave of adaptive reuse projects.
Section 01Executive Summary
Rochester enters the fall of 2026 as one of the smaller and steadier metropolitan economies in the Northeast, and its real estate markets sit in a very different place in the cycle than fast growing Sunbelt metros. The Census Bureau's July 2025 vintage population estimate, released in March 2026 and tracked through the Federal Reserve Bank of St. Louis, put the Rochester metropolitan statistical area's population at 1,056,149. Monroe County, the urban core county that contains the city itself, had an estimated 2025 population of 750,506, down from its 2020 census count of 759,443, according to Census Bureau estimates reported by the Rochester Beacon. The city of Rochester has followed the same downward drift, falling from 211,328 residents in the 2020 census to roughly 207,287 in the 2024 American Community Survey one year estimate.
That backdrop of flat to slightly declining population is the single fact an investor must hold in mind while reading every other number in this report, because it caps the ceiling on demand growth even as individual submarkets and property types outperform. The Bureau of Labor Statistics Rochester, NY Area Economic Summary, updated July 1, 2026, showed total nonfarm employment averaging about 512,600 in the first quarter of 2026, up a modest 0.1 percent from a year earlier, while the not seasonally adjusted unemployment rate stood at roughly 4.0 percent in June 2026. The apartment market is nonetheless tightening from a still comfortable base: HUD's Market at a Glance report, citing CoStar data, showed vacancy of 5.4 percent in the first quarter of 2026, and separate Fannie Mae backed data reported by Apartment Loan Store put vacancy at a tighter 4.6 percent with a forecast rise to 5.1 percent by the third quarter as new supply is absorbed. Rents have climbed steadily off a very low base, and downtown Rochester has added more than 10,000 residents through adaptive reuse of vacant office towers, per Rochester Business Journal reporting in June 2026.
The offsetting risks are concrete. Monroe County carries one of the highest effective property tax burdens in the country, with a median effective rate of about 2.44 percent of value, layered on top of a New York State personal income tax that Texas and Florida investors do not pay. Homeowners insurance premiums, while still low in absolute dollar terms compared with coastal and Gulf markets, are rising faster than the national average, and New York's Good Cause Eviction Law, which Rochester's city council has opted into, constrains how quickly and how far a landlord can raise rents. The investment case for Rochester rests on deep affordability, a diversified anchor employer base led by healthcare and optics, low exposure to hurricane and wildfire risk, and a shrinking multifamily supply overhang, weighed against a stagnant population, high carrying costs, and a legacy of manufacturing decline that has not fully reversed.
Section 02Population and Migration
Population growth is not Rochester's advantage, and any investor evaluating the metro should start there rather than end there. The Census Bureau's Annual Estimates of the Population of Metropolitan and Micropolitan Statistical Areas, as tracked by the Federal Reserve Bank of St. Louis and updated March 27, 2026, put the Rochester, NY metropolitan statistical area's population at 1,056,149 as of the July 1, 2025 vintage estimate, a figure that has been essentially flat for years. Monroe County, the core county containing the city of Rochester and most of its inner suburbs, had an estimated 2025 population of 750,506, according to Census Bureau data reported by the Rochester Beacon, down from 759,443 at the 2020 census, a decline of roughly 1.2 percent over five years.
The city of Rochester itself has followed a similar pattern. The 2020 decennial census counted 211,328 city residents, essentially flat versus 210,565 in 2010, but the 2024 American Community Survey one year estimate, compiled by Census Reporter and Neilsberg, put the city's population at approximately 207,287, implying a decline of roughly 1.9 percent since 2020. The Rochester Beacon, reporting on Census Bureau data in 2024, found that domestic out migration was the dominant factor in Monroe County's pandemic era loss, with more than 10,000 people leaving the county for other parts of New York State or the rest of the country between April 2020 and July 2022.
| Geography | Population | Scope and source |
|---|---|---|
| Rochester metropolitan area | 1,056,149 | 2025 vintage, Census Bureau via FRED, updated March 2026 |
| Monroe County | 750,506 | 2025 estimate, Census Bureau via Rochester Beacon |
| Monroe County | 759,443 | 2020 census |
| City of Rochester | ~207,287 | 2024 ACS 1-year estimate, Census Reporter |
| City of Rochester | 211,328 | 2020 census |
The one bright spot inside this otherwise flat picture is geographic reshuffling within the metro, most visibly the repopulation of downtown Rochester, which is covered in the neighborhoods section below. For an investor, the conclusion is straightforward and important: Rochester is not a demand growth story in the way Sun Belt metros are, and any underwriting model that assumes meaningful population driven rent growth is not supported by the data. The market instead rewards operators who can capture share within a roughly fixed or slowly shrinking population base, through downtown repopulation, aging housing stock replacement, and price competitive positioning against more expensive metros.
Section 03Jobs and Economic Anchors
Employment in Rochester is essentially flat, which is consistent with the population data and equally important for underwriting. The Bureau of Labor Statistics Rochester, NY Area Economic Summary, updated July 1, 2026, reported total nonfarm employment averaging about 512,600 in the first quarter of 2026, an increase of only 600 jobs, or 0.1 percent, from the same period a year earlier. Separate Federal Reserve Economic Data series for the metro, which use a different seasonal adjustment convention, showed employment of 517,800 in December 2025, ranging between 518,300 and 519,900 across the fall of 2025, and reaching 523,100 in May 2026, though that May reading was down 0.2 percent from a year earlier. These figures should be read together as describing essentially flat employment with modest month to month noise rather than a real disagreement. The not seasonally adjusted unemployment rate stood at approximately 4.0 percent in June 2026, according to Federal Reserve Economic Data tracking of Bureau of Labor Statistics figures, a level consistent with a labor market that is neither tightening nor loosening meaningfully.
| Indicator, Rochester metro | Value | Change | Scope and source |
|---|---|---|---|
| Total nonfarm employment | 512,600 | +0.1% | Q1 2026 average, BLS |
| Total nonfarm employment | 523,100 | -0.2% | May 2026, FRED not seasonally adjusted |
| Unemployment rate | ~4.0% | stable | June 2026 not seasonally adjusted, FRED/BLS |
The economic base behind these numbers has diversified substantially away from its twentieth century concentration in film and imaging manufacturing, though the legacy of that era, Eastman Kodak, Xerox, and Bausch and Lomb, still shapes the region's identity and its optics and photonics cluster. Healthcare and education now anchor the region: the University of Rochester, including its medical center, employs more than 26,000 people, making it the region's largest employer, while Rochester Regional Health, the area's second major hospital system, employs more than 19,000, according to reporting compiled by the Rochester Beacon on Forbes employer rankings. Wegmans Food Markets, the employee owned supermarket chain founded in Rochester in 1916 and headquartered in the suburb of Gates, employs nearly 14,000 people locally out of more than 50,000 company wide, and Paychex, the payroll and human resources firm headquartered in the suburb of Penfield, processes payroll for roughly one in every twelve United States employees. Additional large employers include Xerox, L3Harris, Sherwin-Williams, General Electric, ITT Goulds Pumps, Bausch and Lomb, and utility RG&E. The Greater Rochester Chamber of Commerce estimates that more than 89,000 small businesses, defined as fewer than 500 employees, account for 98.9 percent of all regional businesses and employ 46.4 percent of the total workforce. For real estate, the takeaway is that Rochester's employment base is durable and diversified across healthcare, education, and advanced manufacturing, which supports steady rent paying capacity, but it is not a job growth engine, so occupancy and rent gains in Rochester must come from supply discipline and share capture rather than a rising tide of new demand.
Section 04Income
Household income in Rochester shows a sharp divide between the city and its suburbs, and that divide is central to understanding both affordability and the limits on rent growth. The American Community Survey 2024 one year estimate, compiled by Census Reporter and Neilsberg, put the city of Rochester's median household income at $46,882, while Monroe County's median household income, which includes the more affluent suburbs, was $76,520 in the same release. A separate Census Bureau Small Area Income and Poverty Estimates program figure, tracked through the Federal Reserve Bank of St. Louis, put Monroe County median household income at $76,594 for 2024, essentially the same figure from a different Census Bureau methodology.
| Geography | Median household income | Scope and source |
|---|---|---|
| City of Rochester | $46,882 | 2024 ACS 1-year, Census Reporter |
| Monroe County | $76,520 | 2024 ACS 1-year, Census Reporter |
| Monroe County | $76,594 | 2024 SAIPE, Census Bureau via FRED |
The gap between city and county income, with city income running at only about 61 percent of the countywide figure, is one of the widest urban-suburban income divides tracked by the local research group ACT Rochester, and it explains why the city's own rental and affordable housing markets look so different from the broader metro's. A landlord operating urban core apartments in Rochester is working against a renter base with meaningfully lower income than the metro average, which caps how aggressively rents can be pushed even where vacancy is tight, while suburban and county wide income levels support stronger demand for single family and higher end rental product outside city limits. The practical implication is that Rochester is not a uniform market: income, affordability, and rent capacity vary sharply by submarket, and underwriting should be built at the neighborhood level rather than the metro level.
Section 05Housing and Multifamily
The apartment market is where Rochester's tightening cycle is most visible, though the picture varies depending on the data source. HUD's Market at a Glance report for the Rochester metro, citing CoStar data, put the overall apartment vacancy rate at 5.4 percent in the first quarter of 2026, up slightly from 5.1 percent a year earlier. Separate Fannie Mae backed data reported by Apartment Loan Store showed a tighter vacancy rate of 4.6 percent as of mid-2026, with a forecast rise to 5.1 percent by the third quarter of 2026 as rent recovery lags new supply absorption. HUD's federal Fair Market Rent schedule for the Rochester, NY metropolitan area, effective October 1, 2025 for fiscal year 2026, set the one bedroom rent at $1,022 and the two bedroom rent at $1,149, with an efficiency at $767, a three bedroom at $1,427, and a four bedroom at $1,720.
| Series and scope | Level or reading | Change | Period and source |
|---|---|---|---|
| Overall vacancy, CoStar data | 5.4% | +0.3 pts YoY | Q1 2026, HUD Market at a Glance |
| Overall vacancy, Fannie Mae data | 4.6% | forecast to 5.1% by Q3 | Mid-2026, Apartment Loan Store |
| Fair Market Rent, 1-bedroom | $1,022 | not stated | FY2026 effective Oct 2025, HUD |
| Fair Market Rent, 2-bedroom | $1,149 | not stated | FY2026 effective Oct 2025, HUD |
The spread between a 5.4 percent CoStar reading and a 4.6 percent Fannie Mae reading is a function of different property samples rather than a contradiction, and both point to a market that remains comfortably below the double digit vacancy levels seen in oversupplied Sun Belt metros. Rochester never experienced the wave of new construction that pushed up vacancy in Houston, Austin, or Phoenix, so its apartment market has spent the last several years in a narrower, more stable band. The city's own tracked median rent data, cited by the Rochester Beacon in its July 2026 housing gap analysis, showed median rent rising from approximately $770 a month in 2015 to $1,081 a month in 2024, a 40 percent increase over nine years that has outpaced local wage growth and pushed more than half of the city's renter households into cost burdened status.
Section 06Rents
Rochester rents remain among the most affordable of any mid sized United States metro in absolute dollar terms, even though they have risen sharply on a percentage basis from a very low starting point. The Rochester Beacon's July 2026 analysis of city housing data found median rent citywide at $1,081 a month in 2024, up 40 percent from about $770 in 2015, a pace of increase that reflects both genuine demand growth in a repopulating downtown and a structural shortage of new supply relative to need. Broader market rate listing data compiled by Rent.com for 2026 showed average asking rents of about $1,200 for a one bedroom apartment and $1,400 for a two bedroom apartment across the metro, somewhat higher than the city's blended median because it captures newer, market rate product rather than the full mix of older city housing stock. HUD's fiscal year 2026 Fair Market Rent for a two bedroom unit, effective October 2025, was set at $1,149, a figure used to calibrate federal housing voucher payment standards across the metro.
The Rochester Beacon's housing gap reporting found that 50.9 percent of the city's renter households are cost burdened, spending more than the commonly used affordability threshold of their income on rent, and that more than 29,000 of the city's roughly 57,700 renter households fall into that category. That statistic captures the central tension in the Rochester rental market: rents remain low by national standards, which supports strong occupancy and a deep base of price sensitive renters, but incomes in the city are low enough, at a median of $46,882 according to 2024 American Community Survey data, that even modest rent increases translate into real affordability strain for a large share of the tenant base. For an investor, the conclusion is that Rochester supports steady, low volatility rent growth rather than rapid appreciation, and that rent increases pushed too aggressively risk running into both affordability limits and, as discussed in the regulatory section below, the state's Good Cause Eviction Law.
Section 07Vacancy
Vacancy in Rochester tells a story of a market that never overbuilt and is now tightening modestly as demand, concentrated in downtown repopulation and steady suburban household formation, outpaces a light supply pipeline. HUD's Market at a Glance report, citing CoStar data, put overall apartment vacancy at 5.4 percent in the first quarter of 2026, up 0.3 percentage points from 5.1 percent a year earlier, a small increase that reflects the delivery of several large new projects, discussed in the supply pipeline section below, being absorbed into the market. Separate Fannie Mae backed data reported by Apartment Loan Store showed a tighter reading of 4.6 percent vacancy in mid-2026 with a forecast increase to 5.1 percent by the third quarter as that same new supply leases up, which is a normal and expected pattern rather than a sign of oversupply.
Commercial vacancy diverges by property type. Reporting by the Rochester Business Journal in May 2026 described industrial vacancy as exceptionally tight, in the range of 4 to 5 percent, with limited new product available because high construction costs make it difficult for developers to build competitively priced new space. CBRE's second quarter 2025 industrial figures for the Rochester metro put vacancy at a still low 6.0 percent with average asking rent of $6.82 per square foot. Office vacancy is bifurcated by class: the Rochester Business Journal reported that most Class A towers maintain occupancy in the 80s and 90s percent range with positive net absorption and modest rent gains, while Class B and C buildings, the older and less amenitized stock, are experiencing meaningfully higher vacancy as tenants consolidate into higher quality space or, increasingly, as owners convert vacant office towers to residential use. The unifying theme is that Rochester's vacancy is low and stable to tightening across most property types, with the notable exception of commodity office space, which mirrors the national flight to quality pattern seen in much larger metros.
Section 08Supply Pipeline
Rochester's forward supply picture is defined less by a wave of new ground up construction and more by a sustained, publicly supported push to convert and rehabilitate existing buildings, much of it concentrated downtown. WXXI News reported in February 2026 that the state tallies 4,700 housing units built, renovated, under construction, or in the pipeline in the city of Rochester since 2022, the most of any part of the Finger Lakes region and of any part of New York State outside New York City. The Rochester Beacon's July 2026 housing gap analysis put the more specific figure of rental units at more than 4,200 started or completed citywide since 2022, more than 3,200 of them affordable and nearly 1,000 market rate, representing more than 2 billion dollars in combined investment.
The largest single project underway is Andrews Terrace, a 526 unit, 330 million dollar development, according to the Rochester Beacon. Other notable projects include Gateway Apartments, a 72.3 million dollar conversion of a vacant seven story office building into 129 affordable homes announced by Governor Hochul's office through New York State Homes and Community Renewal, Tailor Square at 134 units and 84 million dollars, Park Square II at 240 units and 119 million dollars, and Gardner's Lofts, an 88 unit supportive housing project worth roughly 72 million dollars. The Rochester Business Journal reported in June 2026 that at least 1,600 units of housing are in some stage of development in and near downtown Rochester specifically, and that downtown's residential population had surpassed 10,000 for the first time, with total downtown investment rising from 491 million dollars in the 2024 to 2025 period to 625 million dollars in the 2025 to 2026 period. A meaningful share of this pipeline consists of office to residential conversions, including projects known locally as Tower280, The Metropolitan, and Innovation Square, a pattern the Rochester Business Journal described as gaining momentum precisely because it is often more economical than new ground up construction given elevated interest rates and construction costs.
For an investor, the conclusion is that Rochester's supply growth is real and geographically concentrated in the urban core, driven substantially by state subsidy dollars and by the economics of adaptive reuse rather than by market rate developer appetite for greenfield construction, and that the office to residential conversion trend is both a meaningful opportunity and a partial explanation for why office vacancy, discussed above, keeps declining even without much tenant demand growth.
Section 09Single Family Homes
Single family home values in Rochester are rising steadily and, in percentage terms, faster than the metro's income growth, even though absolute prices remain low by national standards. Zillow's home value index for the Rochester, NY area put the average home value at $252,192 in 2026, up 4.3 percent over the prior year, with homes typically going to pending status in around 8 days, a pace that indicates a still competitive, seller favorable market for well priced listings. The Rochester Beacon's July 2026 housing gap reporting, drawing on city and state housing data, found that the city's own median home sale price rose to $181,000 in the second quarter of 2026, up sharply from $102,000 in 2018, a near doubling over roughly eight years that reflects both genuine appreciation and the low starting base of the city's aging housing stock.
| Metric and scope | Value | Change | Period and source |
|---|---|---|---|
| Average home value, metro | $252,192 | +4.3% YoY | 2026, Zillow |
| Median sale price, city of Rochester | $181,000 | vs $102,000 in 2018 | Q2 2026, Rochester Beacon |
| Days to pending, metro | ~8 days | not stated | 2026, Zillow |
The same Rochester Beacon reporting found that the city's homeownership rate stood at only 38.1 percent, the lowest of any jurisdiction in the eight county Greater Rochester region, with sharp racial disparities: a homeownership rate of 45.7 percent among white households compared with 32.8 percent among Black households and 28.4 percent among Hispanic and Latino households. That combination, rapidly rising prices layered on top of already low homeownership and a large renter population with limited income growth, is a structural tailwind for single family rental and small multifamily investment strategies in the city, because a large and likely growing share of city households will continue renting rather than buying even as home values climb. For an investor, low absolute entry prices, rising values, and a persistently large renter pool make Rochester's single family and small multifamily stock a market where modest but durable appreciation can be paired with steady rental demand, provided the aging condition of much of the housing stock, discussed further in the neighborhoods section, is underwritten with realistic capital expenditure assumptions.
Section 10Commercial Real Estate and Retail Centers
Rochester's commercial sectors show the same divergence between winners and laggards found in much larger metros, just at a smaller scale. Office is the clearest example of a flight to quality market. The Rochester Business Journal reported in May 2026 that Class A office towers are performing well, with positive net absorption, increased occupancy, and slight rent gains, and that most Class A buildings maintain occupancy in the 80s and 90s percent range. Class B and C buildings, by contrast, are experiencing notable vacancy pain, and companies with expiring leases are increasingly choosing to renew in place rather than relocate, because the cost of remodeling space or paying brokerage commissions on a move often exceeds the savings from switching buildings. This dynamic is accelerating the office to residential conversion trend described in the supply pipeline section, since owners of struggling Class B and C towers increasingly see residential conversion as more economically viable than continuing to compete for a shrinking pool of office tenants.
Industrial real estate is Rochester's strongest commercial sector by a clear margin. The Rochester Business Journal's May 2026 reporting described industrial vacancy as exceptionally low, in the 4 to 5 percent range, constrained further by the high cost of new construction, which makes it difficult for developers to bring new competitively priced product to market even where tenant demand exists. CBRE's second quarter 2025 industrial figures for the metro showed a similarly tight vacancy rate of 6.0 percent alongside an average asking rent of $6.82 per square foot. Retail conditions were described by TenantBase's second quarter 2026 Rochester commercial market report as broadly stable, without the kind of construction overhang or sharp vacancy swings seen in faster growing metros, consistent with a market where retail supply has long tracked a slow growing, largely suburban population base rather than speculative new development.
| Sector and scope | Vacancy | Asking rent | Period and source |
|---|---|---|---|
| Office, Class A, metro | ~80-90%+ occupied | modest gains | Q2 2026, Rochester Business Journal |
| Office, Class B/C, metro | notably elevated vacancy | not stated | Q2 2026, Rochester Business Journal |
| Industrial, metro | 4-5% | not stated | 2026, Rochester Business Journal |
| Industrial, metro | 6.0% | $6.82/SF | Q2 2025, CBRE |
| Retail, metro | broadly stable | not stated | Q2 2026, TenantBase |
The unifying commercial conclusion for an investor is that industrial space, in a supply constrained market with genuinely low vacancy, is the sector to underwrite with the most confidence, that office investment should be limited to the best located and best amenitized Class A assets or approached through the conversion lens rather than as continued office use, and that retail, while not a growth story, offers a stable, low volatility income profile tied to a mature, slow growing suburban consumer base.
Section 11Transactions and Capital Markets
Investment activity in Rochester multifamily has continued despite higher interest rates, though on a much smaller scale than in major metros. Apartment Loan Store data for 2026 put average multifamily capitalization rates across all classes in Rochester at approximately 5.6 percent, broadly consistent with national multifamily pricing of about 5.4 to 5.6 percent for comparable assets. That same data showed Class A and Class B cap rates expanding by about 5 basis points in the second quarter of 2026 as rents softened slightly, while Class C cap rates held roughly stable, a pattern indicating that pricing pressure has been concentrated in newer, higher quality assets rather than in the older workforce housing stock that dominates much of Rochester's apartment inventory.
The Rochester Business Journal's May 2026 reporting on the region's commercial real estate market described continued strong lender appetite for quality multifamily deals even as financing costs have risen substantially, with interest rates around 6 percent compared with roughly 3 percent four years earlier. That increase has forced developers and buyers to contribute more equity and accept longer amortization schedules in order to meet standard lender debt service coverage ratios, typically a minimum of 1.2 times, on new acquisitions and refinancings. Much of the visible capital flow into Rochester real estate over the past several years has come through public and quasi public channels rather than pure private market transactions, including the more than 2 billion dollars in combined investment behind the roughly 4,200 rental units started or completed citywide since 2022, a substantial share of which was structured as affordable housing supported by New York State Homes and Community Renewal subsidies, tax credits, and other public financing tools alongside private capital. For an investor, the practical read is that Rochester offers cap rates modestly above the largest coastal and Sun Belt metros, reflecting its smaller scale and slower growth profile, and that public subsidy programs are a meaningful and durable source of capital for workforce and affordable multifamily development in the market, a financing avenue less prominent in faster growing but less subsidized metros.
Section 12Taxes
Taxes are the most important structural headwind in the Rochester investment case, and they are layered in a way that few other markets in this series experience: New York imposes both a meaningful state personal income tax and unusually high local property taxes, a double burden that markets like Texas and Florida do not carry. New York's state income tax runs on nine progressive brackets from 4 percent up to a top marginal rate of 10.9 percent on income above 25 million dollars for a single filer, according to tax preparation guides summarizing the New York State Department of Taxation and Finance's published schedule, with the state trimming rates modestly for lower brackets beginning in 2026 as the first phase of a two year cut.
Property taxes are the larger and more immediate concern for a real estate investor. Monroe County's 2026 budget set the county only full value tax rate at $5.67 per 1,000 dollars of taxable value, a historic low for the county after a 36 cent reduction, according to Monroe County government reporting, though that county rate is only one layer of a total bill that also includes school district, city or town, and special district levies. Compiled analyses of effective property tax rates, drawing on New York State Office of Real Property Tax Services equalization data, put Monroe County's median effective residential property tax rate at approximately 2.44 percent of assessed value, more than double the national median of about 1.02 percent, with wide variation by municipality: the town of Gates carries the county's highest effective rate at approximately 3.45 percent, while the suburb of Irondequoit carries one of the lowest at approximately 1.43 percent, reflecting differences in local school district levies and special district assessments.
| Item | Value | Scope and source |
|---|---|---|
| New York State income tax | 4% to 10.9% brackets | 2026, NYS Dept of Taxation and Finance via tax guides |
| Monroe County full-value rate, county only | $5.67 per $1,000 | 2026, Monroe County government |
| Monroe County median effective property tax rate | ~2.44% of value | 2026, ORPTS equalization data via tax research compilations |
| Highest municipal rate, town of Gates | ~3.45% | 2026, same compilation |
| Lowest municipal rate, town of Irondequoit | ~1.43% | 2026, same compilation |
For an investor, the combined effect of a state income tax and an effective property tax rate more than double the national median means that Rochester's already low absolute rents and home prices carry a heavier relative tax burden than the headline affordability numbers suggest, and every underwriting model should build in the specific municipal and school district tax rate for a given parcel, since the difference between an Irondequoit rate near 1.43 percent and a Gates rate near 3.45 percent can materially change a deal's net operating income and cash on cash return.
Section 13Insurance
Insurance in Rochester remains inexpensive in absolute dollar terms relative to the national picture and especially relative to coastal and Gulf Coast markets, but costs are rising faster than the national average and faster than local rents. Insurify's 2026 rate data put the average Rochester homeowners insurance premium at approximately $1,524 per year, or $127 per month, for a policy with 300,000 dollars of dwelling coverage and a 1,000 dollar deductible, with Rochester clustering alongside Syracuse and Buffalo in the roughly 1,100 to 1,240 dollar per year range on other rate measures. Those absolute levels are a small fraction of the multi thousand dollar premiums documented in hurricane exposed Gulf Coast metros.
| Item, Rochester metro | Value | Scope and source |
|---|---|---|
| Average homeowners premium | $1,524/yr | 2026, Insurify, $300k dwelling/$1,000 deductible |
| New York statewide premium change, 5 years | +13% | MoneyGeek analysis of state rate data |
| Upstate NY annual premium increases | ~10-12%/yr | RochesterFirst, Vooma Insurance Agency reporting |
The trend is nonetheless notable. Analysis reported by MoneyGeek found that New York State has seen a 13 percent increase in the average cost of homeowners insurance over the past five years, and reporting by RochesterFirst and by the Vooma Insurance Agency put annual increases specific to the upstate New York region, including Rochester, in the range of 10 to 12 percent a year, driven largely by the sharply higher cost of building materials and labor since 2020, including lumber, roofing, copper, and drywall, rather than by any single catastrophic weather event. Some individual upstate homeowners with no claims history over a decade reported premium increases as high as 300 percent, according to accounts collected by Vooma, illustrating that insurers are repricing risk broadly across the region rather than only in response to specific claims. For an investor, the conclusion is that Rochester's insurance costs, while still low relative to national and especially Gulf Coast and hurricane exposed benchmarks, should not be assumed static, and every underwriting model should build in continued annual increases in the high single to low double digit percentage range rather than treating current premiums as a durable baseline.
Section 14Landlord Tenant and Regulatory Environment
New York's landlord tenant regulatory environment is considerably more tenant protective than Sun Belt states, and Rochester specifically has opted into the state's newest and most consequential tenant protection measure. New York's Good Cause Eviction Law, which took effect statewide on April 20, 2024, applies automatically in New York City and is available to every other city, town, and village through local opt in legislation, according to the New York State Attorney General's office. Rochester's city council passed its own Good Cause Eviction ordinance, according to reporting by the law firms Harris Beach Murtha and Legal Survival, placing the city alongside Albany, Ithaca, Kingston, and Poughkeepsie among the upstate municipalities that have adopted the protection.
Where Good Cause applies, a landlord generally needs a legally recognized reason to evict a tenant or decline to renew a lease, and a rent increase above the lower of 5 percent plus the regional Consumer Price Index or 10 percent per year is presumed unreasonable, with the burden falling on the landlord to justify a larger increase based on documented rising costs such as taxes, insurance, or necessary repairs. Legally sufficient grounds for nonrenewal or eviction under the law include nonpayment of rent, provided the nonpayment did not result from an unreasonable increase, violation of a substantial lease obligation, nuisance, grossly negligent property damage, interference with other occupants, illegal use of the premises, an owner's need to recover the unit as a principal residence, or demolition or withdrawal of the unit from the rental market. The law exempts small landlords, owner occupied buildings with 10 or fewer units, subletters, and units that are already rent regulated, income restricted, condominium or cooperative owned, or located in buildings that received a certificate of occupancy on or after January 1, 2009.
Outside of Good Cause, Rochester and the rest of upstate New York are not subject to the older rent stabilization regime under the Emergency Tenant Protection Act that governs much of New York City and some downstate counties, so Rochester landlords retain more flexibility on rent setting for new tenancies than New York City owners do, subject to the Good Cause increase presumption once a tenant is in place. Eviction itself proceeds under Article 7 of the state's Real Property Actions and Proceedings Law through summary proceedings, split between nonpayment cases and holdover cases for lease violations. A nonpayment case requires a 14 day notice to pay rent or quit before filing, a curable lease violation requires a 10 day notice to cure, and an incurable holdover requires a notice of termination; only a judge can order an eviction, and once a warrant issues it is executed by the Monroe County Sheriff's Civil Bureau, which posts a 14 day notice before carrying out a physical eviction, according to guidance compiled by iPropertyManagement and by the Rochester based Bost Legal Group. An active local tenant advocacy organization, the City-Wide Tenant Union of Rochester, also publishes know your rights materials and organizes tenants, a sign of an increasingly organized renter constituency in city politics.
For an investor, the regulatory conclusion is mixed. Rochester is meaningfully more landlord friendly on rent setting than New York City, and the judicial eviction process, while slower and more procedurally involved than in states like Texas, is predictable and well documented. But the Good Cause Eviction Law is a real and binding constraint on rent growth for existing tenancies, one that did not exist in the Rochester market before April 2024, and any underwriting model should assume rent increases on renewing tenants will be scrutinized against the statutory presumption rather than set purely at the landlord's discretion.
Section 15Infrastructure
Rochester's infrastructure reflects its history as a nineteenth and twentieth century industrial and canal city, now repurposed to support a healthcare, education, and advanced manufacturing economy. The Genesee River runs directly through downtown Rochester, dropping over the High Falls waterfall within the city itself, a defining physical feature that both anchors downtown redevelopment efforts, including the city's ROC the Riverway initiative, and contributes to the flood risk discussed in the next section. The region is served by the Frederick Douglass Greater Rochester International Airport and by an interstate network including Interstate 490, Interstate 390, and Interstate 590, along with proximity to the New York State Thruway, Interstate 90, which connects Rochester to Buffalo, Syracuse, and Albany along New York's primary east-west corridor. The historic Erie Canal passes just south of the city and remains a recreational and, in places, freight relevant waterway.
Higher education and healthcare infrastructure are the region's most important economic anchors. The University of Rochester and its medical center form the region's largest employment cluster, while the Rochester Institute of Technology adds a second major research university with particular strength in imaging science, engineering, and design, a natural extension of the region's historic optics industry built by Eastman Kodak and Bausch and Lomb. That legacy optics and imaging expertise now underpins the American Institute for Manufacturing Integrated Photonics, a federally supported manufacturing institute headquartered in Rochester that anchors a growing photonics and advanced manufacturing cluster. For an investor, the infrastructure conclusion is that Rochester's university, medical, and photonics anchors generate durable, location specific demand for lab space, medical office, and specialized industrial and flex space near these institutions, even though the region's broader population and consumer base is not expanding.
Section 16Climate and Physical Risks
Physical risk in Rochester is modest by national standards and is the clearest structural advantage the market holds relative to Sun Belt and coastal metros: there is no hurricane exposure, no wildfire exposure, and no significant earthquake risk. The primary physical hazard is inland and lakeshore flooding. Rochester sits at the point where the Genesee River, along with tributaries including Irondequoit Creek, Black Creek, and Oatka Creek, meets Lake Ontario, and FEMA flood zone mapping for the city, available through the City of Rochester's open data portal and the National Flood Hazard Layer, shows the most common designations as Zone AE, the mapped floodplain, and Zone X, minimal risk areas outside the floodplain.
Climate risk analysis compiled by First Street Foundation and reported through the ClimateCheck platform found that approximately 15 percent of buildings in Rochester carry meaningful flood risk. FEMA's National Risk Index estimates Monroe County's annual expected loss from inland flooding at more than 102.6 million dollars, and the county has recorded 817 National Flood Insurance Program claims since 1978, totaling roughly 4.8 million dollars in payouts, according to flood risk data compiled by flood zone research services drawing on FEMA's National Flood Insurance Program records. Lake Ontario itself has experienced several high water events in recent years, including notable flooding along the lakeshore in 2017, 2019, and 2023, which has periodically damaged waterfront properties and infrastructure in the Rochester area, though these events are unrelated to hurricane activity and are driven instead by lake level cycles and heavy regional precipitation.
The investor implications are more modest than in hurricane or wildfire exposed markets but should not be ignored. First, flood zone status should be verified parcel by parcel against current FEMA mapping for any property near the Genesee River, its tributaries, or the Lake Ontario shoreline, since these are the specific areas carrying most of the county's mapped flood risk. Second, while flood insurance costs in Rochester are far lower than in coastal markets, National Flood Insurance Program premiums should still be quoted directly for any parcel in or near a mapped floodplain. Third, the region's winter climate, including significant lake effect snowfall, adds routine maintenance and capital expenditure considerations, such as roof snow load and heating system reliability, that are simply different in kind from the wind and storm surge risks that dominate underwriting in Gulf Coast and Atlantic Coast metros. On balance, Rochester's physical risk profile is a genuine advantage for an investor prioritizing insurability and long-term physical durability over rapid appreciation.
Section 17Neighborhoods and Submarkets
Rochester is a collection of distinct city neighborhoods and suburban towns, and capital is concentrating unevenly among them. Downtown Rochester is the most dynamic submarket in the metro: the Rochester Business Journal reported in June 2026 that downtown's residential population surpassed 10,000 for the first time, supported by total downtown investment that rose from 491 million dollars in the 2024 to 2025 period to 625 million dollars in the 2025 to 2026 period, much of it flowing into office to residential conversions such as Tower280, The Metropolitan, and Innovation Square. Park Avenue, just east of downtown, is described by local listing data as a walkable urban village lined with a mile of restaurants and coffee shops, with a median listing price of approximately 223,000 dollars, while the South Wedge neighborhood, a mile south of downtown along the Genesee River near Highland Hospital, is a historic, colorfully painted district that draws families, young professionals, and investors, with local listing data putting its median real estate price at approximately 343,211 dollars, a level reflecting current asking prices in its more renovated pockets rather than the neighborhood's full housing stock. East Avenue, further east, is known for grand historic mansions and commands some of the city's highest values, and North Winton Village is frequently cited by local brokers as an emerging neighborhood attracting rising investor interest.
Beyond city limits, the suburban towns vary sharply in tax burden and price point, which matters directly for underwriting given the tax data discussed above. Irondequoit, directly northeast of the city along the Lake Ontario shore, carries the county's lowest effective property tax rate at approximately 1.43 percent, while Gates, to the west, carries the highest at approximately 3.45 percent. Penfield, home to Paychex's headquarters, and Henrietta, home to the Rochester Institute of Technology, are significant suburban employment nodes in their own right, while Brighton and Pittsford are generally regarded as the region's more affluent residential suburbs. The submarket conclusion for an investor is that downtown offers the strongest momentum and the deepest pipeline of institutional and public capital, that walkable city neighborhoods like Park Avenue and South Wedge offer rental demand tied to the region's university and young professional population, and that suburban town selection should be filtered explicitly through each municipality's effective property tax rate rather than assumed to be uniform across the county.
Section 18Opportunities
The clearest opportunity in Rochester is the downtown office to residential conversion wave and the broader multifamily development pipeline that supports it. With more than 4,200 rental units started or completed citywide since 2022, more than 2 billion dollars in combined investment according to the Rochester Beacon, and downtown's residential population having just crossed 10,000 residents, per the Rochester Business Journal, Rochester offers an unusually well capitalized and publicly supported pathway for investors willing to participate in adaptive reuse projects, particularly given the persistent overhang in older Class B and C office towers that are increasingly uneconomical to operate as office space. A second opportunity lies in industrial and flex space: with vacancy in the 4 to 6 percent range across multiple sources and high construction costs constraining new competitive supply, existing well located industrial assets, particularly those tied to the region's advanced manufacturing and photonics cluster, offer a favorable supply and demand balance.
A third opportunity is workforce and single family rental housing in the city itself, where a homeownership rate of only 38.1 percent, combined with home values that remain low in absolute terms even after recent appreciation, per Zillow and Rochester Beacon data, supports a large and durable renter pool. Finally, Rochester's genuinely low exposure to hurricane, wildfire, and major flood catastrophe risk, discussed above, is itself an opportunity for investors specifically seeking to diversify a portfolio concentrated in higher physical risk Sun Belt or coastal markets, since Rochester's insurance cost trajectory, while rising, starts from and is likely to remain at a much lower absolute base than markets facing recurring catastrophic weather losses.
Section 19Risks
The risks in Rochester are equally concrete and should be weighed carefully against the opportunities above. The first and most fundamental is demographic: the metro's population has been essentially flat to slightly declining for years, with Monroe County losing population from 759,443 in 2020 to an estimated 750,506 in 2025, and the city of Rochester following a similar downward path, according to Census Bureau data. A market without population growth caps the ceiling on organic rent and value growth, and any strategy dependent on rising demand from net in migration is not supported by the current trend.
The second risk is the tax and regulatory burden. Monroe County's median effective property tax rate of approximately 2.44 percent, more than double the national median, is layered on top of a New York State personal income tax with a top rate of 10.9 percent, a combination that erodes net returns more than in no-income-tax states, and the city's adoption of the Good Cause Eviction Law constrains a landlord's ability to raise rents on sitting tenants without documented cost justification. The third risk is insurance cost trajectory: while absolute premiums remain low, the 10 to 12 percent annual increases reported across upstate New York, and individual cases of premium increases as high as 300 percent even absent claims, indicate an insurance market repricing broadly rather than only in response to local events, a trend that could compress margins over a multi year hold even without any single catastrophic loss. Fourth, Rochester's income divide, with a city median household income of $46,882 against a county figure of $76,520, means that more than half of city renter households are already cost burdened, limiting the room for further rent increases in the urban core without pushing more tenants past affordability thresholds. Finally, much of the city's visible development activity depends on public subsidy and tax credit financing rather than pure market rate economics, which means the pace of new supply, and by extension future vacancy and rent trajectories, is partly a function of state and federal housing policy and funding cycles, including time limited programs such as American Rescue Plan Act dollars that are set to expire, rather than of private market signals alone.
Section 20Investor Implications
For an investor evaluating Rochester, the evidence supports a cautious, income focused stance rather than an aggressive growth stance. The demand backdrop is not the driver of returns here: population and employment are essentially flat, and no data reviewed in this report suggests that is likely to change meaningfully in the near term. What Rochester offers instead is a small, structurally undersupplied apartment market with vacancy in the mid single digits across multiple data sources, a downtown that is genuinely repopulating through a well capitalized, publicly supported conversion pipeline, an industrial sector with very low vacancy, and some of the lowest absolute rents and home prices among mid sized metros in the country, all sitting on top of a physical risk profile that is materially safer than hurricane, wildfire, or major flood exposed markets.
The discipline required is squarely in underwriting costs rather than chasing growth. Every Rochester deal should carry an explicit, municipality specific property tax assumption, given the wide range from Irondequoit's roughly 1.43 percent effective rate to Gates's roughly 3.45 percent, an insurance cost model that assumes continued annual increases in the high single to low double digit percentage range even without local catastrophe, and a rent growth assumption calibrated to the Good Cause Eviction Law's rent increase presumption of the lower of 5 percent plus regional Consumer Price Index or 10 percent, rather than to whatever the local market might otherwise bear. Return expectations should be built on stable occupancy, expense discipline, and the low but durable rent growth documented above, not on population driven demand growth or aggressive appreciation. Investors who value low physical catastrophe risk, genuine affordability, and durable healthcare, education, and advanced manufacturing employment anchors, and who are willing to underwrite New York's tax and regulatory environment honestly rather than assume it away, will find Rochester a defensible, if unglamorous, addition to a diversified real estate portfolio.
Section 21Conclusion
Rochester at the close of summer 2026 is a small, stable, slow growing metro whose real estate markets reward patient, cost disciplined capital rather than growth chasing capital. Population and jobs are essentially flat, but the apartment market is nonetheless tightening from a low, never overbuilt base, downtown has crossed 10,000 residents through an unusually well funded wave of office to residential conversion, industrial space remains genuinely scarce, and home values, while still low in absolute terms, are appreciating steadily. Against this sit two Rochester specific headwinds that an investor must underwrite explicitly: a property tax burden more than double the national median, layered on top of a state income tax that no-income-tax states do not impose, and a fast rising insurance market, alongside New York's Good Cause Eviction Law, which now caps how freely rents can be raised on sitting tenants in the city. Rochester's genuine advantage is a physical risk profile largely free of hurricane, wildfire, and major catastrophe exposure, combined with deep affordability and durable healthcare, education, and advanced manufacturing employment anchors. The market rewards investors who accept modest growth in exchange for low volatility and who price New York's tax and regulatory costs with the same rigor that a Sun Belt investor prices hurricane and flood risk.
Sources
- U.S. Census Bureau, Annual Estimates of the Population of Metropolitan and Micropolitan Statistical Areas, via Federal Reserve Bank of St. Louis, updated March 2026, https://fred.stlouisfed.org/series/ROHPOP
- Rochester Beacon, Rochester, Monroe County see pandemic population loss, https://rochesterbeacon.com/2024/05/21/rochester-monroe-county-see-pandemic-population-loss/
- Rochester Beacon, Monroe County lost population during pandemic, https://rochesterbeacon.com/2023/04/03/monroe-county-lost-population-during-pandemic/
- U.S. Census Bureau QuickFacts, Rochester city, New York, https://www.census.gov/quickfacts/fact/table/rochestercitynewyork
- Census Reporter, Rochester city, Monroe County, NY profile (ACS data), http://censusreporter.org/profiles/06000US3605563000-rochester-city-monroe-county-ny/
- Neilsberg, Monroe County, NY Income Statistics to Know in 2024, https://www.neilsberg.com/insights/topic/monroe-county-ny-income/
- ACT Rochester, Median Household Income, https://www.actrochester.org/median-household-income
- Federal Reserve Bank of St. Louis, Estimate of Median Household Income for Monroe County, NY, https://fred.stlouisfed.org/series/MHINY36055A052NCEN
- U.S. Bureau of Labor Statistics, Rochester, NY Area Economic Summary, updated July 1, 2026, https://www.bls.gov/regions/northeast/summary/blssummary_rochester_ny.pdf
- Federal Reserve Bank of St. Louis, All Employees: Total Nonfarm in Rochester, NY (MSA), https://fred.stlouisfed.org/series/ROCH336NA
- Federal Reserve Bank of St. Louis, Unemployment Rate in Rochester, NY (MSA), https://fred.stlouisfed.org/series/ROCH336URN
- Rochester Beacon, URMC tops local employers on Forbes list, https://rochesterbeacon.com/2023/09/13/urmc-tops-local-employers-on-forbes-list/
- Greater Rochester Chamber of Commerce, Regional Economy Overview, https://www.greaterrochesterchamber.com/about-us/regional-economy-overview/
- HUD USER, Market at a Glance, Rochester, NY, https://www.huduser.gov/portal/MCCharts/php/pdf/364038.pdf
- Apartment Loan Store, CAP Rates for Apartment/Multifamily Properties in Rochester, New York, https://apartmentloanstore.com/rochester/new-york/cap-rate
- HUD USER, Fair Market Rents, Rochester, NY HUD Metro FMR Area, FY2026, https://www.huduser.gov/portal/datasets/fmr.html
- Rochester Beacon, Rochester's housing gap, https://rochesterbeacon.com/2026/07/09/rochesters-housing-gap/
- WXXI News, Rochester leads upstate NY in affordable housing construction, https://www.wxxinews.org/local-news/2026-02-09/rochester-leads-upstate-ny-in-affordable-housing-construction-yet-the-need-persists
- Rochester Business Journal, Downtown Rochester passes 10K residents; housing demand up, https://rbj.net/2026/06/10/downtown-rochester-housing-demand-surpasses-10000-residents/
- Rochester Business Journal, Rochester CRE market stays stable despite interest rate concerns, https://rbj.net/2026/05/06/rochester-commercial-real-estate-market-stable-interest-rates/
- New York State Homes and Community Renewal, Governor Hochul Announces $72.3 Million Affordable Housing Project in Rochester, https://hcr.ny.gov/news/governor-hochul-announces-723-million-affordable-housing-project-rochester
- Zillow, Rochester, NY Housing Market, https://www.zillow.com/home-values/832063/rochester-ny/
- CBRE, Rochester Industrial Figures, Q2 2025, https://www.cbre.com/insights/figures
- TenantBase, Rochester Commercial Real Estate Market Report, Q2 2026, https://www.tenantbase.com/rochester/q2-2026/
- Monroe County, NY, 2026 Town and County Tax Rates, https://www.monroecounty.gov/property-town-rates
- New York State Department of Taxation and Finance, equalization rates and residential assessment ratios, https://www.tax.ny.gov/research/property/assess/eqratecounty.htm
- Rochester Real Estate Blog, Property Taxes in Rochester and Monroe County, NY, https://rochesterrealestateblog.com/blog/property-taxes-rochester-monroe-county-ny
- TaxByCounty, New York Property Tax Rates by County, https://taxbycounty.com/new-york
- NerdWallet, New York State Income Tax Rates and Brackets, https://www.nerdwallet.com/taxes/learn/new-york-state-tax
- Insurify, Best Homeowners Insurance in Rochester, https://insurify.com/homeowners-insurance/new-york/rochester/
- RochesterFirst, Home insurance rates on the rise in New York, https://www.rochesterfirst.com/new-york-state/home-insurance-rates-on-the-rise-in-new-york/
- Vooma Insurance Agency, Why Are Homeowners Insurance Rates Rising in New York, https://www.voomainsurance.com/why-are-homeowners-insurance-rates-rising-in-new-york-and-what-you-can-do-about-it/
- New York State Office of the Attorney General, New York State Good Cause Eviction Law, https://ag.ny.gov/publications/new-york-state-good-cause-eviction-law
- Harris Beach Murtha, Good Cause Eviction Law passed in the City of Rochester, https://www.harrisbeachmurtha.com/insights/good-cause-eviction-law-passed-in-the-city-of-rochester/
- Legal Survival, Rochester Passes Good Cause Eviction Law Protections, https://www.legalsurvival.com/rochester-passes-good-cause-eviction-law-protections/
- iPropertyManagement, New York Eviction Process, https://ipropertymanagement.com/laws/new-york-eviction-process
- Bost Legal Group, Guide To Navigating Evictions In Rochester NY, https://bostlegalgroup.com/guide-to-navigating-evictions-in-rochester/
- City-Wide Tenant Union of Rochester, Know Your Rights, https://roctenantunion.org/tenantrights
- City of Rochester Open Data, FEMA National Flood Hazard Layer and Flood Hazard Zones, https://data.cityofrochester.gov/maps/RochesterNY::flood-hazard-zones
- ClimateCheck, Rochester, New York Climate Change Risks and Hazards, https://climatecheck.com/newyork/rochester
- First Street Foundation, Rochester, NY Flood Map and Climate Risk Report, https://firststreet.org/city/rochester-ny/3663000_fsid/flood
- NOAA National Water Prediction Service, Genesee River at Rochester gauge, https://water.noaa.gov/gauges/rhrn6
- Trulia, Best Neighborhoods in Rochester, NY: A Local Guide, https://www.trulia.com/research/best-neighborhoods-in-rochester-ny/