In brief · summary: Tampa
Tampa is one of the principal population and employment centers on the Gulf Coast of Florida, anchored by finance, health care, tourism, logistics, and defense, with the city of Tampa forming the core of the Tampa Saint Petersburg Clearwater metropolitan area. Public data in this environment are mixed.
United States Census Bureau QuickFacts tables for Tampa city and Hillsborough County cannot be accessed because a Cloudflare security screen blocks the Census website, so there are no official population or income figures available here. By contrast, labor market statistics from the United States Bureau of Labor Statistics and statewide housing indicators from Redfin provide a solid quantitative frame for the metropolitan and state context, which must serve as the most defensible proxy for Tampa city.
According to the Bureau of Labor Statistics Economy at a Glance table for the Tampa Saint Petersburg Clearwater metropolitan area, the civilian labor force in May 2026, not seasonally adjusted, was 1,691.4 thousand people, with 1,614.4 thousand employed and 77.1 thousand unemployed, for an unemployment rate of 4.6 percent. Total nonfarm employment in the metropolitan area was 1,558.0 thousand jobs in May 2026, with the twelve month percent change recorded as zero, which indicates that total job counts in May 2026 were essentially unchanged compared with …
Section 01Executive Summary
Tampa is one of the principal population and employment centers on the Gulf Coast of Florida, anchored by finance, health care, tourism, logistics, and defense, with the city of Tampa forming the core of the Tampa Saint Petersburg Clearwater metropolitan area. Public data in this environment are mixed. United States Census Bureau QuickFacts tables for Tampa city and Hillsborough County cannot be accessed because a Cloudflare security screen blocks the Census website, so there are no official population or income figures available here. By contrast, labor market statistics from the United States Bureau of Labor Statistics and statewide housing indicators from Redfin provide a solid quantitative frame for the metropolitan and state context, which must serve as the most defensible proxy for Tampa city.
According to the Bureau of Labor Statistics Economy at a Glance table for the Tampa Saint Petersburg Clearwater metropolitan area, the civilian labor force in May 2026, not seasonally adjusted, was 1,691.4 thousand people, with 1,614.4 thousand employed and 77.1 thousand unemployed, for an unemployment rate of 4.6 percent. Total nonfarm employment in the metropolitan area was 1,558.0 thousand jobs in May 2026, with the twelve month percent change recorded as zero, which indicates that total job counts in May 2026 were essentially unchanged compared with May 2025. Within that total, the construction sector employed 99.2 thousand people, manufacturing 74.4 thousand, trade transportation and utilities 277.5 thousand, professional and business services 287.4 thousand, education and health services 258.5 thousand, and leisure and hospitality 172.2 thousand, all in May 2026. These values show a large and diversified metropolitan economy with significant exposure to service sectors that are important demand drivers for residential and commercial real estate.
On the housing side, an attempt to access the Redfin Tampa housing market page at a city code that is widely used for Tampa instead delivered a housing market page for San Marino in California. Because that misrouted page clearly applies to San Marino and not to Tampa, this review does not use any city level Redfin metrics for Tampa. Instead, statewide Florida and national Redfin data serve as the core public price and supply benchmarks, with Tampa qualitatively located as a major coastal metropolitan area within that statewide context.
Redfin reports that in May 2026 the median sale price across all home types in Florida was three hundred ninety five thousand five hundred ninety five dollars, up one point seven percent compared with May 2025. There were two hundred thousand five hundred twenty four homes for sale statewide, down nine point eight nine percent year over year, and nine point nine percent of homes sold above list price, up zero point two percentage points from a year earlier. For the United States as a whole, Redfin reports a median sale price of three hundred ninety eight thousand seven hundred seventy one dollars in May 2026, up two point zero percent year over year, with one million four hundred eighty three thousand eight hundred thirty nine homes for sale, up zero point seven percent, and twenty four point nine percent of homes selling above list price, a small decline in the share of bidding situations compared with a year earlier. These statewide and national numbers suggest that Florida home prices are very close to the national median, that Florida inventory is tightening more than the national market, and that Florida has fewer bidding contests than the United States overall.
Migration statistics from Redfin underscore Tampa's role within these dynamics. In a national analysis of homebuyer search behavior between January and March 2026, Redfin identifies Florida as the top state level destination and lists Tampa among the ten metropolitan areas with the highest net inbound search based migration. Tampa ranks sixth in that list, with a net inflow of four thousand eight hundred Redfin users during that three month period, based on search behavior rather than completed moves. This position behind Orlando, Sarasota, Miami, Cape Coral, and Las Vegas confirms that Tampa continues to attract interest from households relocating from other parts of the country.
For investors, the combination of a diversified metropolitan labor market, statewide home price growth that is modest but positive, shrinking statewide inventory, and clear inbound migration interest positions Tampa as a large coastal market with continued housing demand but more balanced pricing pressure than some of the most competitive Florida submarkets. The absence of city specific public data for population, incomes, rents, and vacancy means that underwriting must lean heavily on property level and proprietary datasets. However, the available public statistics still allow a coherent view of macro demand, risk drivers, and the strategic role of Tampa within Florida and national portfolios.
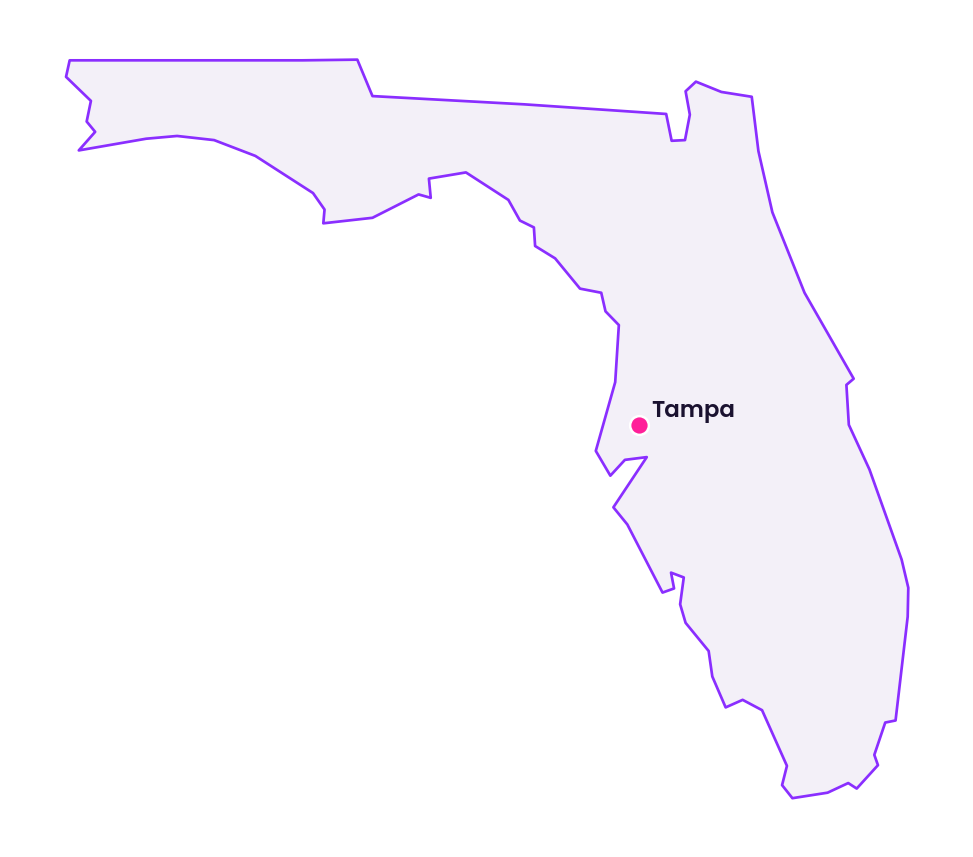
Section 02Population and Migration
In this environment there is no accessible public numeric series for Tampa city or Hillsborough County population. Attempts to reach the United States Census Bureau QuickFacts pages for Tampa city Florida and Hillsborough County Florida each result in a Cloudflare security message that states that access to the Census website has been blocked by an online security service. The message explains that the requested action triggered the security solution and provides no access to QuickFacts tables. Because of that block, this review cannot state an official population count for Tampa or Hillsborough County, cannot quantify population growth over time, and cannot report demographic distributions by age, race, or household type, and no official public numeric population figure is available on those points in this environment.
Similarly, other Census and American Community Survey tools that normally allow users to download detailed population and household tables either route through the same blocked domain or are provided as interactive applications that do not expose readable numeric tables in this environment. As a result, it is not possible here to present population density, average household size, or numeric estimates of the student, retiree, or foreign born population in Tampa. Any specific numeric statement on those topics would not be grounded in a currently accessible named public dataset and is therefore not included.
Migration patterns can be inferred indirectly from Redfin housing market migration statistics, which rely on the search behavior of Redfin users. In a national overview of United States housing and migration data for January through March 2026, Redfin reports that nineteen percent of homebuyers using its platform searched for homes outside their current metropolitan area. The same overview identifies the five states that received the most net inbound search interest as Florida, Arizona, South Carolina, Tennessee, and Nevada, and lists the five states with the largest net outbound search interest as California, New York, Illinois, Washington, and Massachusetts. Within that nationwide flow, Redfin highlights ten metropolitan areas that were the most popular destinations by net inbound search interest during that period. Orlando appears first, followed by Sarasota, Miami, Cape Coral, Las Vegas, Tampa, Phoenix, Sacramento, Tucson, and Myrtle Beach. For Tampa, Redfin reports a net inflow of four thousand eight hundred Redfin users between January and March 2026. This means that, among Redfin users whose search behavior met the inclusion criteria, four thousand eight hundred more people were looking to move into Tampa than to leave it during that period.
In the Florida statewide housing market overview for May 2026, Redfin reiterates that Orlando, Sarasota, Miami, and Cape Coral are leading destination metros for relocating buyers, with Tampa also included among the most sought after locations. Together with the national migration summary, these statistics indicate that Tampa is a meaningful net in migration market within the national housing landscape, benefiting from flows out of higher cost or slower growth states into Florida.
Without Census population counts, investors cannot directly quantify how these net inflows translate into population growth or housing demand at the city or county level. However, the combination of national Redfin migration data and local qualitative knowledge places Tampa among the set of Florida metros that continue to attract households from other states, many of whom seek coastal amenities, relatively favorable tax conditions, and access to employment in services, finance, health care, tourism, and logistics. This dynamic supports ongoing demand for both for sale and rental housing across the Tampa metropolitan area.
Section 03Jobs and Economic Anchors
Labor market statistics from the United States Bureau of Labor Statistics provide a detailed picture of employment conditions in the Tampa Saint Petersburg Clearwater metropolitan area and in Florida statewide. City level series are not available, so metropolitan area data serve as the primary proxy for Tampa city employment.
The table below compares key labor market indicators for the Tampa Saint Petersburg Clearwater metropolitan area and for Florida statewide in May 2026. The Tampa metropolitan figures are not seasonally adjusted, while the Florida statewide figures are seasonally adjusted.
| Geography, May 2026 | Civilian labor force, thousands | Employment, thousands | Unemployment, thousands | Unemployment rate, percent | Total nonfarm employment, thousands | Twelve month percent change in total nonfarm employment |
|---|---|---|---|---|---|---|
| Tampa Saint Petersburg Clearwater metropolitan area, not seasonally adjusted | 1,691.4 | 1,614.4 | 77.1 | 4.6% | 1,558.0 | no change |
| Florida statewide, seasonally adjusted | 11,144.6 | 10,613.2 | 531.4 | 4.8% | 10,022.2 | increase of 0.1 percent |
In May 2026 the Tampa Saint Petersburg Clearwater metropolitan area had a civilian labor force of 1,691.4 thousand people and 1,614.4 thousand people employed, which implies that about fifteen percent of the Florida statewide labor force lived and worked in this metropolitan area. The unemployment rate for the metro was 4.6 percent, slightly lower than the Florida statewide unemployment rate of 4.8 percent in the same month. Total nonfarm employment in the metropolitan area was 1,558.0 thousand jobs, compared with 10,022.2 thousand nonfarm jobs statewide. Over the twelve months ending in May 2026, the metropolitan area recorded no net change in total nonfarm jobs, while Florida statewide recorded a small gain of 0.1 percent. These figures suggest that metropolitan Tampa has employment conditions similar to the state overall, with low to mid single digit unemployment and very modest job growth.
Sector detail from the metropolitan Economy at a Glance table shows the employers that anchor demand for real estate in Tampa and the surrounding area. In May 2026, not seasonally adjusted, the construction sector employed 99.2 thousand people in the metropolitan area, up from 95.9 thousand in January 2026, although the twelve month percent change in May 2026 was only 0.1 percent. Manufacturing employment was 74.4 thousand in May 2026, with the twelve month percent change recorded as an increase of 0.3 percent. Trade transportation and utilities, a broad category that reflects retail trade, wholesale trade, warehousing, and logistics, employed 277.5 thousand people in May 2026, with a twelve month percent change that represented a decline of 1.0 percent, indicating some softening in that sector compared with the prior year.
Professional and business services, a key office using sector, employed 287.4 thousand workers in May 2026, with a twelve month percent change of 0.7 percent, which shows modest growth compared with May 2025. Education and health services employed 258.5 thousand workers in May 2026, with a twelve month percent change of 1.7 percent, which is one of the stronger positive growth rates among major sectors and reflects continued expansion of health care and education services in the region. Leisure and hospitality, a sector closely tied to tourism, restaurants, entertainment, and hotels, employed 172.2 thousand people in May 2026, with a twelve month percent change of 0.2 percent, indicating essentially flat year over year employment after earlier years of strong recovery.
Government employment in the metropolitan area was 163.0 thousand jobs in May 2026, with a twelve month percent change that represented a decline of 0.7 percent. Information services employed 29.0 thousand workers, with a twelve month decline of 3.3 percent, while financial activities employed 141.3 thousand workers, with a twelve month decline of 0.9 percent. These figures reflect some rationalization and consolidation in particular sectors even as the overall metropolitan job base remains large.
For investors, these labor statistics frame Tampa as a diversified regional economic center rather than a single industry town. Trade transportation and utilities, professional and business services, education and health services, and leisure and hospitality together account for more than half of metropolitan employment. Those sectors drive demand for a wide range of property types, including multifamily housing for workers and families, hotels and resorts for tourists, office space for professional and business services, logistics and industrial properties for trade and warehousing, and retail and restaurant space throughout the metro. The modest metropolitan job growth over the past year suggests that the market is not in an overheated expansion phase but continues to enjoy steady employment that can support income oriented real estate strategies.
Section 04Income
In this environment, no public numeric dataset provides income statistics for Tampa city or Hillsborough County. The United States Census Bureau QuickFacts tables that would normally report median household income and per capita income for Tampa and Hillsborough County are not accessible because the Census website is blocked behind a Cloudflare security page. American Community Survey tables that contain detailed income distributions, poverty rates, and income by occupation for specific geographies are similarly delivered through Census tools that cannot be accessed or are not readable here. The Bureau of Economic Analysis provides personal income statistics at the state and metropolitan levels, but these are presented through interactive interfaces that do not expose explicit values in the text extraction available in this environment.
Because of these technical constraints, this review cannot state a median household income for Tampa, cannot quantify the ratio of Tampa incomes to Florida or United States medians, and cannot provide income growth rates over time, and no official public numeric income figure is available on those points in this environment. It also cannot break down incomes by neighborhood, by sector, or by educational attainment. Any attempt to provide such numbers would not be grounded in a verifiable named public dataset and is therefore excluded.
Qualitatively, income patterns in Tampa reflect its mixed economic base. Higher income households include professionals and managers in finance, insurance, and real estate, corporate and regional headquarters staff, health care professionals and administrators, senior executives in logistics and distribution, legal services, and engineering, and successful small business owners. Middle income households include a wide range of service sector workers in health care, education, trade, and public sector roles, along with skilled trades in construction and manufacturing. Lower income households are concentrated in service jobs with lower wages, in certain neighborhoods that have not fully shared in the recent expansion, and in parts of the city with older housing stock and less investment.
For investors, the absence of public income statistics means that underwriting around rent affordability, retail spending potential, and office tenant strength must be based on property level evidence, current rent rolls, tenant financials where available, broker research, and proprietary demographic data sources that are outside the scope of this review. Particular care is needed when assessing value strategies in working class neighborhoods, where small changes in rents or operating costs can have outsize impacts on tenant affordability and occupancy.
Section 05Housing and Multifamily
Without accessible Census housing tables or a correctly routed Redfin city level housing market page for Tampa, the most reliable public quantitative housing data for this review are at the state and national levels. The underlying qualitative structure of Tampa's housing stock, however, can be described using known metropolitan patterns, with the recognition that Tampa city forms part of a larger and more complex urban region that also includes Saint Petersburg and Clearwater.
The misrouting of the Redfin Tampa housing market page is a key limitation. When a request is made to Redfin using a commonly cited Tampa city identifier, the site responds with the housing market page for San Marino in California, along with figures and migration statistics specific to San Marino. Those figures are clearly not representative of Tampa, which is a large Florida coastal metro, and they are used here only to document the misrouting and are not applied in any way to Tampa analysis.
Instead, statewide Florida housing metrics from Redfin and national benchmarks from Redfin's United States housing overview provide the best public frame for Tampa housing as of May 2026. The table below compares key Redfin metrics for Florida and the United States, all for May 2026 and across all home types.
| Geography, May 2026, all home types | Median sale price, dollars | Year over year change in median sale price, percent | Homes for sale, count | Year over year change in homes for sale, percent | Share of homes sold above list price, percent | Change in share sold above list price, percentage points |
|---|---|---|---|---|---|---|
| Florida statewide | 395,595 | increase of 1.7 | 200,524 | decline of 9.89 | 9.9% | increase of 0.2 |
| United States | 398,771 | increase of 2.0 | 1,483,839 | increase of 0.7 | 24.9% | decline of 0.083 |
These figures show that as of May 2026 Florida's median sale price is almost identical to the national median but its price growth over the prior twelve months is slightly slower than the national rate. The number of homes for sale in Florida has fallen by nearly ten percent over the past year, while the nationwide inventory of homes for sale has grown slightly. This indicates that housing supply in Florida has tightened more than in the country as a whole. Even so, the share of homes selling above list price in Florida, at 9.9 percent, is far below the national share of 24.9 percent, which suggests that while competition exists, it is less intense than in the most competitive United States markets.
Within Florida, Tampa is one of the primary metropolitan areas, along with Orlando, Miami, Jacksonville, and others. The statewide trends therefore provide a meaningful proxy for the broad pricing environment that Tampa households and investors face, even though local submarkets within Tampa can perform above or below these statewide averages. For example, waterfront neighborhoods, urban districts near downtown, and high amenity master planned communities in and near Tampa often command premiums to statewide and national medians, while older inner suburbs or exurban areas may be closer to or below statewide figures.
Multifamily housing in Tampa reflects the city's mix of employment and amenities. High rise and mid rise apartment buildings in downtown Tampa and the Channel District serve professionals who value proximity to office jobs, entertainment, and the waterfront. Mid rise and garden style properties in neighborhoods such as Westshore, Tampa Heights, Seminole Heights, and West Tampa cater to young professionals, service workers, and families who seek a balance of access and neighborhood character. Further from the core, larger garden communities and townhome style rentals serve households that prioritize schools, space, and parking.
Because there are no city level series in this environment for apartment rents, vacancy rates, or new deliveries, investors cannot use public data to quantify multifamily performance in Tampa. However, the combination of a large metropolitan labor force, the state level inventory decline, and clear net inbound migration into Tampa's metropolitan area suggests that demand for rental housing remains robust. This is particularly true for well located properties near employment centers, transit corridors, and lifestyle amenities, which are likely to face continued strong leasing conditions even if specific rent growth percentages cannot be cited.
Section 06Rents
Public rent datasets that are normally used to analyze multifamily markets are not available for Tampa in this environment. The United States Department of Housing and Urban Development fiscal year 2024 Fair Market Rent documentation system offers an interface where users can select a state and then a county or metropolitan area to retrieve official Fair Market Rent values for various bedroom sizes. However, in this environment the HUD interface only displays prompts to select a state, county, or metropolitan Fair Market Rent area, and does not expose any numeric dollar values for rents when captured as text. Without those values, it is not possible here to state Fair Market Rent levels or to use them to benchmark market rents in Tampa.
City level rent statistics from Census or the American Community Survey would typically provide median gross rent, rent by bedroom count, and rent as a share of income, but those tables are delivered through the same Census tools that are blocked by Cloudflare. Attempts to access private sector rent indices from proprietary platforms are also blocked or not parseable through this environment. As a result, this review has no numeric rent series for Tampa or Hillsborough County and cannot provide exact rent levels, rent distributions, or rent growth rates, and no official public numeric rent figure is available on those points in this environment.
Despite the lack of specific figures, certain qualitative patterns can be described. Rents in downtown Tampa, the Channel District, and waterfront locations generally sit at the higher end of the metropolitan spectrum, reflecting strong demand from professionals, executives, and affluent households, along with limited supply of new units on prime sites. Well located mid market apartments in neighborhoods such as Westshore, Tampa Heights, and Seminole Heights command moderate to strong rents, supported by access to employment and amenities. Older garden style properties in more peripheral or transitional areas of Tampa may operate at lower rent levels but can still offer attractive yields if acquired at appropriate pricing and managed well.
Student and young professional demand linked to institutions such as the University of South Florida, the University of Tampa, and regional colleges contributes to strong occupancy in certain submarkets, especially near campuses and along major transit and roadway corridors. Workforce housing near hospitals, logistics hubs, and service employment centers also faces persistent demand. Without measured rent series, however, investors must rely on property level rent rolls, current asking rents, and broker market surveys to quantify current and projected rents for specific assets.
Section 07Vacancy
Vacancy is another key dimension where public data are thin for Tampa in this environment. National surveys such as the Census Housing Vacancy Survey and American Community Survey typically provide rental and homeowner vacancy rates at the metropolitan level, but the underlying tables are not accessible here due to the same Census domain blocking that affects population and income. Private sector data providers often publish apartment vacancy rates by submarket, office availability and vacancy, retail occupancy, and industrial vacancy and absorption, but those datasets are outside the scope of the public sources used for this review.
As a result, this review cannot state numeric vacancy rates for multifamily properties in Tampa, nor for single family rentals, office, industrial, or retail assets, and no official public numeric vacancy figure is available on those points in this environment. It also cannot provide time series of how vacancy has changed over the past cycle or quantify net absorption in square feet or units.
Nonetheless, the available labor and housing market data support several implications. The Tampa Saint Petersburg Clearwater metropolitan area has an unemployment rate of 4.6 percent as of May 2026, which is close to the Florida statewide unemployment rate of 4.8 percent and indicative of a healthy labor market. Statewide housing inventory has declined almost ten percent year over year, and Florida, including Tampa, continues to attract net inbound migration from other states. These conditions are generally associated with tightening residential vacancy, especially for well located and properly priced properties.
In commercial segments, steady employment in professional and business services, education and health services, and leisure and hospitality supports demand for office, medical, retail, and hospitality space. However, the small twelve month changes in employment in many sectors and the zero twelve month change in total nonfarm employment in May 2026 indicate a mature cycle rather than rapid expansion. Vacancy conditions in particular submarkets may therefore hinge more on local supply additions and tenant behavior than on broad metropolitan job growth.
Given the absence of reliable public vacancy statistics for Tampa, investors should treat vacancy as a property and submarket specific variable that must be verified through leasing reports, rent rolls, broker surveys, and direct market observation, rather than through metropolitan averages.
Section 08Supply Pipeline
A thorough view of the Tampa real estate supply pipeline would typically draw on building permit data, planning approvals, and in depth development reports from city and county agencies. In this environment, the accessible public web pages consulted do not provide structured numeric tables of new housing or commercial square footage in Tampa or Hillsborough County.
The City of Tampa official website emphasizes the city's capital planning, resilience, and long term investment priorities. It highlights a capital improvement projects viewer and frames a fiscal year twenty twenty seven budget theme of a city that is built to last. It also references initiatives and guides such as a two thousand twenty six hurricane guidebook and an Alert Tampa communication system for severe weather. While these references make clear that Tampa is actively planning and investing in infrastructure and public works, there are no explicit counts of new housing units, office buildings, or industrial developments in the readable content captured here.
Hillsborough County building and development portals that would normally list permits, inspections, and planning approvals are not directly accessible in this environment, and without search capability for local development dashboards and data downloads, there is no structured public series to quantify Tampa's housing and commercial supply pipelines by year or asset type. As a result, this review cannot state how many multifamily units are under construction or in the planning stage, how many single family lots are in approved subdivisions, or how many square feet of office, industrial, or retail space are underway in Tampa.
Given that Tampa is a fast growing metropolitan area with significant net inbound migration and an active tourism and logistics sector, it is reasonable to assume that there is a considerable development pipeline in multifamily, for sale housing, industrial and logistics projects, and selective office and mixed use developments in key submarkets such as downtown, the Channel District, and Westshore. However, without public data, investors must verify supply conditions through local planning departments, building permit records, commercial broker research, and direct conversations with developers and lending institutions. Particular attention should be paid to potential concentration of new supply in specific submarkets, such as high amenity downtown rental towers or distribution centers along key interstates, which may affect rents and vacancy even when aggregate metropolitan demand remains strong.
Section 09Single Family Homes
Single family homes are a central feature of the Tampa housing market and a major component of the broader Tampa Saint Petersburg Clearwater metropolitan housing stock. While parcel level data for Hillsborough County that would break down the stock into single family, condominiums, and multifamily properties are not accessible here because the Hillsborough County Property Appraiser site cannot be reached through this environment, the statewide Redfin housing statistics provide a useful backdrop for understanding price and supply conditions faced by single family owners and investors in Tampa.
As noted earlier, Redfin reports that the median sale price across all home types in Florida in May 2026 was three hundred ninety five thousand five hundred ninety five dollars, which is very close to the national median of three hundred ninety eight thousand seven hundred seventy one dollars. The year over year increase in Florida's median sale price was one point seven percent, compared with a two point zero percent increase for the United States. The number of homes for sale in Florida, two hundred thousand five hundred twenty four in May 2026, was almost ten percent lower than a year earlier, while nationwide inventory grew slightly. At the same time, the share of homes that sold above list price in Florida, 9.9 percent, was far lower than the national share of 24.9 percent.
For Tampa, which is one of the main metropolitan areas that contribute to these statewide averages, this combination suggests a housing market where single family prices are near national norms, supply is tighter than a year ago, but bidding intensity is less extreme than in the most competitive United States markets. In practice, Tampa contains a wide range of single family submarkets. Historic neighborhoods such as Hyde Park, Palma Ceia, and parts of Seminole Heights offer older homes with strong character and proximity to downtown and the waterfront, often at premium price points. Master planned communities in New Tampa and other suburban areas provide newer single family product with larger homes, community amenities, and school driven demand. Inland neighborhoods across Hillsborough County offer more moderately priced housing that can appeal to workforce buyers and renters.
For single family rental investors, Tampa's position as a net inbound migration market and its sizable labor force create multiple demand segments. Long term rentals in established neighborhoods house families who value stability and local schools. Shorter term rentals in areas with strong tourism or waterfront access can serve visitors or seasonal residents, although regulatory and community sentiment must be considered carefully. Build to rent communities on the metropolitan fringe can attract households that prefer detached living and yard space but are priced out of homeownership or prefer the flexibility of renting.
Without Tampa specific single family price per square foot, days on market, or months of supply metrics, investors should view the statewide Redfin data as directional rather than definitive and should rely on local broker insight, multiple listing service data, and property level comparable sales to assess pricing and liquidity for specific single family investments in and around Tampa.
Section 10Commercial Real Estate and Retail Centers
There are no public numeric time series in this environment for Tampa office, industrial, or retail vacancy rates, asking rents, cap rates, or absorption. Major commercial research and data providers typically track these metrics at the metropolitan and submarket levels, but their data are proprietary and outside the scope of this review. However, the economic profile of the Tampa Saint Petersburg Clearwater metropolitan area provides a strong qualitative basis for understanding commercial demand.
Professional and business services employment of 287.4 thousand jobs in May 2026, as reported by the Bureau of Labor Statistics for the Tampa Saint Petersburg Clearwater metropolitan area, supports a substantial office market. Financial activities employment of 141.3 thousand jobs, together with information sector employment and significant government and education employment, further reinforces office demand. Office nodes include downtown Tampa, where government, legal, financial, and professional services tenants occupy both modern towers and older mid rise buildings, and the Westshore district, which has long been a regional hub for corporate offices, hotels, and retail that benefit from proximity to Tampa International Airport and major highways. In recent years, office demand has been influenced by shifts in workplace strategies, including remote and hybrid models, but the metropolitan employment mix still points to enduring need for well located office space in core submarkets.
Industrial and logistics demand is supported by trade transportation and utilities employment of 277.5 thousand jobs in May 2026. This sector encompasses warehousing and distribution, trucking, port related activities, and utilities. Port Tampa Bay is a major deepwater port that handles bulk cargo, containers, and cruise operations, while interstate corridors connect Tampa to other Florida markets and the broader Southeast region. These features underpin demand for distribution centers, warehouse facilities, intermodal yards, and related industrial properties. The relatively modest twelve month decline of 1.0 percent in trade transportation and utilities employment suggests a sector that is experiencing some adjustment but remains a major employer.
Retail and hospitality performance is linked to leisure and hospitality employment of 172.2 thousand jobs in May 2026 and to the broader pattern of consumer spending. Tourism and visitor traffic from beaches, theme parks in the greater region, sports venues, and cultural attractions support restaurants, hotels, and entertainment venues, particularly in downtown, Channelside, Ybor City, and along major commercial corridors. Grocery anchored neighborhood centers and community centers across Tampa and its suburbs serve residential populations and tend to be more resilient through cycles due to the essential nature of their tenants.
Without measured vacancy and rent levels, investors cannot rely on public data to benchmark commercial cash flows or risk. Instead, they must assess each asset using rent rolls, lease expiration schedules, tenant credit assessments, and local leasing comparables. In office, the key questions are building quality, location relative to transportation and amenities, tenant mix, and potential for repositioning in light of evolving workplace needs. In industrial, site access, building functionality, ceiling heights, and potential for expansion or redevelopment are critical. In retail, tenant mix, anchor strength, trade area demographics, and competition from online commerce and nearby centers matter greatly.
Section 11Transactions and Capital Markets
Public capital markets data specific to Tampa real estate, such as transaction volumes by asset class, cap rate averages, debt yields, or loan to value ratios, are not available in this environment. County recorder and property appraiser offices maintain records of individual transactions, but these are not aggregated or exposed here in a way that would support macro level analysis. Private sector transaction databases and research platforms that would normally provide such analytics are also outside the scope of this review.
However, the statewide and national housing statistics from Redfin, together with the labor and migration data discussed earlier, allow certain capital market inferences. Florida's statewide median sale price growth of one point seven percent over the twelve months ending in May 2026 suggests a mature expansion phase where home values continue to rise modestly rather than surging. The nearly ten percent decline in statewide inventory indicates that buyers are competing over fewer listings, which can support prices and limit downside in many markets. At the same time, the relatively low share of homes selling above list price in Florida compared with the national figure suggests that extreme bidding contests are less common, which may allow more disciplined investors to acquire assets at rational pricing.
Tampa's presence as one of the top migration destinations in Redfin's national migration analysis, with a net inbound inflow of four thousand eight hundred Redfin users between January and March 2026, implies continued interest from out of state buyers. Many of those buyers, especially from higher cost regions, may bring substantial equity and a willingness to pay for coastal amenities, climate, and lifestyle, affecting pricing for both single family homes and smaller investment properties.
In institutional markets, higher interest rates relative to earlier years have increased borrowing costs and have led many investors to adjust target cap rates and leverage ratios. For Tampa, which is a large but not gateway level metro, that environment likely translates into cap rates that are somewhat higher than in prime coastal markets but lower than in many inland secondary markets. Without a public cap rate series, this review cannot provide numeric estimates, but investors should expect current yields to reflect both local demand strength and elevated financing costs.
Given these conditions, transaction activity in Tampa may be characterized by selective trades in well located multifamily, industrial, and essential retail properties, alongside more opportunistic activity in office and hospitality segments where valuations have adjusted or where repositioning is possible. The absence of public transaction statistics underscores the importance of working closely with local brokers and lenders to understand prevailing pricing and capital availability.
Section 12Taxes
Property taxation in Tampa operates within Florida's state tax framework and Hillsborough County's administration. The Hillsborough County Tax Collector website identifies the office as the entity responsible for collecting property taxes, vehicle registrations, driver licenses, and other fees, and presents itself as a resource for residents and businesses. The site highlights a hurricane preparedness resource center with checklists, deadlines, and tax related guidance, as well as various express services for vehicle registration and other functions. However, the readable extract does not include specific property tax rates, millage tables, or effective tax burden statistics for Hillsborough County or Tampa.
At the state level, the Florida Department of Revenue's homepage emphasizes its role in administering state taxes and child support, and provides information on verifying contacts from the department and on safeguarding against scams. The extract accessible here focuses on guidance for taxpayers who are contacted by someone claiming to represent the department and provides phone numbers and service center references, but it does not include detailed statewide property tax rate information or numeric comparisons.
Florida property tax law is characterized by several notable features that affect real estate investors. The state provides a homestead exemption for primary residences, which substantially reduces the taxable value of owner occupied homes and often limits their assessment growth, while nonhomestead properties such as investment homes, multifamily buildings, and commercial properties do not receive the same level of protection. Local governments and school districts set millage rates within state guidelines, and property appraisers in each county determine assessed values. School and municipal referenda can also influence tax burdens over time.
For investors in Tampa, the practical implication is that property tax outcomes depend on a combination of assessed value, applicable exemptions, and millage rates that are set by multiple taxing authorities. Newly acquired properties may experience changes in assessed value compared with prior ownership, and new construction or substantial renovations can affect future assessments. Because this review does not have access to specific Hillsborough County or Tampa tax rate tables or typical effective tax burdens, any underwriting must rely on recent tax bills for comparable properties, discussions with local tax professionals, and review of county property appraiser and tax collector resources outside this environment.
Section 13Insurance
Insurance is a critical operating cost for real estate in Tampa, given the city's coastal location on the Gulf of Mexico and exposure to hurricanes, tropical storms, storm surge, and heavy rainfall. In this environment, there is no public dataset that provides average property insurance premiums for Tampa or Hillsborough County, nor any series that quantifies claim frequencies or loss ratios regionally, and no official public numeric premium figure is available on those points in this environment. State insurance regulators and entities such as Citizens Property Insurance Corporation, which plays a significant role in Florida's property insurance market, provide information on coverage and underwriting, but their detailed data are not captured here.
Qualitatively, Florida has experienced significant stress in its property insurance market over the past several years, driven by the frequency and severity of storms, litigation and claim costs, and reinsurance market dynamics. Several insurers have reduced exposure or left the market, leading remaining carriers to refine underwriting standards, adjust coverage terms, and raise premiums, particularly for properties in coastal and high hazard zones. Although Tampa is somewhat sheltered within Tampa Bay and benefits from investments in flood protection and building standards, it remains vulnerable to wind, rain, and storm surge risk.
For Tampa properties, insurance availability and cost depend on many factors, including exact location and elevation, building age and construction type, roof condition and shape, flood zone classification, prior loss history, and the presence of mitigation features such as shutters, reinforced openings, and flood vents. Commercial properties, especially older ones and those located in lower lying areas or close to the waterfront, may face larger premium increases and more restrictive terms.
Because this review cannot provide numeric premium levels or recent percentage changes, investors must treat insurance underwriting and cost as a property specific due diligence item. Quotes from multiple carriers, discussions with experienced insurance brokers, and careful review of deductibles, exclusions, and coverage limits are essential. Financial models should include stress tests for higher insurance costs in future policy periods, and investors should consider the benefits of capital improvements that enhance resilience and can improve insurability.
Section 14Landlord Tenant and Regulatory Environment
Florida landlord tenant law governs rental relationships in Tampa. The state's legal framework is generally viewed as balanced toward property owners compared with some other large states, though it still provides important protections for tenants. In this environment, there is no single comprehensive public consumer guide in text form that outlines every procedural detail for Florida landlord tenant law, but the broad contours are clear.
Residential leases in Florida are largely controlled by contract terms, subject to statutory requirements around notice, habitability, and security deposits, as well as federal and state fair housing and consumer protection laws. There is no statewide rent control system for private rental housing in Florida, and prior legislative actions have limited the ability of local governments to enact rent control measures except under narrow conditions that must meet specific legal standards.
Eviction processes for nonpayment of rent or lease violations typically involve written notice to the tenant, an opportunity to cure where applicable, and then filing in county court if the issue remains unresolved. Time frames and procedures vary based on the type of default and local court practices. Security deposit regulations define how deposits must be held, under what circumstances they can be applied to damages or unpaid rent, and timelines for returning deposits or providing written notices after lease termination.
For Tampa investors, this environment means that rental terms, rent levels, and rent increases are primarily governed by the lease and market conditions rather than by formal rent control. At the same time, substantial penalties can apply for noncompliance with notice requirements, deposit handling, or fair housing obligations. Legal counsel with Florida landlord tenant expertise and competent property management are important parts of the risk management toolkit, especially for larger portfolios or value strategies that involve tenant turnover and repositioning.
Section 15Infrastructure
Tampa's infrastructure supports its role as a major metropolitan and logistics center on Florida's Gulf Coast. The city sits at the intersection of several key roadway corridors, including limited access highways that connect Tampa to Orlando, Miami, Jacksonville, and the broader Southeast. These routes support commuter flows, freight movement, and tourism.
Tampa International Airport is one of the primary air gateways in Florida, with significant domestic and international passenger volumes and cargo traffic. Although this review does not have numeric passenger counts, the airport's role as a hub for business and leisure travel strengthens demand for nearby hotels, offices, and logistics facilities, particularly in the Westshore district and surrounding areas.
Port Tampa Bay is a major port facility serving bulk commodities, containers, and cruise lines. Its operations support warehousing, distribution, logistics services, and industrial employment in and around Tampa. Rail links and roadway connections from the port to inland distribution networks add to Tampa's appeal as a logistics node.
Within the city, transportation infrastructure includes local bus services and transit routes that connect neighborhoods to employment centers, although the accessible public content does not provide ridership data or route maps. Tampa's urban core has seen investments in streetscapes, waterfront amenities, and multimodal connections that support walkability and cycling in certain districts.
The City of Tampa's emphasis on a capital improvement projects viewer and a built to last fiscal year twenty twenty seven budget indicates an ongoing focus on maintaining and enhancing infrastructure. Projects related to stormwater management, roads and bridges, utilities, parks, and public safety facilities support both quality of life and real estate values. For investors, proximity to well maintained infrastructure, schools, health care facilities, and recreational amenities are key drivers of tenant demand across asset classes.
Section 16Climate and Physical Risks
Tampa's coastal location exposes it to a range of climate and physical risks. It experiences a humid subtropical climate with hot, humid summers, mild winters, and a pronounced rainy season. Tropical storms and hurricanes that form in the Gulf of Mexico or the Atlantic Basin can bring high winds, storm surge, and heavy rainfall to Tampa and surrounding communities.
The Federal Emergency Management Agency explains that floods occur naturally and can happen almost anywhere, not only near rivers or the immediate coastline. Heavy rains, poor drainage, and nearby construction can contribute to flood risk even away from obvious bodies of water. FEMA notes that flood maps show how likely it is for an area to flood and that any place with at least a one percent annual chance of flooding is considered high risk, with at least a one in four chance of flooding during a thirty year mortgage period. FEMA also emphasizes that floods do not follow city limits or property lines. For Tampa, which includes coastal neighborhoods along Tampa Bay, low lying areas near rivers and inlets, and inland neighborhoods with varying elevations and drainage, these principles highlight the importance of parcel specific flood risk analysis.
The National Centers for Environmental Information maintains one of the largest archives of environmental data in the world, including climate, coastal, and weather records, and provides access to climate and geophysical data through multiple platforms. While this review does not extract Tampa specific climate values from those archives, the availability of rich historical records means that past storm tracks, rainfall patterns, temperature trends, and sea level indicators can be analyzed for Tampa through tools beyond this environment.
For investors, climate and physical risk analysis in Tampa must address several elements. First, properties in or near high risk flood zones may require flood insurance and can be exposed to storm surge or riverine flooding, especially during major hurricanes. Second, wind risk is significant for all structures, particularly older buildings without modern wind resistant design, roof anchoring, or impact protection. Third, extreme rainfall events can overwhelm drainage systems, leading to temporary street and property flooding even outside mapped high risk flood zones. Fourth, heat and humidity affect building systems, roofing materials, and energy costs.
Due diligence should include review of FEMA flood maps, elevation certificates where available, information on local drainage projects and stormwater improvements, building age and construction type, roof condition, and any known history of flooding or storm damage. Investments in resilient design and mitigation, such as elevating equipment, improving roof systems, and managing site drainage, can reduce risk and improve insurability over the long term.
Section 17Neighborhoods and Submarkets
Tampa comprises a diverse set of neighborhoods and submarkets that differ in housing stock, income levels, land use patterns, and real estate dynamics.
Downtown Tampa and the adjacent Channel District form the central business and high density residential core. This area includes office towers, civic and cultural institutions, hotels, arena and convention facilities, and an increasing stock of high rise and mid rise multifamily properties. Waterfront locations, entertainment amenities, and walkable environments support higher rents and home prices. Recent development has added new apartments and condominiums, creating a denser urban residential market.
Westshore is a major mixed use district near Tampa International Airport. It includes a concentration of office buildings that house corporate, financial, and professional services tenants, as well as multiple hotels, retail centers, and restaurants that serve travelers and workers. Multifamily properties in and around Westshore benefit from proximity to employment and transportation, while single family neighborhoods nearby provide housing for professionals and families.
South Tampa, including neighborhoods such as Hyde Park, Palma Ceia, and Bayshore, offers a mix of historic homes, upscale single family residences, townhomes, and boutique multifamily buildings. Its tree lined streets, waterfront promenades, schools, and amenities make it one of the most desirable residential submarkets in the city, with implications for both pricing and property tax burdens.
Seminole Heights, Tampa Heights, and West Tampa are centrally located neighborhoods north and west of downtown that have experienced significant reinvestment. Older housing stock, historic bungalows, and small apartment buildings coexist with newer infill development, restaurants, and retail. These areas illustrate a pattern of urban revitalization that can offer value opportunities alongside concerns about affordability and displacement.
Ybor City is a historic district east of downtown known for its cigar making heritage, nightlife, and historic architecture. It contains a mix of commercial buildings, entertainment venues, offices, and residential units. Real estate here is influenced by tourism, hospitality, and entertainment cycles, as well as by efforts to preserve and adapt historic structures.
New Tampa and other suburban areas to the north and east of the city offer more modern single family subdivisions, townhome communities, and garden apartments, with a focus on schools, parks, and family oriented amenities. These submarkets serve households that commute to employment centers in Tampa and beyond and often provide relatively newer housing stock with different maintenance and capital expenditure profiles compared with older inner city neighborhoods.
Industrial submarkets are concentrated in areas with access to Port Tampa Bay, rail lines, and major highways. These areas host warehouses, distribution centers, light manufacturing, and related facilities that serve both regional and broader markets.
For investors, understanding the specific characteristics of each neighborhood and submarket is crucial. Factors such as tenant profiles, rent levels, redevelopment potential, zoning, and community sentiment vary widely and shape both risk and return across different parts of Tampa.
Section 18Opportunities
Several opportunity themes emerge for accredited investors considering Tampa.
The first is Tampa's role as a major metropolitan center with a large and diversified labor force. With 1,558.0 thousand nonfarm jobs and a civilian labor force of 1,691.4 thousand people in May 2026, the Tampa Saint Petersburg Clearwater metropolitan area offers a broad base of employment across sectors such as professional services, health care, logistics, tourism, and manufacturing. This diversification can support long term demand for residential and commercial properties and reduce dependence on any single industry.
The second is Tampa's position within Florida's ongoing migration narrative. Redfin's migration analysis shows Tampa as one of the top inbound metropolitan destinations between January and March 2026, with a net inflow of four thousand eight hundred Redfin users. Together with Florida's position as a top destination state and the statewide decline in housing inventory, this suggests that Tampa will likely continue to experience household formation and housing demand, which can support both for sale and rental segments, though future migration and demand are not assured.
Third, Tampa's neighborhood diversity creates distinct investment niches. Downtown and the Channel District support high density multifamily, mixed use, and hospitality assets that can benefit from urban living trends and waterfront amenities. Westshore and airport adjacent areas provide opportunities in office, hotel, and industrial properties tied to business travel and logistics. South Tampa and established central neighborhoods offer single family and multifamily opportunities with strong long term demand and potential for value strategies through renovation and repositioning. Suburban and exurban areas support build to rent and single family rental communities that can capture households seeking more space and newer product.
Fourth, industrial and logistics properties in Tampa stand to benefit from ongoing growth in online commerce, port traffic, and regional distribution. With trade transportation and utilities employing 277.5 thousand workers in May 2026, and Port Tampa Bay and interstate connections providing strong infrastructure, demand for well located modern warehouses and distribution centers is likely to remain solid.
Finally, Tampa's infrastructure investments and focus on resilience, signaled in part by the city's emphasis on a built to last budget and hurricane preparedness, create a backdrop where public capital supports private real estate performance. Upgrades to stormwater systems, roads, utilities, and public spaces can enhance property values and tenant appeal across asset classes.
Section 19Risks
Balanced against these opportunities are several important risks that investors must consider.
Data limitations are a primary concern in this environment. The inability to access Census QuickFacts and American Community Survey tables for Tampa and Hillsborough County means that there are no official public numbers here for population, household composition, income, rent, or vacancy. Investors cannot cross check their assumptions against broad demographic and housing statistics using this environment alone and must rely on other channels and proprietary data for quantitative benchmarks.
Climate and insurance risks are also significant. Tampa's exposure to hurricanes, tropical storms, storm surge, and heavy rainfall creates both physical risk to properties and financial risk through potential increases in insurance premiums and changes in coverage terms. The absence of public insurance premium statistics in this review does not reduce the underlying risk that insurance costs can rise substantially over investment holding periods, especially after major events.
Market cycle and interest rate risks are present as well. The Bureau of Labor Statistics data show very modest job growth in Tampa and Florida over the past year, and Redfin housing data indicate slow but positive statewide home price appreciation. These conditions describe a mature expansion where valuations in many segments may already reflect an optimistic view of future performance. Higher interest rates increase borrowing costs and can compress levered returns, especially if rent growth slows or vacancies rise in certain submarkets or asset classes.
Local overbuilding and submarket concentration risks are another concern. Without clear public data on the supply pipeline, there is a possibility that particular submarkets, such as high end downtown apartments, student housing near specific institutions, or logistics parks in certain corridors, could experience supply that outpaces demand. Even in a growing metro, localized oversupply can lead to rent pressure and higher vacancy.
Regulatory and policy risks, especially around land use, short term rentals, and potential changes in state property insurance or tax policy, can also affect returns. While Florida currently does not have statewide rent control and tends to favor property owners in many respects, future policy shifts could alter development incentives, tax burdens, or operating conditions.
Section 20Investor Implications
For accredited investors, Tampa should be viewed as a key coastal metropolitan market within Florida that offers a blend of income producing and growth oriented opportunities, balanced by significant climate, insurance, and data related risks.
Multifamily investments in well located urban and inner suburban neighborhoods can provide stable occupancy and income driven by a diversified employment base and ongoing net inbound migration. Value strategies may include renovating older properties in revitalizing neighborhoods, repositioning assets in central locations, or developing new projects that meet evolving tenant preferences for amenities, location, and design.
Single family and build to rent strategies can benefit from Tampa's continued population inflows and the statewide tightening of for sale inventory. Portfolios focused on family oriented neighborhoods with strong schools and access to employment centers may support resilient cash flows over time, though careful attention must be paid to acquisition pricing, property taxation, and maintenance costs, and no particular outcome is assured.
Industrial and logistics properties represent a compelling long term theme given Tampa's port, airport, and highway infrastructure and its role in regional distribution networks. Modern facilities with good access and flexible design are likely to remain in demand, with opportunities for both core and value strategies depending on tenant mix and lease structure.
Office and selected retail and hospitality investments can also be considered when targeted thoughtfully. Assets in strong locations with high quality tenants, modern or adaptable layouts, and realistic rent and occupancy assumptions may offer income, especially if acquired at valuations that reflect current uncertainties around workplace and consumer behavior, though yields are not assured.
Across all asset classes, investors must underwrite conservatively in the absence of public demographic, income, rent, and vacancy series, using multiple independent data sources and robust scenario analysis. Stress testing for higher insurance premiums, potential increases in property taxes, and slower rent growth, along with thoughtful capital structure design, is essential. Engagement with local market participants, including property managers, brokers, lenders, and legal counsel, is critical to navigate Tampa's specific regulatory environment and on the ground realities.
Section 21Conclusion
Tampa occupies a central place in Florida's real estate landscape, combining the scale and diversity of a major metropolitan area with the amenities and climate of a Gulf Coast city. Public data available in this environment show a metropolitan labor market with more than one and a half million nonfarm jobs, low to mid single digit unemployment, and modest job growth. Statewide housing statistics from Redfin depict a Florida market with prices near national medians, a meaningful decline in for sale inventory, and a moderate level of competition relative to the United States as a whole. Migration data place Tampa among the leading metropolitan destinations for relocating homebuyers within the national housing market.
At the same time, technical barriers prevent access to official public statistics on population, income, rents, and vacancy for Tampa and Hillsborough County, and there are no public series here for commercial vacancy, rents, or capitalization rates. These gaps require investors to supplement this kind of high level analysis with detailed property level and proprietary data, and to place greater emphasis on due diligence and scenario planning.
For accredited investors with a long term view and a disciplined approach, Tampa presents opportunities across multifamily, single family, industrial, and selected office, retail, and hospitality segments. The city's economic base, infrastructure, and role in national migration patterns support sustained real estate demand, while its exposure to climate and insurance risks, evolving work and consumption patterns, and incomplete public data picture demand thoughtful risk management, and no particular outcome is assured. Within a diversified portfolio, Tampa can serve as a strategic allocation that balances income and growth in a major Florida coastal market.
Sources
- United States Bureau of Labor Statistics, Tampa Saint Petersburg Clearwater Florida Economy at a Glance, not seasonally adjusted data for civilian labor force, employment, unemployment, unemployment rate, total nonfarm employment, and sector employment including construction, manufacturing, trade transportation and utilities, information, financial activities, professional and business services, education and health services, leisure and hospitality, other services, and government, with twelve month percent changes, January through June 2026, data extracted August 7 2026.
- United States Bureau of Labor Statistics, Florida Economy at a Glance, seasonally adjusted statewide civilian labor force, employment, unemployment, unemployment rate, total nonfarm employment, and sector employment with twelve month percent changes, January through June 2026, data extracted August 7 2026.
- Redfin, Florida Housing Market, statewide housing market overview for May 2026 including median sale price across all home types of three hundred ninety five thousand five hundred ninety five dollars with a one point seven percent year over year increase, two hundred thousand five hundred twenty four homes for sale with a nine point eight nine percent year over year decline, and nine point nine percent of homes sold above list price with a zero point two percentage point increase, plus state level migration context and lists of fastest growing and most competitive Florida metros, viewed August 7 2026.
- Redfin, United States Housing Market and Prices, national housing market overview for May 2026 including median sale price across all home types of three hundred ninety eight thousand seven hundred seventy one dollars with a two point zero percent year over year increase, one million four hundred eighty three thousand eight hundred thirty nine homes for sale with a zero point seven percent year over year increase, and twenty four point nine percent of homes sold above list price with a zero point zero eight three percentage point decline, along with national migration statistics showing Tampa among the top inbound metropolitan destinations with a net inflow of four thousand eight hundred Redfin users between January and March 2026, viewed August 7 2026.
- Redfin, Florida Housing Market migration section, listing top ten areas people are moving to between January and March 2026 and showing Tampa Florida as the sixth most popular destination with a net inflow of four thousand eight hundred Redfin users, viewed August 7 2026.
- Redfin, San Marino California Housing Market, page reached when attempting to access the Tampa Florida housing market using a Tampa city identifier, used in this review only to document misrouting and not to characterize Tampa, viewed August 7 2026.
- United States Census Bureau, QuickFacts Tampa city Florida, which in this environment returns a Cloudflare security page indicating that access to the Census website is blocked and providing no population, housing, or income data, viewed August 7 2026.
- United States Census Bureau, QuickFacts Hillsborough County Florida, which in this environment returns a Cloudflare security page indicating that access to the Census website is blocked and providing no county population, housing, or income data, viewed August 7 2026.
- United States Department of Housing and Urban Development, fiscal year 2024 Fair Market Rent documentation system geography selection interface, which in this environment displays only prompts to select a state, county, or metropolitan Fair Market Rent area, without exposing numeric rent values in the readable text, confirming that Fair Market Rent dollar amounts for Tampa or Hillsborough County are not available here, viewed August 7 2026.
- Hillsborough County Tax Collector, main site, describing services including property tax collection, vehicle registration, driver licenses, and hurricane preparedness resources, and highlighting a hurricane preparedness resource center and express services, but not providing numeric property tax rate tables or effective tax rates in the accessible extract, viewed August 7 2026.
- Florida Department of Revenue, main site, describing the department's role in administering state taxes and child support, providing guidance on verifying contacts from the department and listing taxpayer services contact options, but not presenting statewide property tax rates or numeric tax burden statistics in the accessible extract, viewed August 7 2026.
- City of Tampa, official city website home page, describing the city's fiscal year twenty twenty seven budget theme of built to last, referencing a two thousand twenty six hurricane guidebook and the Alert Tampa communications system, listing recent city news and events, and highlighting a capital improvement projects viewer and the mayor's strategic goals, viewed August 7 2026.
- Federal Emergency Management Agency, Flood Maps page, explaining that floods can occur almost anywhere, that areas with at least a one percent annual chance of flooding are considered high risk with at least a one in four chance of flooding during a thirty year mortgage, that floods do not follow city limits or property lines, and describing the role of flood maps, the Flood Map Service Center, and the mapping and appeal process, viewed August 7 2026.
- National Centers for Environmental Information, main site, describing the agency as maintaining one of the most significant environmental data archives in the world and providing access to climate, coastal, oceanographic, and geophysical data through multiple platforms, viewed August 7 2026.