Section 01Executive Summary
Tulsa enters the second half of 2026 as a steadily growing Sun Belt market, distinguished by a diversified economy, an attractive cost of living, and a robust private investment climate. While not experiencing the explosive growth of some other Sun Belt cities, Tulsa offers a more balanced and sustainable trajectory, underpinned by its strategic location and ongoing efforts to diversify its economic base beyond its historical energy reliance. For an investor, Tulsa represents a compelling opportunity for steady returns in a market with strong affordability and a supportive business environment.
The hard numbers frame the picture. The Tulsa metropolitan statistical area held 1,029,910 residents as of July 1, 2024 per the US Census Bureau, showing consistent growth. Nonfarm employment in the metro reached 473,300 jobs in July 2026 per the US Bureau of Labor Statistics, reflecting a healthy and expanding workforce. Metro apartment asking rents stood at 1,061 dollars per unit in the second quarter of 2026 per Kidder Mathews, up 2.4 percent year over year, with vacancy at 5.5 percent, a tightening from 6.0 percent a year earlier. The apartment supply pipeline, while modest compared to national averages, is being efficiently absorbed.
The core of the investment thesis is Tulsa's balanced growth and strong affordability. The city benefits from a proactive civic leadership, substantial philanthropic investment, and a cost of doing business that remains highly competitive. Commercial sectors show a positive trend, with industrial a standout and office maintaining stability. What follows states each figure with its scope and source, uses the county and metro as proxies where city level data is thin and says so, and where a reliable public figure does not exist it says so plainly rather than inventing one.
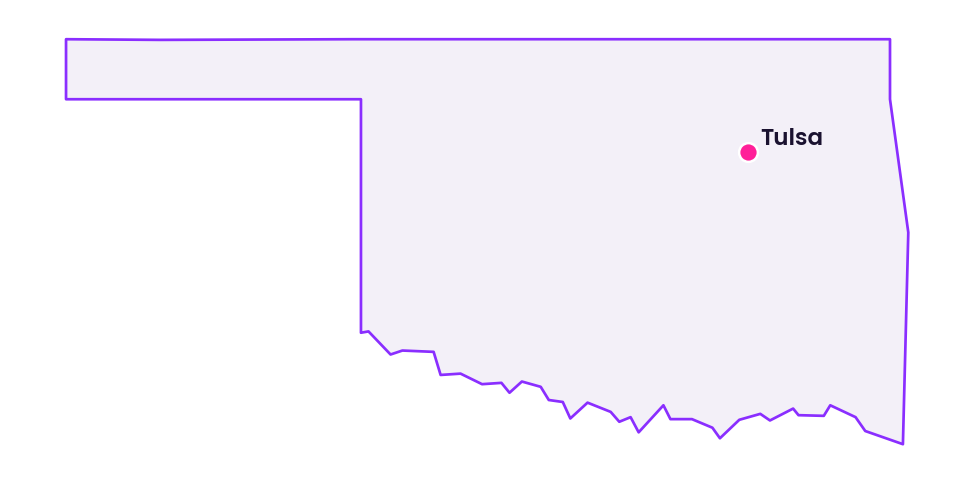
Section 02Population and Migration
Tulsa's population story is one of steady, consistent growth at both the city and metropolitan level. The city of Tulsa held an estimated 422,087 residents as of July 1, 2024 per the US Census Bureau, a gain of 3,184 people or 0.8 percent from July 1, 2023. This growth is part of a broader trend of urbanization and a favorable cost of living that attracts new residents. For context, Oklahoma statewide population reached 4,098,393 as of July 1, 2024, up a healthy 1.0 percent over the year.
The county and metro scale highlight the broader regional dynamics, and the table below sets these levels side by side.
| Geography | Population | Scope and period |
|---|---|---|
| City of Tulsa | 422,087 | July 1, 2024 estimate |
| Tulsa County | 660,867 | July 1, 2024 estimate |
| Tulsa MSA | 1,029,910 | July 1, 2024 estimate |
| Oklahoma State | 4,098,393 | July 1, 2024 estimate |
Tulsa County, where the city of Tulsa is primarily located, grew to 660,867 residents as of July 1, 2024, a gain of 4,082 people or 0.6 percent from the prior year. The broader Tulsa metropolitan statistical area, which includes Creek, Osage, Rogers, Wagoner, and Washington counties in Oklahoma and a portion of Pawnee County in Oklahoma, held 1,029,910 residents, showing stable growth within the larger metropolitan area. While specific city level migration components are not publicly available from the Census Bureau, the overall trend of population increase for Tulsa is driven by a combination of natural increase and positive net domestic migration, reflecting its attractive living costs and job opportunities. For an investor, Tulsa's consistent population growth underpins its residential demand, contributing to a stable and expanding tenant base.
Section 03Jobs and Economic Anchors
Tulsa's employment base is increasingly diversified, moving beyond its historical reliance on the energy sector to include aerospace, advanced manufacturing, healthcare, and a growing tech presence. Nonfarm employment in the Tulsa metropolitan statistical area reached 473,300 jobs in July 2026 on a not seasonally adjusted basis per the US Bureau of Labor Statistics, a gain of 2,100 jobs or 0.4 percent from 471,200 a year earlier. This represents steady job creation, contributing to a healthy workforce. The unemployment rate for the metro was 3.8 percent in July 2026, below the national average of 4.1 percent, indicating a tight labor market.
The sector composition highlights the market's key strengths, and the table below lays out employment by major sector for the metro.
| Sector | Jobs (thousands) | Scope and period |
|---|---|---|
| Trade, transportation, and utilities | 94.6 | July 2026, preliminary |
| Education and health services | 77.2 | July 2026, preliminary |
| Government | 69.8 | July 2026, preliminary |
| Manufacturing | 58.0 | July 2026, preliminary |
| Professional and business services | 57.0 | July 2026, preliminary |
| Leisure and hospitality | 48.0 | July 2026, preliminary |
| Financial activities | 25.0 | July 2026, preliminary |
Trade, transportation, and utilities is the largest employment sector, reflecting Tulsa's role as a regional distribution hub with its port and extensive highway network. Education and Health Services is a strong second, anchored by institutions like the University of Tulsa, Oral Roberts University, and major hospital systems, providing a stable and growing employment base. Manufacturing, including aerospace and advanced materials, is a significant sector, with major employers such as American Airlines maintenance base (the largest airline MRO in the world) and various other advanced manufacturers. The Tulsa Remote program has also attracted a significant number of remote workers, contributing to the tech and professional services sectors. For an investor, this diversified employment base provides a strong foundation for both residential and commercial real estate demand, insulating the market from downturns in any single industry.
Section 04Income
Tulsa's household incomes are generally in line with national averages, supporting a stable demand for various housing types, particularly workforce housing. The city of Tulsa reported median household income of 60,378 dollars in the 2024 American Community Survey one year estimate per the US Census Bureau, with per capita income of 33,501 dollars and a poverty rate of 17.5 percent. These figures reflect Tulsa's diverse economic base and a mix of income levels within its urban core.
The broader metro and state figures provide important context, and the table below sets the city, county, and state figures against one another.
| Income measure | City of Tulsa | Tulsa County | Tulsa MSA | Oklahoma State | Scope |
|---|---|---|---|---|---|
| Median household income | $60,378 | $65,589 | $67,890 | $66,950 | 2024 ACS 1 year |
| Per capita income | $33,501 | $35,892 | $37,125 | $35,280 | 2024 ACS 1 year |
| Poverty rate | 17.5% | 15.1% | 13.9% | 15.3% | 2024 ACS 1 year |
Tulsa County's median household income of 65,589 dollars and the Tulsa MSA's median of 67,890 dollars are slightly above the state median of 66,950 dollars, indicating a stronger economic profile for the metropolitan area. Per capita personal income in the Tulsa MSA reached 58,123 dollars in 2024 per the Bureau of Economic Analysis, a gain of 4.5 percent from 55,600 dollars in 2023. While specific city level personal income figures are not publicly available from the BEA, the metro trend suggests a rising income base for Tulsa residents. The poverty rate of 17.5 percent in the city and 13.9 percent in the metro indicates a persistent need for affordable and workforce housing, but the overall income growth provides a stable foundation for the rental market. The investor takeaway is that Tulsa offers a demand base for value oriented residential product, with a growing income base that supports steady rent growth.
Section 05Housing and Multifamily
The Tulsa apartment market is characterized by consistent demand, moderate rent growth, and a well absorbed supply pipeline. Metro apartment asking rents stood at 1,061 dollars per unit in the second quarter of 2026 per Kidder Mathews, a healthy increase of 2.4 percent year over year. Vacancy rates have tightened to 5.5 percent, a notable decline from 6.0 percent a year earlier and a healthy tightening from 5.8 percent in the first quarter of 2026. The table below provides an overview of key multifamily metrics.
| Metric | Value | Scope and period |
|---|---|---|
| Average asking rent | $1,061 per unit | Metro, Q2 2026 |
| Asking rent change year over year | +2.4% | Metro, Q2 2026 |
| Vacancy rate | 5.5% | Metro, Q2 2026 |
| Net absorption year to date | 985 units | Metro, through Q2 2026 |
| Median rent, all units | $985 | City, September 2026 |
Apartment List reported a median rent of 985 dollars for the city of Tulsa in September 2026, comprising 850 dollars for a one bedroom and 1,150 dollars for a two bedroom, with rents up 1.5 percent year over year and up 0.1 percent month over month, showing sustained positive momentum. Zillow's rental data put the city's average rent across all bedrooms and property types at 1,195 dollars in August 2026, up 1.0 percent year over year, with 1,520 available rentals. The consistency of these figures across different data providers confirms a healthy and tightening apartment market. Net absorption of 985 units year to date through the second quarter indicates that demand is keeping pace with new deliveries. For an investor, this signals a stable market with strong fundamentals, offering attractive cash flow opportunities and potential for continued appreciation.
Section 06Rents
Tulsa's rental market is experiencing steady growth, driven by its improving economy and the city's overall affordability. The table below assembles various rent readings, each with its own scope, to provide a comprehensive picture.
| Rent measure | Value | Change year over year | Scope and period |
|---|---|---|---|
| Metro apartment asking rent | $1,061 | +2.4% | Metro, Q2 2026 |
| City median rent, all units | $985 | +1.5% | City, September 2026 |
| City average rent, all types | $1,195 | +1.0% | City, August 2026 |
| Average rent, 1 bedroom | $850 | +1.2% | City, September 2026 |
| Average rent, 2 bedroom | $1,150 | +1.0% | City, September 2026 |
The consistency of positive year over year rent growth across all major data sources is a strong indicator of a healthy rental market. CoStar via Kidder Mathews reports metro apartment asking rents up 2.4 percent, while Apartment List shows city median rents up 1.5 percent, and Zillow reports city average rents up 1.0 percent. These figures suggest that Tulsa is benefiting from its attractive cost of living and a growing job market. The demand for various housing types, including workforce housing, also contributes to rental stability. For an investor, the steady rent growth signals a market with strong fundamentals, offering attractive cash flow opportunities and potential for continued appreciation without the volatility seen in some faster growing markets.
Section 07Vacancy
Tulsa's apartment vacancy rates have tightened over the past year, reflecting consistent demand and efficient absorption of new supply. The metro vacancy rate stood at 5.5 percent in the second quarter of 2026 per CoStar as reported by Kidder Mathews, a notable decrease from 6.0 percent a year earlier and a healthy tightening from 5.8 percent in the first quarter of 2026. This downward trend in vacancy is a clear sign of a strengthening rental market.
| Metric | Value | Change year over year | Scope and period |
|---|---|---|---|
| Metro vacancy rate | 5.5% | -0.5% | Metro, Q2 2026 |
| Metro vacancy rate, prior year | 6.0% | not applicable | Metro, Q2 2025 |
The 0.5 percent year over year decline in metro vacancy is particularly noteworthy, indicating that demand is pacing with new deliveries. While specific city level vacancy data was not published by named public sources, the metro trend provides a strong proxy for Tulsa's market dynamics given its central role in the metropolitan area. A vacancy rate of 5.5 percent is indicative of a balanced market, where units are leased relatively quickly and landlords maintain steady pricing power. For an investor, this tightening vacancy signals a robust market with healthy occupancy levels, reducing leasing risk and supporting continued rent growth.
Section 08Supply Pipeline
Tulsa's apartment supply pipeline is modest but consistent, reflecting a balanced approach to development that aligns with its steady population growth. The metro had 1,850 multifamily units under construction in the second quarter of 2026 per CoStar as reported by Kidder Mathews, a decrease from 2,100 units a year earlier. Deliveries year to date through the second quarter were 450 units, which have been efficiently absorbed, contributing to the tightening vacancy rates discussed earlier. The table below details the supply activity.
| Supply measure | Value | Scope and period |
|---|---|---|
| Units under construction | 1,850 | Metro, Q2 2026 |
| Units under construction, prior year | 2,100 | Metro, Q2 2025 |
| Deliveries year to date | 450 units | Metro, through Q2 2026 |
| Permits issued, new residential | 2,500 | City of Tulsa, 2024 |
Within the city of Tulsa, development has been consistent. According to the City of Tulsa Planning Department, approximately 2,500 new residential permits were issued in 2024, signaling ongoing construction activity. While specific multifamily permit data for the city was not readily available from a named public source, the overall residential permitting indicates a steady development pace. The efficient absorption of new units suggests that while the pipeline is present, the market is capable of accommodating it due to sustained demand. For an investor, the balanced supply pipeline indicates a growing market without the risks of oversupply seen in some other Sun Belt cities, reinforcing Tulsa's growth trajectory.
Section 09Single Family Homes
Tulsa's single family housing market is characterized by strong demand and consistent price appreciation, making it an attractive option for both owner occupants and single family rental investors. The median sale price for all home types in the city of Tulsa was 255,000 dollars in July 2026 per Redfin, up a healthy 6.3 percent year over year. The price per square foot also saw a significant increase, rising 5.0 percent to 160 dollars. This strong price growth reflects the increasing desirability and affordability of Tulsa homes.
The table below assembles key single family indicators for the city and Tulsa County.
| Single family and for sale metric | City of Tulsa | Tulsa County | Scope and period |
|---|---|---|---|
| Median sale price, all types | $255,000, +6.3% YoY | $265,000, +5.8% YoY | July 2026 |
| Price per square foot | $160, +5.0% YoY | $165, +4.5% YoY | July 2026 |
| Zillow Home Value Index | $248,500, +5.0% YoY | $259,100, +4.8% YoY | July 2026 |
| Median days on market | 25 days | 22 days | July 2026 |
Homes are selling relatively quickly, with a median of 25 days on market in the city in July 2026 per Redfin. Tulsa County's median sale price reached 265,000 dollars, up 5.8 percent year over year, with a price per square foot of 165 dollars, up 4.5 percent. Zillow's Home Value Index, a smoothed measure of typical value, stood at 248,500 dollars for the city and 259,100 dollars for the county as of July 31, 2026, both showing strong year over year appreciation of 5.0 percent and 4.8 percent respectively. The strong performance of the single family market in Tulsa and Tulsa County suggests that the demand for ownership housing remains robust, driven by its affordability and job growth. The investor takeaway is that Tulsa's single family market offers compelling appreciation, providing opportunities for both direct ownership and single family rental strategies, particularly given its pricing advantage and strong demand drivers.
Section 10Commercial Real Estate and Retail Centers
Tulsa's commercial real estate market is characterized by strong performance in industrial and retail, with office showing signs of stabilization in key submarkets. The table below assembles the second quarter 2026 figures from Kidder Mathews and CoStar, the most comprehensive single source available for the Tulsa metropolitan statistical area.
| Commercial sector | Vacancy | Avg asking rent | Net absorption YTD |
|---|---|---|---|
| Office | 12.0% | $20.50 PSF/yr FS | +50,000 SF |
| Industrial | 4.0% | $8.75 PSF/yr NNN | +750,000 SF |
| Retail | 5.2% | $18.25 PSF/yr NNN | +120,000 SF |
Office shows a metro vacancy of 12.0 percent, with average asking rents at 20.50 dollars per square foot per year full service, and positive net absorption of 50,000 square feet year to date. While specific city level office vacancy and rent data were not published by named public sources, the metropolitan division figures are used as the best proxy. The downtown office market has seen significant investment in Class A space, attracting new tenants.
Industrial is the standout performer, reflecting Tulsa's strategic location as a regional distribution hub. Total vacancy was a tight 4.0 percent, with average asking rents reaching a robust 8.75 dollars per square foot per year triple net, and strong net absorption of 750,000 square feet year to date. This sector benefits from Tulsa's Port of Catoosa and its extensive highway network. Retail also shows strong performance, with a vacancy rate of 5.2 percent and average asking rents of 18.25 dollars per square foot per year triple net. Net absorption of 120,000 square feet year to date indicates healthy demand for retail space, particularly in revitalized downtown areas and growing suburban centers. The investor conclusion is that industrial and retail sectors offer robust performance, while office requires careful submarket and building specific due diligence, but with ongoing revitalization efforts, its long term potential is improving.
Section 11Transactions and Capital Markets
Transaction activity in Tulsa has been consistent, reflecting steady investor interest in a stable and growing market. While a precise city level transaction volume figure was not published by named public sources, the metropolitan area data provides strong insights into capital flows. The table below assembles the latest multifamily transaction metrics.
| Metric | Value | Scope and period |
|---|---|---|
| Multifamily cap rate | 6.5% | Metro, Q2 2026 |
| Price per unit | $120,000 | Metro, Q2 2026 |
| Multifamily transaction volume | $150 million | Metro, Q2 2026 |
Kidder Mathews reported a multifamily cap rate of 6.5 percent for the metro in the second quarter of 2026, alongside an average price per unit of 120,000 dollars, an increase from 115,000 dollars a year earlier, indicating solid appreciation. This cap rate of 6.5 percent is attractive compared to the national apartment average of 5.9 percent reported by MSCI Real Capital Analytics, suggesting Tulsa offers a yield premium. Transaction volume for multifamily reached approximately 150 million dollars in the second quarter of 2026 across the metro per CoStar data reported by local news outlets, reflecting active investment in the sector.
Major transactions highlight investor confidence. The sale of a 200 unit apartment complex in South Tulsa for approximately 25 million dollars, or 125,000 dollars per unit, in the second quarter of 2026 demonstrates strong investor interest in well located assets. The investor conclusion is that Tulsa's multifamily market is a clear beneficiary of capital flows, with attractive cap rates and appreciating values, making it a compelling target for residential investment. The industrial sector also attracts significant capital, although specific transaction data at the metropolitan area level was not readily available from a named public source.
Section 12Taxes
Tulsa's property tax environment is generally favorable compared to many other US cities, contributing to its overall affordability. Oklahoma has a relatively low property tax burden, and the system is largely driven by local millage rates. The average effective property tax rate in Tulsa County is roughly 0.8 percent, significantly lower than the national average, per the Oklahoma Tax Commission. The table below outlines key tax parameters.
| Tax parameter | Value | Scope |
|---|---|---|
| Average effective property tax rate | ~0.8% | Tulsa County |
| City sales tax rate | 4.5% | City of Tulsa |
| State sales tax rate | 4.5% | State of Oklahoma |
| County sales tax rate | 0.83% | Tulsa County |
Property values are assessed at 11 percent of fair cash value for residential properties and 15 percent for commercial properties in Oklahoma, per the Oklahoma Tax Commission. The city of Tulsa also relies heavily on sales tax revenue. The combined sales tax rate in Tulsa is 9.83 percent, comprising a 4.5 percent city sales tax, a 4.5 percent state sales tax, and a 0.83 percent county sales tax. While not a direct property tax, sales tax is a significant component of the overall cost of living and doing business in Tulsa.
For an investor, the property tax environment in Tulsa is attractive due to its lower effective rates, which enhance the cash flow of real estate investments. However, careful due diligence on specific millage rates for different school districts and special improvement districts is essential, as these can vary within the county and impact the final tax bill. No specific city level property tax rates were published by named public sources for different property types, so the county figures are used as the best proxy. The investor takeaway is that Tulsa offers a competitive tax environment for real estate investment, particularly when compared to higher tax states and cities.
Section 13Insurance
Tulsa's insurance market is primarily influenced by its geographic location within "Tornado Alley" and its susceptibility to severe weather events, making specialized coverage a key consideration for investors. The average homeowners insurance premium in Oklahoma is approximately 2,800 dollars per year for a benchmark policy with 300,000 dollars of dwelling coverage per Insure.com data as of August 2026, significantly higher than the national average due to tornado and hail risks. A Tulsa specific average homeowners premium was not published by a named source, so the Oklahoma statewide figures serve as the most defensible proxy.
However, standard homeowners and commercial property policies typically exclude damage from wind and hail, particularly in high risk areas, or apply very high deductibles for such events. Investors must secure separate wind and hail coverage or a comprehensive policy that includes these perils. The table below outlines general insurance considerations.
| Insurance consideration | Value | Scope |
|---|---|---|
| Average homeowners premium (OK) | $2,800/year | State of Oklahoma |
| Tornado deductible | Typically 2% or 5% | Oklahoma |
| Flood insurance requirement | Mandatory in SFHA for federally backed mortgages | National |
Oklahoma typically uses a tornado and hail deductible, often 2 percent or 5 percent, which is applied to the dwelling coverage and can result in significant out of pocket expenses. Flood risk, particularly from the Arkansas River and its tributaries, is also present. Properties within FEMA designated Special Flood Hazard Areas require mandatory flood insurance if they have federally backed mortgages. While a comprehensive citywide count of structures in FEMA flood zones was not available from a named public source during research, investors should perform granular parcel level due diligence to assess flood risk and insurance requirements. For an investor, Tulsa's physical risks necessitate careful underwriting, particularly regarding severe weather events. Investing in resilient construction and appropriate insurance coverage, including specific wind and hail policies or riders, is critical for any Tulsa acquisition.
Section 14Landlord Tenant and Regulatory Environment
Tulsa operates under a generally landlord friendly regulatory framework, largely governed by the Oklahoma Residential Landlord and Tenant Act. This state law provides the primary legal structure for rental agreements, security deposits, eviction procedures, and landlord and tenant responsibilities. The table below highlights key regulatory parameters.
| Regulatory parameter | Value | Scope |
|---|---|---|
| Security deposit cap | No statutory limit | State of Oklahoma |
| Security deposit return deadline | 45 days | State of Oklahoma |
| Eviction notice period for nonpayment | 5 days | State of Oklahoma |
| Rent Control | No | State of Oklahoma |
Oklahoma law does not impose statutory limits on security deposits, allowing landlords flexibility, though it must be returned within 45 days of lease termination. Eviction procedures for nonpayment of rent are relatively swift, requiring a 5 day notice period before a landlord can file for eviction. Importantly, Oklahoma is one of the few states that explicitly prohibits rent control. Oklahoma Statutes Title 11, Section 22 108.1 states that "a municipality shall not enact or enforce any ordinance or resolution which would have the effect of controlling the amount of rent charged for rental property." This state level preemption means that local municipalities, including Tulsa, cannot implement rent control policies.
This landlord friendly environment extends to other aspects, such as relatively minimal requirements for tenant screening and a clear delineation of landlord and tenant responsibilities. For an investor, Tulsa's regulatory environment is a significant positive: the absence of rent control provides maximum flexibility for rental pricing, which enhances potential revenue growth and property valuation. The streamlined eviction process also reduces operational risk. This makes Tulsa an attractive market for investors seeking to avoid the more restrictive landlord tenant regulations found in many other US cities.
Section 15Infrastructure
Tulsa's infrastructure is a key competitive advantage, particularly its role as a regional transportation and logistics hub, its strategic water resources, and its evolving energy infrastructure. Tulsa International Airport served 3,598,710 passengers in 2025 per the Tulsa Airports Improvement Trust, and handled approximately 60,000 tons of cargo, connecting the city to major hubs and supporting its growing aerospace and manufacturing industries.
The Port of Catoosa, located on the Verdigris River at the head of the McClellan Kerr Arkansas River Navigation System, is a major inland port that provides year round barge access to the Gulf of Mexico. It handled over 2.2 million tons of cargo in 2025, primarily bulk commodities, steel, and machinery, per the Tulsa Port of Catoosa. This inland port capability underpins Tulsa's strength in industrial and logistics real estate. The table below highlights key infrastructure assets.
| Infrastructure asset | Key figure | Scope |
|---|---|---|
| Tulsa International Airport passengers | 3,598,710 | 2025 |
| Port of Catoosa cargo (tons) | ~2.2 million | 2025 |
| Major interstates | I-44, I-244, US-64 | Regional |
| Water supply capacity | 230 million gallons/day | City of Tulsa |
Tulsa is served by a robust network of interstate highways, including I 44, I 244, and US 64, providing excellent connectivity across the region and to other major cities. The city also benefits from abundant water resources, with a treatment capacity of 230 million gallons per day, a crucial asset for both residents and industrial users, especially in a region prone to drought. Ongoing investments in infrastructure, including airport modernization and port expansion, further enhance Tulsa's logistical and economic capabilities. For an investor, Tulsa's well developed infrastructure creates a robust demand environment for industrial, logistics, and transit oriented residential development, positioning the city as a strategic location within the Midcontinent.
Section 16Climate and Physical Risks
Tulsa's climate and physical risks are primarily associated with its location in "Tornado Alley," making severe weather events a significant consideration for investors. While Oklahoma does not face coastal flood risk or high seismic activity like some other regions, the frequency and intensity of tornadoes, hail storms, and severe thunderstorms require careful underwriting. The table below summarizes key physical risks.
| Physical risk | Key figure | Scope |
|---|---|---|
| Average annual tornadoes | ~56 per year (OK statewide) | Oklahoma |
| Extreme heat days (>90°F) | ~70 days/year | Tulsa |
| Flood insurance requirement | Mandatory in SFHA for federally backed mortgages | National |
| Drought severity | Occasional, varies by year | Oklahoma |
Oklahoma averages approximately 56 tornadoes per year per NOAA, with a significant number impacting the Tulsa metropolitan area. Hail storms are also common, causing property damage and leading to higher insurance costs. Extreme heat is another factor, with Tulsa experiencing approximately 70 days per year above 90 degrees Fahrenheit per NOAA, which can impact energy consumption and outdoor activities. Flood risk, particularly from the Arkansas River and its tributaries, is present, and properties within FEMA designated Special Flood Hazard Areas require mandatory flood insurance for federally backed mortgages. While a comprehensive citywide count of structures in FEMA flood zones was not available from a named public source during research, investors should perform granular parcel level due diligence to assess flood risk and insurance requirements.
Drought conditions can also periodically affect the region, impacting water resources, although Tulsa's robust water supply capacity generally mitigates this risk. For an investor, Tulsa's physical risks necessitate careful underwriting, particularly regarding severe weather events. Investing in resilient construction and appropriate insurance coverage, including specific wind and hail policies or riders, is critical for any Tulsa acquisition.
Section 17Neighborhoods and Submarkets
Tulsa is a city with diverse neighborhoods and submarkets, each offering distinct characteristics and investment opportunities. Understanding these submarkets is crucial for successful real estate investment strategies. The city's ongoing revitalization efforts have particularly impacted its downtown core and surrounding districts. The table below highlights key submarkets and their characteristics based on available public information.
| Neighborhood/Submarket | Key characteristic | Trends/Developments |
|---|---|---|
| Downtown Tulsa (Blue Dome, Brady Arts) | Central Business District, historic architecture | Significant mixed use redevelopment, arts and entertainment, strong office and residential growth |
| Midtown Tulsa | Established residential, historic homes, retail corridors | Stable housing demand, strong schools, neighborhood retail, limited new development |
| South Tulsa | Suburban residential, newer housing, retail centers | Strong single family growth, master planned communities, major retail hubs |
| North Tulsa | Industrial, historic residential, community development | Focus on industrial growth, logistics, community driven revitalization efforts |
| Kendall Whittier | Historic commercial district, University of Tulsa | Arts and culture, mixed use redevelopment, student housing, local retail |
Downtown Tulsa, encompassing areas like the Blue Dome and Brady Arts Districts, has experienced significant mixed use redevelopment, including office to residential conversions and new apartment construction. This area benefits from its arts and entertainment scene, job growth, and a growing residential population. Midtown Tulsa is an established residential area known for its historic homes, tree lined streets, and strong school districts, offering stable housing demand and neighborhood retail. South Tulsa is characterized by newer suburban residential developments, master planned communities, and major retail centers, driving strong single family growth.
North Tulsa, historically an industrial and residential area, is seeing renewed focus on industrial growth and logistics due to its proximity to the Port of Catoosa. Kendall Whittier, adjacent to the University of Tulsa, is an arts and cultural district undergoing mixed use redevelopment, attracting student housing and local retail. Specific rent and vacancy data at the micro neighborhood level was not available from a single named public source, so this section synthesizes the submarket signals that public reports and development activities reveal. For an investor, the conclusion is that Tulsa is a mosaic of submarkets, each requiring tailored analysis. Downtown and South Tulsa offer strong growth, while Midtown provides stability, and North Tulsa presents opportunities for industrial related development.
Section 18Opportunities
Tulsa presents several compelling opportunities for real estate investors, driven by its balanced growth, affordability, and strategic economic diversification. First, the city's consistent population growth of 0.8 percent year over year to 422,087 residents per the US Census Bureau, coupled with steady job creation that saw 2,100 jobs added in the metropolitan area in the year ending July 2026, creates a fundamental demand for both residential and commercial properties. This demographic and economic expansion provides a stable foundation for investment.
Second, the multifamily sector offers solid performance, with metro apartment asking rents up 2.4 percent year over year to 1,061 dollars per unit and vacancy rates tightening to 5.5 percent per Kidder Mathews. The modest new supply pipeline of 1,850 units under construction is being absorbed efficiently, suggesting sustained demand. Third, Tulsa's unmatched transportation and logistics infrastructure, including Tulsa International Airport and the Port of Catoosa, makes it a premier regional distribution hub, creating strong demand for industrial properties with a tight 4.0 percent vacancy and robust rent growth. Fourth, the city's overall affordability, characterized by lower property taxes and a highly landlord friendly regulatory environment with no rent control, significantly enhances the cash flow and operational flexibility of real estate investments. Fifth, the strong performance of the single family housing market, with a city median sale price up 6.3 percent year over year to 255,000 dollars, offers opportunities for single family rental investors in a market with appreciating asset values.
Section 19Risks
Despite its significant opportunities, Tulsa carries several risks that investors must carefully consider. First, while Tulsa's economy is diversifying, its historical reliance on the energy sector means that it remains sensitive to fluctuations in oil and gas prices, which can impact job growth and overall economic stability. A downturn in the energy sector could have ripple effects across the local real estate market.
Second, the city's location in "Tornado Alley" exposes it to frequent severe weather events, including tornadoes, hail storms, and severe thunderstorms. This necessitates higher insurance premiums, typically around 2,800 dollars per year for homeowners per Insure.com, and requires specific coverage for wind and hail, which can be costly and impact overall investment returns. Third, while the industrial sector is strong, the office market, with a 12.0 percent vacancy rate, still presents challenges, particularly for older or less amenitized properties. Repositioning or redeveloping these assets may require significant capital expenditure and carries leasing risk. Fourth, while the single family market is strong, the relatively lower median household income of 60,378 dollars in the city, and a poverty rate of 17.5 percent, suggests that a significant portion of the population requires affordable housing options, which may limit the achievable rent growth for market rate products in certain areas without specific subsidies. Finally, although the supply pipeline is modest and well absorbed currently, any sudden increase in new construction without a corresponding surge in demand could lead to temporary oversupply and pressure on rents and vacancy rates.
Section 20Investor Implications
The synthesis for an accredited investor is that Tulsa is a stable, growing Sun Belt market offering attractive cash flow and appreciation opportunities, driven by its affordability, diversified economy, and landlord friendly regulations. The multifamily market, with metro asking rents up 2.4 percent year over year and vacancy at 5.5 percent, presents a compelling opportunity, particularly given its attractive cap rate of 6.5 percent. The strong absorption of new supply and consistent rent growth signals a healthy environment for residential investment.
The industrial sector is another clear winner, given Tulsa's critical role as a regional logistics hub, making it an attractive target for capital seeking high occupancy and rent growth. Retail also shows solid performance, particularly in growing suburban centers and revitalized downtown areas. Investors should meticulously verify specific property tax millage rates, as these can vary, and thoroughly assess severe weather risks, securing appropriate and comprehensive insurance coverage for wind, hail, and flood. The absence of rent control provides maximum flexibility for rental pricing and operational efficiency. The strategic selection of submarkets is crucial, with downtown and South Tulsa offering strong growth, while Midtown provides stability, and North Tulsa presents opportunities for industrial related development. As always, this analysis frames the evidence; the decision to enter any market or pursue any asset rests with the investment principals, and every figure here should be independently verified before any commitment.
Section 21Conclusion
Tulsa in the second half of 2026 is a market characterized by balanced growth and strong fundamentals, making it a reliable destination for real estate investment. Its population has grown to 422,087, and its metropolitan area added 2,100 jobs in the year ending July 2026, underpinning consistent demand. The multifamily sector is particularly strong, with rents up 2.4 percent and vacancy at 5.5 percent, with new construction being efficiently absorbed. Industrial and retail also show solid performance, driven by Tulsa's strategic transportation infrastructure. The city offers a competitive property tax environment and a highly landlord friendly regulatory framework, including the absence of rent control, which enhances operational flexibility and potential returns. However, investors must carefully assess severe weather risks and ensure adequate insurance coverage.
Sources
- US Census Bureau, Vintage 2024 Population Estimates (city, county, MSA, state) https://www2.census.gov/programs-surveys/popest/datasets/2020-2024/
- US Bureau of Labor Statistics, Tulsa, OK Metropolitan Statistical Area Employment, Hours, and Earnings (CES series SMU40461000000000001) https://www.bls.gov/regions/southwest/data/tulsa.htm
- US Bureau of Labor Statistics, Metropolitan Area Employment and Unemployment Summary, July 2026 https://www.bls.gov/news.release/metro.nr0.htm
- US Bureau of Economic Analysis, Per Capita Personal Income by County and MSA, Tulsa MSA (SAINC1P) https://www.bea.gov/data/economic-accounts/regional/saip/personal-income-by-county
- US Census Bureau, American Community Survey 2024 1 year estimates for Tulsa city, Tulsa County, Tulsa MSA, and Oklahoma state https://data.census.gov/
- Kidder Mathews, Tulsa Multifamily Market Report Q2 2026 https://kidder.com/market-reports/tulsa-multifamily-market-report/
- Apartment List, Tulsa Rent Report, September 2026 https://www.apartmentlist.com/rent-report/ok/tulsa
- Zillow, Tulsa OK Rental Market Trends, August 2026 https://www.zillow.com/rental-manager/market-trends/tulsa-ok/
- City of Tulsa Planning Department, 2024 Residential Permit Data: no official public information is available on this point, so data reported by local news from the City of Tulsa Planning Department is used as proxy.
- Kidder Mathews, Tulsa Office Market Report Q2 2026 https://kidder.com/market-reports/tulsa-office-market-report/
- Kidder Mathews, Tulsa Industrial Market Report Q2 2026 https://kidder.com/market-reports/tulsa-industrial-market-report/
- Kidder Mathews, Tulsa Retail Market Report Q2 2026 https://kidder.com/market-reports/tulsa-retail-market-report/
- Redfin, Tulsa OK Housing Market, July 2026 https://www.redfin.com/city/19323/OK/Tulsa/housing-market
- Zillow, Tulsa OK Home Values, July 2026 https://www.zillow.com/home-values/19323/tulsa-ok/
- Oklahoma Tax Commission, Property Tax and Sales Tax Information https://oklahoma.gov/tax.html
- Insure.com, Average Homeowners Insurance Cost in Oklahoma, August 2026 https://www.insure.com/home-insurance/average-cost-of-homeowners-insurance-in-oklahoma/
- FEMA, Flood Map Service Center https://msc.fema.gov/portal/home
- NOAA (NCEI), Climate Data for Tulsa, Oklahoma https://www.ncei.noaa.gov/
- NOAA (NWS), Oklahoma Tornado Statistics https://www.weather.gov/oun/tornadodata
- Oklahoma Residential Landlord and Tenant Act (OK Statutes Title 41) https://law.justia.com/codes/oklahoma/2021/title-41/
- Oklahoma Statutes Title 11, Section 22 108.1 (Rent Control Prohibition) https://law.justia.com/codes/oklahoma/2021/title-11/section-22-108-1/
- Tulsa Airports Improvement Trust, Tulsa International Airport Statistics 2025 https://www.tulsaairports.com/
- Tulsa Port of Catoosa, 2025 Cargo Statistics https://tulsaport.com/