In brief · summary: Wilmington
Wilmington is the coastal anchor of southeastern North Carolina, the seat of New Hanover County and the core of a three county metropolitan area that also includes Brunswick and Pender counties. It combines the demand drivers that investors look for in a Sun Belt secondary market, namely fast population growth, diversified employment across healthcare, financial technology, nuclear energy and a deepwater port, and a lifestyle draw that pulls in retirees and remote workers, with a set of coastal specific risks, principally hurricane exposure and a sharply rising homeowners insurance cost curve, that must be underwritten explicitly rather than waved away.
The headline fundamentals are constructive. New Hanover County's population reached 245,959 in the Census Bureau July 1, 2025 estimate, up from 225,702 at the 2020 decennial census, a gain of about 9.0% since 2020.
The Wilmington metropolitan statistical area added about 5,900 nonfarm payroll jobs between February 2025 and February 2026, an over the year growth rate of 3.1%, the highest of any metro in North Carolina. Multifamily vacancy sat near 5.8% with rent growth around 4.1% year over year, and the apartment investment market showed cap rates in the low to mid 6% range as of late 2025. The counterweights are equally concrete. Beach area homeowners insurance rates in …
Section 01Executive Summary
Wilmington is the coastal anchor of southeastern North Carolina, the seat of New Hanover County and the core of a three county metropolitan area that also includes Brunswick and Pender counties. It combines the demand drivers that investors look for in a Sun Belt secondary market, namely fast population growth, diversified employment across healthcare, financial technology, nuclear energy and a deepwater port, and a lifestyle draw that pulls in retirees and remote workers, with a set of coastal specific risks, principally hurricane exposure and a sharply rising homeowners insurance cost curve, that must be underwritten explicitly rather than waved away.
The headline fundamentals are constructive. New Hanover County's population reached 245,959 in the Census Bureau July 1, 2025 estimate, up from 225,702 at the 2020 decennial census, a gain of about 9.0% since 2020. The Wilmington metropolitan statistical area added about 5,900 nonfarm payroll jobs between February 2025 and February 2026, an over the year growth rate of 3.1%, the highest of any metro in North Carolina. Multifamily vacancy sat near 5.8% with rent growth around 4.1% year over year, and the apartment investment market showed cap rates in the low to mid 6% range as of late 2025.
The counterweights are equally concrete. Beach area homeowners insurance rates in New Hanover County are rising a cumulative 31.9% across 2025 and 2026 under a settlement between the North Carolina Department of Insurance and the North Carolina Rate Bureau, the Port of Wilmington's container volumes have fallen sharply since mid 2025, and the January 2025 countywide revaluation lifted assessed values roughly 12.7%, raising tax bills even though the county rate held flat. It does not recommend any transaction.
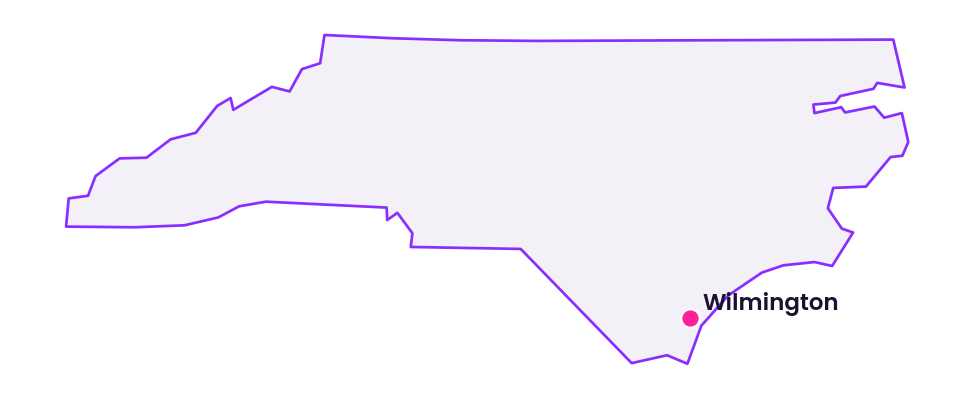
Section 02Population and Migration
Population growth is Wilmington's single strongest fundamental, and it operates on two geographies that investors should keep separate. The city of Wilmington itself held roughly 126,809 residents in the Census Bureau July 1, 2025 estimate, while New Hanover County, the more reliable unit for market sizing because so much rental and for sale product sits outside the city limits in Ogden, Porters Neck and Monkey Junction, reached 245,959 in the same July 1, 2025 estimate.
The trajectory is the story. The table below sets the decennial base against the most recent estimate.
| Geography | 2020 Census | July 1, 2025 estimate | Change | Percent change |
|---|---|---|---|---|
| New Hanover County | 225,702 | 245,959 | +20,257 | +9.0% |
| Wilmington city | 115,451 | 126,809 | +11,358 | +9.8% |
Sources: U.S. Census Bureau 2020 decennial count and V2025 population estimates dated July 1, 2025 for the county and city,. The percent change is close to the QuickFacts figure measured from the April 1, 2020 estimates base.
The growth is driven overwhelmingly by net in migration rather than natural increase, which is characteristic of a coastal retirement and lifestyle market. New Hanover skews older and wealthier than the state, and its per capita income of $48,592 in the Census Bureau ACS 2020 to 2024 file reflects an inflow of households arriving with accumulated assets rather than entry level wage earners. For an investor, the practical read is that demand for both rental and for sale housing is fed by people moving in with capital and by adult children and workforce households priced out of coastal ownership, which supports the workforce rental thesis discussed in the Rents section. No official public figure isolating the exact split between domestic migration, international migration and natural change for a single year at the city level was located, so the county migration pattern is the most defensible proxy.
Section 03Jobs and Economic Anchors
The Wilmington metro's labor market is both fast growing and unusually diversified for a city of its size. Between February 2025 and February 2026 the metro added approximately 5,900 nonfarm payroll jobs, a 3.1% over the year gain that led all North Carolina metros. New Hanover County specifically posted the largest over the year employment gain among the 14 largest counties in the state at 2.5% from September 2024 to September 2025. The county unemployment rate was approximately 3.5% in March 2025 and had been as low as 2.8% in December 2024, both consistent with a tight labor market.
Growth by sector is concentrated in exactly the industries that support housing demand. The table shows the leading over the year sector moves for the metro.
| Sector | Over the year change (Feb 2025 to Feb 2026) |
|---|---|
| Leisure and hospitality | +8.2% |
| Education and health services | +4.3% |
| Total nonfarm | +3.1% |
Source: North Carolina Department of Commerce and BLS as reported for the Wilmington MSA,. Total nonfarm employment for the metro was roughly 195,600 on a seasonally adjusted basis in December 2025, with leisure and hospitality near 31,200.
The employer base is what distinguishes Wilmington from a pure tourism town. The anchors span healthcare, clinical research, nuclear energy, financial technology and advanced manufacturing.
| Employer | Sector | Approximate employment |
|---|---|---|
| Novant Health New Hanover Regional Medical Center | Healthcare | 6,000+ |
| Thermo Fisher Scientific / PPD | Clinical research | 2,000+ |
| GE Hitachi Nuclear Energy / GE Vernova | Nuclear energy | 1,800+ |
| nCino | Financial technology | 1,500+ |
| Corning | Fiber optic manufacturing | 1,200+ |
| University of North Carolina Wilmington | Higher education | 1,000+ |
| New Hanover County Schools | Public education | 1,000+ |
Source: regional employer compilations citing company and Wilmington Business Development figures,; these headcounts are approximate and carry a probable confidence label rather than confirmed because they are drawn from secondary compilations rather than a single primary employer census. Live Oak Bank and MegaCorp Logistics are additional homegrown anchors, and the film and studio production sector adds episodic employment that is real but hard to size precisely. The strategic point for an investor is diversification: no single sector dominates payrolls, healthcare and education provide a recession resistant floor, and financial technology and nuclear energy add higher wage upside.
Section 04Income
Income levels in New Hanover County sit modestly above the North Carolina median and slightly below the national median, with a wealth profile skewed by retiree in migration. The verified county figures are summarized below.
| Income measure (New Hanover County) | Value | Source and scope |
|---|---|---|
| Median household income | $75,166 | Census Bureau QuickFacts, ACS 2020 to 2024 |
| Median household income | $77,098 | Small Area Income and Poverty Estimates, 2024 |
| Per capita income | $48,592 | Census Bureau QuickFacts, ACS 2020 to 2024 |
| Median value of owner occupied home | $387,800 | Census Bureau QuickFacts, ACS 2020 to 2024 |
The modest gap between the ACS five year median of $75,166 and the SAIPE 2024 estimate of $77,098 is a methodological artifact rather than a contradiction, and both place county income in the mid $70,000s. Per capita income of $48,592 is comparatively high for the region and reflects the concentration of asset rich, often older, households.
The investment relevant tension is between income and housing cost. A median household income in the mid $70,000s supports a sustainable gross rent in the neighborhood of $1,900 per month at a 30% cost burden ratio, which sits very close to the metro's actual median asking rent, and it supports a for sale price below the county's median owner occupied home value of $387,800 for the ACS 2020 to 2024 period, a level current market sale prices have already surpassed as shown in the Single Family section. That gap between local incomes and local home prices is precisely what sustains rental demand: many households that would prefer to own cannot clear the coastal price and insurance hurdle and rent instead. No reliable single year city level median household income figure distinct from the county was verified, so the county figure is used as the proxy for the city.
Section 05Housing and Multifamily
The county's occupied housing stock totaled roughly 104,856 households in the ACS 2020 to 2024 file, of which 61.4% were owner occupied and 38.6% renter occupied. That renter share, well above what a purely retiree narrative would suggest, is elevated by the university, by tourism and hospitality workers, and by workforce households priced out of ownership. It is meaningfully more renter heavy than the nation as a whole.
On the apartment side, the metro entered 2026 with vacancy near 5.8%, roughly in line with the national average, while absorbing a wave of new Class A deliveries concentrated in the Porters Neck, Hampstead and Ogden corridors. Steady household formation and retiree migration have absorbed most of that supply, which is the central bull case for the sector: new product is being leased rather than left dark. The strongest fundamentals sit in workforce oriented Class B communities in Leland and Ogden, where the supply of moderately priced units remains thinner than in the luxury tier. The practical implication is that the risk of oversupply is concentrated in the top of the market, in luxury Class A, while the workforce and moderate income segments face tighter competition and firmer occupancy.
Section 06Rents
Asking rents in Wilmington have continued to grow even as national multifamily rent growth has flattened toward roughly 0.5% for 2026. Metro apartment rent growth was reported near 4.1% year over year, a clear outperformance of the national figure and a signal of genuine demand pressure rather than incentive driven leasing. The deepest demand sits in the $1,150 to $1,600 monthly band, where workforce renters concentrate and where new supply has been thinnest.
Across all property types, including single family rentals and condominiums, the picture is a bit higher. The table shows recent asking rent points for the city.
| Rent measure (Wilmington, 2026) | Amount |
|---|---|
| Median asking rent, all property types (Zillow) | $1,985 |
| One bedroom | $1,395 |
| Two bedroom | $1,696 |
| Three bedroom | $2,228 |
| Four or more bedroom | $2,696 |
Source: Zillow rental data and aggregated listing sources for Wilmington,. A separate mid 2026 reading placed the all bedroom median nearer $1,734, and the spread between the two reflects differences in sample and methodology rather than a data error. For context, the Census Bureau reports a New Hanover County median gross rent of $1,417 for the ACS 2020 to 2024 period, a measure of rent actually paid across all renter households rather than current advertised asking rent. For underwriting, the conservative course is to anchor apartment pro formas to the CoStar tracked professionally managed rent set rather than to the higher listing site medians, which include single family houses that command a premium.
Section 07Vacancy
Apartment vacancy in the metro was approximately 5.8% entering 2026, close to the national average and consistent with a market that is digesting new supply without distress. The commercial picture diverges sharply by property type and is discussed in full in the commercial section, but the headline vacancies bear repeating here for context: retail vacancy was an extraordinarily tight 1.4% in the first quarter of 2026, industrial vacancy was about 5.3%, and office vacancy was elevated at 17.3%. The clean read is that residential and retail space is scarce and well absorbed, industrial is healthy with some new supply pressure, and office remains the weak asset class, mirroring the national office malaise. No official public figure isolating single family rental vacancy at the city level was located; the county homeownership and renter share figures above are the most defensible proxy for tenure mix.
Section 08Supply Pipeline
The supply pipeline is the variable most worth watching, because it is the mechanism by which strong rent growth could erode. Residential permitting for the metro remains active. The Wilmington MSA authorized 542 new private housing units in December 2025 and roughly 653 units in January 2026 on a seasonally adjusted basis, a pace that annualizes into several thousand units a year across single family and multifamily structures combined, and New Hanover County alone recorded 2,332 building permits in 2025. On the apartment side specifically, the recent deliveries have clustered in the Class A tier along the Porters Neck, Hampstead and Ogden corridors, which is why the oversupply risk is concentrated at the luxury top of the market while the workforce and Class B segments stay tight.
The disciplined interpretation is that Wilmington is building, but demand from in migration has so far kept pace, holding vacancy near the national average even as new units deliver. The risk case is straightforward: if migration slows while the Class A pipeline continues to deliver, the luxury segment would soften first through concessions and flat rents, and only later would that pressure reach the Class B and workforce tiers. No single consolidated public count of apartment units currently under construction at the city level was located that meets the sourcing standard; the permit series and the corridor concentration pattern are the most defensible available proxies.
Section 09Single Family Homes
The for sale market is firmly a seller's market with prices grinding higher off a high base. The county's median owner occupied home value was $387,800 in the ACS 2020 to 2024 file, and 2026 transaction data for the city shows median sale prices in the mid $400,000s to high $400,000s depending on the month and source, well above the blended ACS value because current sales capture the newest and highest priced stock.
| Wilmington city median sale price, 2026 | Value |
|---|---|
| March 2026 | $444,099 |
| May 2026 | $479,995 |
| July 2026 | $461,500 |
| Year to date through March 2026 | $440,000 |
Source: Redfin and aggregated listing data for Wilmington,. The year to date median of $440,000 through March 2026 was up 3.5% from $425,000 in the same period of 2025. Homes were selling in roughly 54 days on average versus 49 days a year earlier, and demand remained brisk with pending sales close behind active inventory, all consistent with a market that has cooled from its frenzied peak but has not turned.
For the single family rental angle, the investment logic is anchored by the gap between a median household income in the mid $70,000s and current sale prices in the mid $400,000s. That affordability gap keeps a meaningful pool of would be buyers in the rental market, and single family houses command a rent premium over apartments, with Zillow's all property type median near $1,985 pulled up by detached homes. The build to rent and scattered site single family rental strategies are supported by this dynamic, though investors must underwrite the same insurance and tax escalation that owner occupants face, discussed below. Rising insurance and the January 2025 revaluation are the two costs most likely to compress single family rental yields, and both are quantifiable rather than speculative.
Section 10Commercial Real Estate and Retail Centers
The commercial market splits cleanly into a very strong retail segment, a healthy industrial segment absorbing new supply, and a weak office segment. The table summarizes the first quarter 2026 readings.
| Property type (Wilmington MSA, Q1 2026) | Vacancy | Asking rent | Cap rate |
|---|---|---|---|
| Retail | 1.4% | not separately reported | not separately reported |
| Industrial | 5.3% | $10.10 PSF | 8.40% |
| Office | 17.3% | $25.91 PSF | not separately reported |
Source: CoStar and Lee Associates data as reported for the Wilmington market,.
Retail is the standout. A 1.4% vacancy rate in the first quarter of 2026 sits below both the five year average of 1.8% and the ten year average of 2.2%. Grocery anchored neighborhood centers are the natural beneficiary of this scarcity, because population growth pulls in the daily needs retail that these centers house, and the near absence of vacancy gives landlords pricing power on renewals. New retail construction has lagged household growth, which is the core of the retail bull case here.
Industrial is healthy but no longer frictionless. Vacancy rose to about 5.3% as new logistics and distribution space delivered, average asking rents held near $10.10 per square foot, sale prices softened toward $90 per square foot, and cap rates rose to about 8.40%, signaling that investors are pricing in the new supply and a more cautious posture. Industrial demand is tied heavily to the Port of Wilmington and regional distribution, which makes the port's recent volume decline, covered in the infrastructure section, a genuine risk to watch for this asset class.
Office is the clear laggard. Vacancy stood at 17.3% in the first quarter of 2026, essentially flat from year end 2025, while direct asking rents fell roughly 310 basis points over the year to $25.91 per square foot. This mirrors the national office correction and argues for caution on office exposure absent a specific value add or medical office thesis, where healthcare tenant demand from Novant and the broader medical sector provides a more durable floor than general purpose office.
Section 11Transactions and Capital Markets
Apartment investment activity in the metro firmed through late 2025 after a cautious stretch. Multifamily cap rates compressed to roughly 6.28% in the fourth quarter of 2025 from about 6.3% in the second quarter, a small move that nonetheless signals renewed buyer interest. Per unit pricing followed the same shape.
| Wilmington multifamily metric | Q2 2025 | Q4 2025 |
|---|---|---|
| Average cap rate | 6.30% | 6.28% |
| Average sale price per unit | $177,478 | $179,245 |
Source: Lee Associates Wilmington multifamily market overviews,. Second quarter per unit pricing of $177,478 was itself down from $186,843 earlier, reflecting the recalibration investors made under vacancy pressure before the market steadied. Prospective multifamily cap rates for 2026 have been quoted in the 5.50% to 6.25% band, which would be tighter still if it holds; that forward figure carries an unverified label because it is a projection rather than a closed transaction average. These local yields compare favorably to national apartment cap rates, which is the essence of the secondary market yield premium that draws capital to markets like Wilmington. National apartment sales volume rose in 2025, indicating that the broader capital markets backdrop for apartments was improving into 2026, though a specific national dollar volume from a named public source is not stated here.
Section 12Taxes
Property tax in New Hanover County is levied at a countywide rate of 30.6 cents per $100 of assessed value for fiscal year 2025 to 2026, unchanged from the prior year. Property located inside the city of Wilmington carries an additional municipal rate layered on top of the county rate, so a city parcel's total bill is the sum of both; the specific city millage for the current year was not located in a form that meets the sourcing standard and should be confirmed against the City of Wilmington adopted budget before underwriting a city parcel.
The more consequential development for investors is the revaluation. New Hanover reassesses on a four year cycle, shorter than the state's default eight year cycle, and the most recent revaluation took effect January 1, 2025. That revaluation lifted assessed values materially, with Wilmington property values reported up about 12.7% year over year. The mechanical result is that even with a flat rate, tax bills rose in proportion to the reassessment, and any acquisition underwriting that assumes the seller's historical tax expense will understate the go forward liability. North Carolina also reassesses to market on transfer through the revaluation cycle rather than at each sale, which softens the acquisition year shock relative to some states but does not eliminate the upward drift.
Section 13Insurance
Insurance is the cost line most likely to surprise an investor new to coastal North Carolina, and it is rising on a defined schedule. After the North Carolina Rate Bureau initially requested an average statewide homeowners increase of 42.2%, with proposed increases as high as 99.4% in some coastal territories, the North Carolina Department of Insurance reached a settlement that capped the increases and prohibited the Rate Bureau from requesting further hikes until June 2027. The settled increases are tiered by territory, and New Hanover County's beach areas sit in the highest tier.
| Territory | 2025 increase | 2026 increase | Two year cumulative |
|---|---|---|---|
| Beach areas (New Hanover, Brunswick, Carteret, Onslow, Pender) | +16.0% | +15.9% | +31.9% |
| Eastern tri county region | +10.5% | +10.1% | approximately +21.6% |
| Western areas | +5.0% | +4.8% | approximately +10.0% |
Source: North Carolina Department of Insurance settlement figures as reported,. The statewide average of the settlement worked out to roughly 15% over the two years, but coastal owners face roughly double that.
Two further points matter. First, flood damage is excluded from standard homeowners policies, so any property with meaningful flood exposure requires a separate National Flood Insurance Program policy or private flood coverage, an additional and growing cost line rather than a rounding item. Second, the two year rate certainty from the settlement is useful for pro forma modeling through mid 2027, but the June 2027 expiration means investors should assume continued upward pressure beyond the modeled horizon rather than a plateau. Insurance, in short, is not a reason to avoid Wilmington, but it is a line item that must be sized at current coastal rates and escalated, not inherited from a seller's stale figure.
Section 14Landlord Tenant and Regulatory Environment
North Carolina is broadly regarded as a landlord favorable state, and that legal backdrop is part of the investment case for Wilmington. The state has no statewide rent control and preempts local rent control ordinances, so the rent growth captured in the market data is not subject to a statutory cap. Eviction procedures for nonpayment are comparatively fast by national standards, operating through the small claims summary ejectment process, which shortens the time and cost of recovering possession relative to tenant favorable states. Security deposit limits and notice requirements are set by state statute and are conventional rather than onerous.
At the local level, the relevant regulatory frictions are on the development and short term rental side rather than on conventional leasing. The City of Wilmington and New Hanover County administer zoning, permitting and short term rental registration, and short term rental rules in particular have tightened in coastal North Carolina as communities balance tourism revenue against neighborhood impact. An investor pursuing a short term rental strategy should treat the local registration and zoning regime as a live variable rather than a settled one.
Section 15Infrastructure
Wilmington's infrastructure story centers on the Port of Wilmington, operated by the North Carolina State Ports Authority, which is both a major economic anchor and, at present, a source of concern. Container volumes have fallen sharply: cargo container throughput dropped by roughly 30% starting in July 2025, when the largest neo Panamax class vessels using the Panama route stopped calling at Wilmington, following earlier declines of about 8% from 2023 to 2024 and roughly 2% from 2024 to 2025. Port leadership has attributed the softness to tariffs, broad economic uncertainty and a general pullback in United States consumer spending. This matters directly to the industrial and logistics thesis, because port throughput is a key demand driver for regional distribution space, and it is the single clearest downside data point in the current market.
The offsetting infrastructure investment is real. A $22.5 million intermodal rail yard expansion, aided by an $18 million federal RAISE grant, was on track for completion by the end of the June 2026 fiscal year, adding four working tracks totaling about 5,000 feet and lifting the port's intermodal rail throughput capacity above 150,000 TEUs annually from a base of roughly 14,000 container movements by rail each year. Beyond the port, the region is served by Interstate 40, which connects Wilmington to the state interior and the national highway network, and by Wilmington International Airport, which has expanded service in recent years. The investment read is that the physical capacity to grow exists, but the near term volume decline at the port is a genuine caution flag for industrial exposure specifically.
Section 16Climate and Physical Risks
Coastal exposure is the defining physical risk. Wilmington sits at the mouth of the Cape Fear River, and the Cape Fear estuary amplifies storm surge risk in downtown and near river locations, a dynamic demonstrated vividly when Hurricane Florence in 2018 flooded low lying areas and temporarily cut the city off by road. The FEMA flood map framework for the area uses Zone X for the lowest risk inland areas, Zone AE for riverine and inland flood risk areas, and Zone VE for the highest risk oceanfront and surge exposed areas, with the barrier island beaches sitting in the AE and VE zones. A climate risk screen of the city found that in 30 of 76 census tracts, more than half of buildings carry significant risk from a combination of storm surge, high tide flooding, surface flooding and riverine flooding, which quantifies just how widespread water risk is across the built environment.
The investment implication is that flood zone and elevation certificate diligence is not optional here; it is central to underwriting. Two otherwise comparable properties can carry materially different insurance costs and resale liquidity based solely on their flood zone designation, and the trend in both insurance pricing and storm frequency argues for conservatism. Properties in Zone X inland command a durable advantage on both insurance cost and buyer pool, and that advantage is likely to widen rather than narrow as coastal risk repricing continues.
Section 17Neighborhoods and Submarkets
The market divides into several distinct submarkets with different investment characters. Downtown and the historic district along the Cape Fear River offer walkability, tourism demand and short term rental potential, but they also carry the highest surge exposure and the greatest short term rental regulatory scrutiny. The established close in neighborhoods and the beach communities of Wrightsville Beach, Carolina Beach and Kure Beach represent the premium, amenity rich and highest cost tier, with the strongest short term rental economics and the highest flood insurance burden, since much of the beach stock sits in VE and AE zones.
The growth corridors are where much of the recent apartment and single family development has concentrated. Ogden and Porters Neck to the north and northeast, along with Hampstead just over the Pender County line, have absorbed the bulk of new Class A apartment deliveries and new single family construction, drawn by developable land and proximity to employment and retail. Across the river, Leland in Brunswick County has become the workforce affordability release valve, capturing renters and buyers priced out of New Hanover proper, and it anchors the Class B workforce rental thesis. Monkey Junction to the south is a similar value oriented growth node. The practical takeaway is that the luxury oversupply risk is concentrated in the northern Class A corridors, the tightest workforce rental fundamentals sit in Leland and Ogden, and the highest insurance and surge costs, alongside the strongest tourism economics, sit at the beaches.
Section 18Opportunities
The clearest opportunity is workforce and Class B multifamily in Leland, Ogden and the value oriented corridors, where rent growth near 4.1% year over year has outpaced the national market, supply has been thinner than in the luxury tier, and the gap between local incomes and coastal home prices keeps the renter pool deep and durable. A second opportunity is grocery anchored neighborhood retail, where a 1.4% vacancy rate against a growing population gives landlords rare pricing power and where new construction has lagged household formation. A third is the single family rental and build to rent strategy, supported by the affordability gap between a median household income in the mid $70,000s and a median owner occupied home value of $387,800 in the ACS 2020 to 2024 file, with current sale prices higher still, provided the investor underwrites insurance and tax escalation honestly. A fourth, more selective, opportunity is medical office and healthcare adjacent space, where Novant Health and the broader medical sector provide tenant demand that the general office market lacks. Each of these leans on the same underlying engine, namely population and job growth that led the state, rather than on financial engineering.
Section 19Risks
The risks are equally concrete and should be underwritten explicitly rather than assumed away. First is insurance cost escalation: beach area homeowners rates are rising a cumulative 31.9% across 2025 and 2026, flood coverage is a separate and growing cost, and the rate certainty ends in June 2027, so the trend line points up. Second is physical climate risk, with widespread surge and flood exposure across a majority of buildings in 30 of 76 city census tracts and a demonstrated history of catastrophic hurricane flooding. Third is the tax step up from the January 2025 revaluation, which lifted assessed values roughly 12.7% and raises go forward tax liability even at a flat rate. Fourth is luxury multifamily oversupply, concentrated in the northern Class A corridors, which could soften top tier rents through concessions if migration slows while the pipeline delivers. Fifth is the port volume decline of roughly 30% since mid 2025, which directly threatens the industrial and logistics demand thesis. Sixth is office weakness, with 17.3% vacancy and falling rents, which argues against general purpose office exposure. None of these individually disqualifies the market, but collectively they demand conservative insurance, tax and exit cap rate assumptions.
Section 20Investor Implications
For an accredited investor weighing Wilmington, the market presents as a genuine Sun Belt growth story with a coastal risk overlay that is quantifiable and therefore underwritable. The demand side is strong and durable: population up about 9% since 2020, the fastest metro job growth in the state at 3.1% year over year, a diversified employer base spanning healthcare, clinical research, nuclear energy and financial technology, and apartment rent growth near 4.1% that has beaten the national market. The yield is attractive relative to primary markets, with multifamily cap rates in the low to mid 6% range as of late 2025 and firming buyer interest.
The discipline the market demands is on the cost and risk side. An underwriting model that inherits a seller's stale insurance figure, ignores the 31.9% two year coastal insurance escalation, assumes the pre revaluation tax bill, and applies a primary market exit cap rate will overstate returns. The defensible approach anchors rents to CoStar tracked professional data rather than listing site medians, sizes insurance at current coastal rates with escalation past June 2027, uses the post revaluation tax basis, concentrates on workforce Class B and grocery anchored retail where fundamentals are tightest, treats luxury Class A and general office with caution, and performs flood zone and elevation diligence on every property. Whether Wilmington is a yes turns on price: at cap rates and per unit prices that leave room for the insurance and tax cost curve, the growth fundamentals support the case; at pricing that assumes those costs stay flat, they do not. That is a decision for the investment principals, not for this review.
Section 21Conclusion
Wilmington is a fast growing coastal secondary market with the demand fundamentals investors seek and a specific, quantifiable set of coastal risks they must price. Population and job growth lead the state, multifamily and retail fundamentals are tight, and apartment yields are attractive relative to primary markets. The offsetting factors, principally a steep two year coastal insurance escalation, a fresh revaluation driven tax step up, widespread flood and surge exposure, a sharp recent decline in port container volumes, and a weak office segment, are all measurable and can be built into a conservative model. The market rewards investors who underwrite the cost curve honestly and concentrate on the workforce rental and neighborhood retail segments where fundamentals are strongest, and it punishes those who treat coastal insurance and taxes as static. The substance points to a market that is a yes at disciplined pricing and a no at pricing that ignores its coastal cost structure; the entry decision itself rests with the investment principals.
Sources
- U.S. Census Bureau, QuickFacts, New Hanover County and Wilmington city (V2025 population estimates and ACS 2020 to 2024 income, housing, and value data), https://www.census.gov/quickfacts/fact/table/newhanovercountynorthcarolina,wilmingtoncitynorthcarolina
- U.S. Census Bureau, American Community Survey 2024 profile via Census Reporter, New Hanover County, http://censusreporter.org/profiles/05000US37129-new-hanover-county-nc/
- USAFacts, New Hanover County population, https://usafacts.org/answers/how-many-people-live-in-the-us/county/new-hanover-county-nc/
- U.S. Census Bureau, Small Area Income and Poverty Estimates, New Hanover County (via FRED), https://fred.stlouisfed.org/series/MHINC37129A052NCEN
- U.S. Bureau of Labor Statistics, Local Area Unemployment Statistics, New Hanover County (via FRED), https://fred.stlouisfed.org/series/NCNEWH9URN
- U.S. Bureau of Labor Statistics, County Employment and Wages, North Carolina, https://www.bls.gov/regions/southeast/news-release/countyemploymentandwages_northcarolina.htm
- North Carolina Department of Commerce, statewide and metro employment releases, https://www.commerce.nc.gov/supplemental-release-march-2026-statewide-employment-numbers/open
- WilmingtonBiz, Wilmington metro job growth, https://www.wilmingtonbiz.com/more_news/2026/04/30/wilmington_outpaces_raleigh_charlotte_in_job_growth_rate/27443
- U.S. Bureau of Labor Statistics, Wilmington MSA nonfarm employment series (via FRED), https://fred.stlouisfed.org/series/WILM937NA
- Roth Capital and NC Career Coast, Wilmington metro major employers, https://rothcapital.com/industrial/top-employers-in-the-wilmington-metro-healthcare-fintech-and-nuclear-energy/
- Wilmington Business Development, New Hanover County top employers, https://www.wilmingtonbusinessdevelopment.com/wp-content/uploads/NHCTopEmployers215.pdf
- Zillow, Wilmington NC home values and rental market trends, https://www.zillow.com/home-values/21320/wilmington-nc/
- Zillow Rental Manager, Wilmington NC average rental price, https://www.zillow.com/rental-manager/market-trends/wilmington-nc/
- Redfin, Wilmington NC housing and rental market data (as reported), https://www.redfin.com/city/18894/NC/Wilmington/housing-market
- CoStar and Lee Associates, Wilmington NC multifamily and commercial market data (as reported), https://www.lee-associates.com/wp-content/uploads/2026/01/2025-Q4-Wilmiington-NC-Multifamily.pdf
- Lee Associates, Wilmington NC Q1 2026 industrial report, https://www.lee-associates.com/raleigh/wp-content/uploads/sites/64/2026/04/2026-Q1-Wilmington-NC-Industrial.pdf
- WilmingtonBiz Magazine, commercial real estate trends 2026, https://www.wilmingtonbiz.com/wilmingtonbiz_magazine/2026/04/13/trends_to_watch_commercial_real_estate/27351
- Commercial Lending Solutions, Wilmington commercial market and cap rate compilation (as reported), https://clscre.com/blog/cre-market-report-wilmington-nc-2026.html
- Yardi Matrix, national multifamily 2026 outlook, https://www.yardimatrix.com/blog/national-multifamily-market-report/
- U.S. Census Bureau, new private housing units authorized by building permits, Wilmington MSA (via FRED), https://fred.stlouisfed.org/series/WILM937BPPRIV
- New Hanover County, adopted fiscal year 2025 to 2026 budget, https://www.nhcgov.com/2784/Fiscal-Year-2025-2026
- New Hanover County Tax Department, real property revaluation, https://tax.nhcgov.com/329/Real-Property-Revaluation
- Port City Daily, coastal homeowners insurance rate increases, https://portcitydaily.com/latest-news/2025/01/25/homeowner-insurance-rates-to-increase-in-beach-regions-up-to-31-9-in-next-two-years/
- NC Newsline, North Carolina homeowners insurance settlement, https://ncnewsline.com/briefs/north-carolinians-to-see-an-average-15-rate-increase-for-homeowners-insurance-over-two-years/
- New Hanover County, flooding and flood zone information, https://www.nhcgov.com/213/Flooding
- ClimateCheck, Wilmington NC climate hazard ratings, https://climatecheck.com/northcarolina/wilmington
- North Carolina State Ports Authority, port news and volumes, https://ncports.com/about-the-ports/news/north-carolina-ports-delivers-strong-finish-to-calendar-year/
- WHQR, Port of Wilmington container volume coverage, https://www.whqr.org/local/2026-08-25/ask-a-journalist-whats-going-on-with-container-ships-at-the-port-of-wilmington
- WECT, Port of Wilmington intermodal rail yard expansion, https://www.wect.com/2026/03/03/port-wilmington-intermodal-rail-yard-expansion-track-june-completion/