In brief · summary: Alabama
Alabama State Real Estate Market Review
Section 01Executive Summary
Alabama combines steady population and income growth, a diversified job base, and relatively affordable housing costs with meaningful exposure to manufacturing, energy, and climate related risks. The resident population series compiled by the Federal Reserve Bank of St. Louis from U.S. Census Bureau estimates shows that the state’s population increased from 4,891.628 thousand persons in 2018 to 5,193.088 thousand persons in 2025, measured in thousands of persons as of July 1. Over the same period, per capita personal income, based on Bureau of Economic Analysis data, increased from 41,324 dollars in 2018 to 59,677 dollars in 2025, in current dollars.
Labor markets are tight with low unemployment and modest job growth. According to the Bureau of Labor Statistics, the seasonally adjusted statewide unemployment rate rose from 2.7 percent in January 2026 to 3.2 percent in June 2026, with total nonfarm employment increasing from 2,202.9 thousand jobs in January to 2,215.4 thousand in June and 12 month employment growth improving from 0.3 percent to 0.9 percent over the same period.
Housing fundamentals remain solid. The All Transactions House Price Index for Alabama, compiled by the Federal Housing Finance Agency, increased from 307.33 in the first quarter of 2018 to 540.51 in the first quarter of 2026, on an index where the first quarter of 1980 equals 100; this history is not indicative of future results. HousingHandbook, using population weighted Zillow data, reports a typical and median home value of 229,315 dollars, a median rent of 1,431 dollars, a population of 5,086,600 residents, and 656 ZIP codes statewide. Redfin reports that in May 2026 the statewide median sale price for all home types was 307,408 dollars, up 4.2 percent year over year, with 30,417 homes for sale, up 6.8 percent year over year, and 16.7 percent of homes selling above list price, 0.3 percentage points higher than a year earlier.
Alabama is also served by a state housing finance authority that has, over more than four decades, supported homeownership and affordable rental housing across the state through mortgage assistance and tax credit programs. For accredited investors, Alabama offers a combination of income growth, moderate home prices, and an active construction pipeline, with opportunities in multifamily, single family rentals, industrial and logistics, and necessity retail assets, alongside risks tied to sectoral employment shifts, insurance and resilience needs in coastal and tornado prone areas, and localized policy variation.
Section 02Population and Migration
Alabama’s population has grown steadily but not rapidly over the last several years. The resident population, measured in thousands of persons as of July 1, was 4,891.628 thousand in 2018, 4,907.965 thousand in 2019, 5,032.962 thousand in 2020, 5,050.058 thousand in 2021, 5,076.868 thousand in 2022, 5,117.850 thousand in 2023, 5,163.055 thousand in 2024, and 5,193.088 thousand in 2025. These figures show that Alabama added approximately 301.460 thousand persons between 2018 and 2025, with a notable step up between 2019 and 2020 and continued incremental gains thereafter.
HousingHandbook’s statewide Alabama profile, drawing on American Community Survey data for population weights, reports a population of 5,086,600 residents and coverage of 656 ZIP codes. That snapshot aligns closely with the Census based values around 2022 and 2023 and reinforces the picture of a mid sized, steadily growing state.
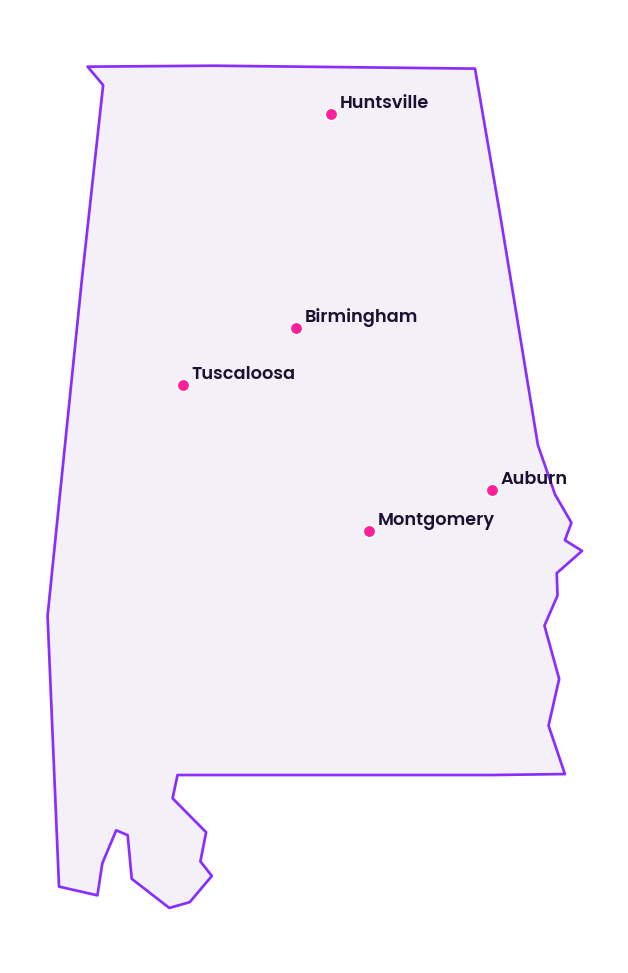
Current, detailed statewide public data decomposing Alabama’s population change into domestic migration, international migration, and natural increase were not accessible in a parsable format in this environment. As a result, this review does not present explicit net in migration or out migration figures. Qualitatively, the combination of gradual overall growth and the presence of expanding metropolitan areas like Huntsville, Birmingham and Hoover, Mobile, and Montgomery suggests that certain regions are attracting residents within and beyond the state, even as some rural counties may face stagnation or decline.
For investors, this demographic backdrop implies a generally stable base of housing demand, with particular strength in metropolitan corridors and university and industrial hubs. Population growth is sufficient to support new development in select markets but not so rapid as to mask mispricing or overbuilding in weaker submarkets.
Section 03Jobs and Economic Anchors
Alabama’s employment base in mid 2026 reflects low unemployment and modest but improving job growth across a diverse set of sectors. According to the Bureau of Labor Statistics, the seasonally adjusted statewide civilian labor force was 2,387.6 thousand persons in January 2026, 2,386.3 thousand in February, 2,384.1 thousand in March, 2,378.4 thousand in April, 2,374.4 thousand in May, and 2,370.8 thousand in June. Employment over the same period was 2,323.6 thousand persons in January, 2,321.5 thousand in February, 2,318.6 thousand in March, 2,311.3 thousand in April, 2,302.4 thousand in May, and 2,294.1 thousand in June. Unemployment increased from 64.1 thousand persons in January to 76.6 thousand in June 2026, and the unemployment rate rose from 2.7 percent in January through March to 2.8 percent in April, 3.0 percent in May, and 3.2 percent in June.
Total nonfarm payroll employment was 2,202.9 thousand jobs in January 2026, 2,202.7 thousand in February, 2,205.1 thousand in March, 2,208.7 thousand in April, 2,214.0 thousand in May, and 2,215.4 thousand in June, all seasonally adjusted. The 12 month change in total nonfarm employment improved from 0.3 percent in January and February to 0.5 percent in March, 0.6 percent in April, 0.7 percent in May, and 0.9 percent in June 2026, indicating modest but accelerating year over year job growth.
Sector level data highlight Alabama’s industrial mix. Mining and logging employment was 9.3 thousand jobs in January 2026 and 9.7 thousand in June, with 12 month changes progressing from negative 1.1 percent in January to 4.3 percent in June, reflecting gradual improvement in resource related activity. Construction employment increased from 111.0 thousand jobs in January to 115.2 thousand in June 2026, with 12 month changes rising from 2.6 percent to 5.3 percent, underscoring the strength of building and infrastructure activity. Manufacturing employment, by contrast, was relatively flat to slightly down, at 283.2 thousand jobs in January and 281.9 thousand in June 2026, with 12 month changes around negative 0.6 to negative 0.7 percent, indicating mild contraction in factory jobs. Trade, transportation, and utilities, a key logistics and distribution sector, employed 404.0 thousand people in January and 402.9 thousand in June 2026, with 12 month changes ranging from approximately negative 1.5 to negative 1.0 percent, suggesting some softening in these activities. Education and health services employment grew from 265.1 thousand jobs in January to 268.8 thousand in June 2026, with 12 month changes increasing from 0.6 percent to 2.1 percent, while leisure and hospitality employment rose from 217.2 thousand to 219.4 thousand jobs over the same period, with 12 month changes between 2.1 and 2.6 percent.
This mix reinforces Alabama’s identity as a manufacturing, logistics, and services economy with growing construction, education and health services, and leisure and hospitality segments, and a manufacturing sector facing slight headwinds. For real estate investors, job growth in construction, health care, and services supports demand for housing and neighborhood commercial assets, while modest declines in manufacturing and parts of trade and transportation argue for selectivity around properties tied to specific employers or subsectors.
Section 04Income
Income growth in Alabama has been meaningful over the last decade, supporting housing affordability and consumer demand. According to the Bureau of Economic Analysis, per capita personal income, in current dollars, was 41,324 dollars in 2018, 42,998 dollars in 2019, 45,873 dollars in 2020, 50,630 dollars in 2021, 51,690 dollars in 2022, 54,610 dollars in 2023, 57,251 dollars in 2024, and 59,677 dollars in 2025. Between 2018 and 2025, per capita personal income increased by 18,353 dollars, reflecting wage gains, transfer payments, and other sources of personal income. The particularly strong growth between 2020 and 2021, from 45,873 to 50,630 dollars, mirrors national patterns during the recovery from the pandemic and the associated policy response.
When paired with the resident population series, which shows population growing from 4,891.628 thousand to 5,193.088 thousand persons over the same years, these income trends point to rising aggregate purchasing power in the state. Compared with the HousingHandbook reported median home value of 229,315 dollars and median rent of 1,431 dollars statewide, the per capita income levels suggest that many households can afford ownership or stable rent levels, though affordability constraints still exist for lower income renters and in specific high demand submarkets.
For investors, sustained income growth underpins demand for quality rental housing, owner occupied housing, and consumer facing commercial assets. Income levels also influence achievable rent levels and the depth of tenant demand in different segments of the market.
Section 05Housing and Multifamily
Alabama’s housing market has experienced notable appreciation while remaining comparatively affordable relative to many coastal and Sun Belt peers. The All Transactions House Price Index for Alabama, produced by the Federal Housing Finance Agency, tracks home prices on an index where the first quarter of 1980 equals 100. The index stood at 307.33 in the first quarter of 2018, 321.30 in the first quarter of 2019, 338.31 in the first quarter of 2020, 364.66 in the first quarter of 2021, 431.60 in the first quarter of 2022, 473.71 in the first quarter of 2023, 497.06 in the first quarter of 2024, 518.83 in the first quarter of 2025, and 540.51 in the first quarter of 2026. This pattern shows steady pre pandemic appreciation, followed by accelerated gains during and after the pandemic. The index increased by 233.18 points between early 2018 and early 2026, with particularly sharp growth between early 2020 and early 2022, when it rose from 338.31 to 431.60; this history is not indicative of future results.
HousingHandbook’s Alabama profile, which uses a population weighted Zillow Home Value Index across 656 ZIP codes, reports a typical and median home value of 229,315 dollars statewide, alongside a median rent of 1,431 dollars and a population of 5,086,600 residents. These figures imply that, despite substantial price appreciation, median home prices remain relatively moderate compared with higher cost states, supporting both ownership and rental strategies.
Public statewide data that isolate multifamily fundamentals, such as Class A versus Class B and C rents, concessions, and absorption by metropolitan area, are generally provided by private vendors and are not available in the open datasets accessed here. Consequently, this review does not quote numeric statewide apartment vacancy or rent growth percentages. Qualitatively, multifamily demand is supported by steady population growth, expanding employment in construction, health care, education, and leisure and hospitality, and the presence of large universities and medical centers in metros such as Birmingham, Huntsville, Tuscaloosa, Auburn and Opelika, and Mobile.
The state housing finance authority has long supported homeownership and affordable rental housing across Alabama, which points to the presence of a significant affordable and workforce housing sector alongside conventional market rate multifamily properties. For accredited investors, the combination of strong house price appreciation, moderate absolute pricing, and an established affordable housing infrastructure suggests opportunities across the spectrum, from workforce and middle income apartments in growing metros to specialized strategies in Low Income Housing Tax Credit and other subsidized assets, where program rules and credit availability shape returns.
Section 06Rents
Rents in Alabama vary considerably across metro areas and property types, but statewide aggregates help frame the market. HousingHandbook’s statewide Alabama profile reports a median rent of 1,431 dollars and a typical and median home value of 229,315 dollars, calculated as population weighted medians across 656 ZIP codes based on Zillow Observed Rent Index and home value data. The population figure of 5,086,600 residents for Alabama in the same profile provides context for the scale of the rental market.
The U.S. Department of Housing and Urban Development’s Fair Market Rent system provides Fair Market Rents by state, county, and metropolitan area, including fiscal year 2026 values. However, these values are embedded in large statewide and national files that are not directly parsable in this environment, so this review does not cite specific Fair Market Rent dollar values for Alabama’s metros or counties. The documentation confirms that for fiscal year 2026 there are county level Fair Market Rent schedules, small area Fair Market Rents, and related rent inflation factors, but without accessible Alabama specific figures in a concise format.
No open statewide dataset accessed here provides current, public, numeric rent series by unit type, bedroom count, or property class across all of Alabama. Such granular rent data, including Class A versus Class B and C multifamily rents and submarket rent growth metrics, are commonly available from proprietary providers.
For investors, the HousingHandbook median rent of 1,431 dollars, when compared with the median home value of 229,315 dollars and Redfin’s reported statewide median sale price of 307,408 dollars in May 2026, suggests that rents remain high enough to support income producing investment while ownership is still feasible for many households. Properties in high demand submarkets within Birmingham and Hoover, Huntsville, and coastal areas may command rents significantly above the statewide median, underscoring the importance of local data in underwriting.
Section 07Vacancy
Vacancy levels are critical to underwriting but are not comprehensively captured in publicly accessible statewide data for Alabama. The U.S. Census Bureau publishes rental and homeowner vacancy rates through national surveys, and private firms track apartment, office, retail, and industrial vacancy in depth. However, no current, consolidated statewide numeric vacancy series for Alabama by property type was found in the open sources accessed for this review.
Accordingly, this analysis does not present specific statewide vacancy percentages for multifamily, single family rentals, office, industrial, or retail assets in Alabama. Qualitatively, multifamily vacancy appears relatively contained in many metros, supported by income growth and limited overbuilding in some markets, while older stock and weaker locations may experience higher vacancy and concessions. Office vacancy, particularly in legacy product and certain central business districts, has risen in line with national trends toward remote and hybrid work, although detailed Alabama specific percentages are available primarily from proprietary data sources. Industrial and warehouse vacancy is generally tighter in key logistics corridors, and grocery anchored retail tends to perform better than discretionary or fashion oriented centers.
For accredited investors, the lack of public statewide vacancy metrics reinforces the need to rely on submarket and asset level data from brokers, appraisers, and property level financials when evaluating new acquisitions or monitoring existing holdings.
Section 08Supply Pipeline
New construction is an important driver of future vacancy and rent trends. The series that measures new private housing units authorized by building permits in Alabama, based on U.S. Census Bureau Building Permits Survey data, reports monthly counts of authorized units statewide. In 2018, Alabama authorized 1,212 units in January, 1,225 units in February, 1,136 units in March, 1,353 units in April, 1,546 units in May, and 1,225 units in June. In 2019, permits included 1,169 units in January, 1,089 units in February, 1,283 units in March, 1,500 units in April, 1,296 units in May, and 1,395 units in June, with monthly totals between 1,218 and 1,556 units for the remainder of the year.
In 2020, permitting accelerated, with 1,548 units in January, 1,380 units in February, 1,573 units in March, 1,665 units in April, 1,334 units in May, and 1,684 units in June, and peaks of 2,037 units in July and 1,853 units in August. In 2021, authorized units included 1,941 in January, 1,879 in February, 2,021 in March, 1,652 in April, 1,747 in May, and 1,679 in June, with monthly totals generally between 1,433 and 1,886 units through December. In 2022, permitting remained elevated, with 1,564 units in January, 1,703 units in February, 2,489 units in March, 1,920 units in April, 1,788 units in May, and 1,854 units in June, and monthly activity between 1,161 and 2,542 units later in the year.
In 2024, the series shows 2,095 units in January, 1,574 units in February, 1,595 units in March, 1,778 units in April, 2,260 units in May, and 1,503 units in June, with additional monthly counts ranging from 1,433 to 2,106 units from July through December. In 2025, authorized units totaled 1,660 in January, 1,386 in February, 1,598 in March, 1,590 in April, 1,447 in May, and 1,337 in June, and between 1,397 and 2,167 units in the remaining months. In 2026, the most recent accessible data show 1,655 units in January, 1,914 units in February, 1,937 units in March, 1,775 units in April, 1,914 units in May, and 1,840 units in June.
These figures confirm that Alabama has been authorizing well over a thousand new housing units per month, often exceeding 1,500 or even 2,000 units in stronger months, particularly during and after the pandemic. The series aggregates single family and multifamily permits, and detailed breakdowns by structure type are available in the underlying Census data but are not directly presented in this extract. For investors, this active pipeline means that submarket level supply dynamics matter. In high growth metros and corridors, robust permitting supports growing housing stock and can maintain relative affordability, but concentrated multifamily or build for rent single family development can also pressure rents and occupancy if demand slows.
Section 09Single Family Homes
Single family homes are a central component of Alabama’s residential landscape and investor opportunity set. HousingHandbook’s Alabama profile uses population weighted Zillow Home Value Index data to report a typical and median home value of 229,315 dollars statewide, alongside a median rent of 1,431 dollars, a population of 5,086,600 residents, and 656 ZIP codes. These figures show that median home prices remain relatively moderate, supporting both ownership and investment strategies.
Redfin’s Alabama housing market data provide a complementary view based on transactions. In May 2026, the median sale price for all home types in Alabama was 307,408 dollars, an increase of 4.2 percent compared with May 2025. Redfin also notes that there were 30,417 homes for sale in Alabama in May 2026, up 6.8 percent year over year, and that 16.7 percent of homes sold above list price, 0.3 percentage points higher than a year earlier, indicating a still competitive but not overheated market.
Redfin’s accessible statewide overview in this environment does not provide readable Alabama specific median days on market or months of supply metrics, so this review does not quote those indicators. Even so, the combination of rising prices, somewhat increased inventory, and a modest share of homes selling above list suggests conditions that lean toward sellers in many areas while offering buyers more choice than during the most constrained phases of the cycle.
For single family rental investors, the relationship between a roughly 229,315 dollar median home value and a 1,431 dollar median rent, along with a 307,408 dollar median sale price and 4.2 percent year over year appreciation, supports income oriented strategies, especially in submarkets where acquisition prices are below the statewide median and operating costs can be controlled. Markets such as Huntsville, the Birmingham suburbs, and certain coastal communities may see rent and price movement, though any future rent or price growth is uncertain and not assured, while more rural or economically weaker areas may present lower entry prices but higher vacancy and maintenance risks.
Section 10Commercial Real Estate and Retail Centers
Alabama’s commercial real estate stock includes office buildings, industrial and logistics properties, and a range of retail formats from regional malls to grocery anchored and neighborhood centers. However, comprehensive public statewide statistics on vacancy rates, asking rents, effective rents, cap rates, and absorption by property type are not available in the open sources used here, since those metrics are typically compiled by private brokerage and data firms.
Without relying on proprietary data, this review cannot provide current numeric statewide vacancy or rent figures for Alabama’s office, industrial, or retail sectors. Qualitatively, industrial and logistics properties benefit from Alabama’s location, manufacturing base, and transportation network, including interstate highways and port access along the Gulf Coast. Distribution centers and light industrial properties near logistics corridors and major metros likely experience relatively low vacancy and steady rent growth, reflecting national trends in ecommerce and supply chain reconfiguration.
Office markets, especially in Birmingham’s central business district and other major employment centers, are affected by remote and hybrid work, with older properties facing elevated vacancy and tenant improvement requirements. Suburban offices with strong parking, access, and flexible layouts may fare relatively better. Retail centers exhibit mixed performance, as grocery anchored and necessity focused centers in stable trade areas tend to maintain higher occupancy and more stable cash flows, while some older malls and discretionary oriented centers face structural headwinds.
For accredited investors, this landscape suggests opportunity in industrial and logistics assets aligned with freight and manufacturing corridors, as well as in well anchored neighborhood and community retail. Office investments require careful attention to tenant credit, lease term, building quality, and capital expenditure needs, and are best underwritten with current, submarket specific data sourced from brokers and proprietary platforms.
Section 11Transactions and Capital Markets
Publicly accessible statewide data on total transaction volumes, aggregate sales values, and average cap rates for Alabama’s commercial and residential real estate markets are limited. County level deed records and multiple listing services contain detailed transaction information, but statewide roll ups of these data are typically produced by commercial data providers and are not visible in a concise public series that can be cited numerically here.
Consequently, this review does not present specific statewide counts of multifamily, single family rental, office, industrial, or retail transactions, nor does it quote average cap rates or loan to value ratios for Alabama. Nevertheless, Alabama is an established target for both regional and national real estate capital, with institutional and private investors active in multifamily, single family rental portfolios, industrial and logistics properties, and select retail centers, particularly in metropolitan areas such as Birmingham and Hoover, Huntsville, Mobile, and Montgomery.
Capital markets conditions in Alabama are influenced by national interest rate trends, lender risk appetite, sector specific sentiment, and property level factors. Borrowing costs remain higher than in the ultra low rate era, creating a more discerning environment for debt financed acquisitions. Accredited investors should rely on property specific sales comparables, lender quotes, and broker opinions of value to calibrate pricing and leverage metrics.
Section 12Taxes
Tax policy shapes after tax returns and operating costs for Alabama real estate investments. The Alabama Department of Revenue administers state tax laws and operates an electronic filing and account management portal for taxpayers. The content accessed in this environment does not include a concise, current table of statewide individual or corporate income tax rates, statewide or local sales tax rates, or typical effective property tax rates.
Given these limitations, this review does not provide specific numeric tax rates or brackets for Alabama’s income, sales, or property taxes. It is clear that Alabama relies on a combination of state level and local taxes and that the Department of Revenue administers tax laws and electronic filing systems, but the exact rate structures and local variations are beyond what can be documented numerically here from the public content retrieved.
For investors, property taxes and income taxes on rental income and gains remain central to underwriting. The absence of publicly accessible numeric rate tables in this context means that investors should obtain up to date information from official state and local sources and coordinate with tax advisors when evaluating Alabama investments. This review is not tax advice; investors should consult qualified tax advisors regarding their specific circumstances.
Section 13Insurance
Insurance costs and regulatory conditions are key considerations in Alabama, given exposure to hurricanes along the Gulf Coast and severe convective storms and tornadoes inland. The Alabama Department of Insurance serves as the state’s insurance regulator and a source of consumer information, providing entry points for consumers, producers and agents, and companies, along with access to the State Fire Marshal’s office, and it participates in statewide resilience initiatives aimed at reducing loss from natural hazards.
The accessible content does not present statewide numeric data on average homeowners, renters, or commercial property insurance premiums, nor does it give loss ratios, rate change percentages, or premium volumes by line. Those statistics are typically available through insurance industry compilations and regulatory filings rather than summarized on a general public webpage.
From an investment standpoint, this means that while the regulatory infrastructure for insurance is clearly active and oriented toward resilience, the specific insurance cost burden is highly property and location dependent and not easily summarized with statewide public statistics. Investors should anticipate higher premiums and stricter underwriting in coastal and wind exposed areas and should incorporate insurance quotes, deductible structures, and coverage limitations into property level underwriting.
Section 14Landlord Tenant and Regulatory Environment
Alabama’s landlord tenant regime is shaped by state statutes and local ordinances, but the legislative content that provides precise rules on issues such as security deposits, notice periods, and eviction procedures is not directly accessible in a parsed format in this environment. As a result, this review does not quote numeric statutory limits, such as maximum deposit multiples or formal timelines for eviction processes.
Broadly, Alabama is often perceived as a relatively landlord friendly or balanced jurisdiction compared with some coastal states, with fewer statewide rent control mechanisms and a legal framework that allows for enforcing leases and addressing nonpayment, subject to court procedures and due process. Local governments can overlay state law with ordinances related to rental registration, inspections, or property maintenance, especially in larger cities.
For accredited investors, the implication is that regulatory risk in Alabama tends to be more localized than statewide. Careful due diligence at the municipal level, covering housing codes, inspection practices, and local court norms, is important, particularly for value add and workforce housing strategies.
Section 15Infrastructure
Infrastructure quality and investment are major determinants of real estate performance in Alabama. The Alabama Department of Transportation describes its mission as providing a safe, efficient, environmentally sound intermodal transportation system for all users, with the goals of facilitating economic and social development through the efficient movement of people and goods and improving intermodal connections within the state. The department uses project delivery methods such as design build, in which design and construction phases overlap to accelerate project completion, in contrast to traditional design bid build structures.
While the department’s site does not provide concise numerical summaries of lane miles, bridge counts, or annual capital budgets in the content accessed here, the mission language and design build emphasis underscore an active approach to maintaining and upgrading highways, bridges, and related facilities.
For investors, well maintained interstate and state highway systems support industrial and logistics properties, while transit, road, and bridge investments influence residential and retail site selection. Anticipating future infrastructure projects, such as road widenings, interchange improvements, and bridge replacements, can help identify submarkets that may benefit from improved access or near term disruption.
Section 16Climate and Physical Risks
Alabama faces a range of physical and climate related risks that are material for real estate. The National Centers for Environmental Information’s Climate at a Glance statewide time series tool allows users to select individual states and examine parameters such as temperature and precipitation over time, but in this environment it does not present Alabama specific numeric trend values in a directly readable format. Even without exact figures, regional climatology and historical experience highlight key hazards, including tropical storms and hurricanes affecting the Gulf Coast, severe thunderstorms and tornadoes in inland regions, heavy rainfall and flooding, and occasional winter storms in northern areas.
The Federal Emergency Management Agency’s Resilience Analysis and Planning Tool offers more than 100 preloaded layers with data on population, infrastructure, and hazards, and it draws on the National Risk Index, which identifies communities most at risk from 18 natural hazards across the United States. While Alabama specific National Risk Index scores are not visible in the retrieved content, the state clearly has significant exposure to hurricane winds and storm surge near the coast, riverine and flash flooding along major waterways, and tornadoes in parts of the state.
Because Alabama specific climate trend statistics and quantitative hazard scores are not retrievable in this environment, this review treats climate risk qualitatively. For investors, this means that site specific environmental and engineering due diligence, including review of floodplain maps, elevation, construction quality, roof systems, and drainage, is essential. Insurance availability and pricing, discussed earlier, are closely linked to these hazard profiles, and investments in mitigation can have material impacts on both loss experience and long term net operating income.
Section 17Opportunities
The quantitative and qualitative evidence assembled here points to several opportunity themes for accredited investors in Alabama, each subject to material risk and with no assurance of any particular outcome. First, the state’s combination of population growth from 4,891.628 thousand persons in 2018 to 5,193.088 thousand in 2025 and per capita income growth from 41,324 to 59,677 dollars over the same period indicates rising aggregate demand for housing and services. This is particularly compelling given Alabama’s relatively low unemployment rate of 3.2 percent in June 2026, even after a modest recent uptick.
Second, housing affordability remains a structural advantage. With a statewide median home value of 229,315 dollars and median rent of 1,431 dollars, and a median sale price of 307,408 dollars and 4.2 percent year over year appreciation as of May 2026, Alabama offers lower entry prices than many competing markets, though any appreciation and income are uncertain and not assured. This environment may be considered for multifamily, single family rental, and build for rent strategies, especially in high growth metros such as Huntsville, Birmingham and Hoover, and parts of the Gulf Coast.
Third, the active construction pipeline, illustrated by monthly building permit counts frequently exceeding 1,500 and sometimes 2,000 units between 2020 and 2026, demonstrates that developers see ongoing demand. For investors, participating in or acquiring new supply in well chosen locations can capture tenant demand for modern product while older, undifferentiated assets may face competitive pressure.
Fourth, industrial and logistics assets stand to benefit from Alabama’s transportation infrastructure and manufacturing base. The state’s transportation mission and use of design build delivery reflect ongoing emphasis on efficient movement of goods and people, which supports warehouse and distribution facilities along key corridors.
Finally, the state’s established affordable and workforce housing ecosystem, supported over many years by the state housing finance authority, enables investors with specialized expertise in these programs to pursue mission aligned, income producing opportunities alongside conventional market rate assets.
Section 18Risks
Alabama’s market also presents distinct risks. On the economic side, while total nonfarm employment is growing year over year, some sectors such as manufacturing and parts of trade, transportation, and utilities show negative or flat 12 month job changes in 2026. Dependence on specific industrial employers or subsectors can create localized vulnerability if demand shifts or facilities close.
Second, the strong rise in house prices, as reflected in the All Transactions House Price Index increasing from 307.33 in early 2018 to 540.51 in early 2026, raises questions about sustainability in certain submarkets, particularly if credit conditions tighten or income growth slows. Although statewide median values remain moderate, some neighborhoods and metro areas may have experienced rapid appreciation and could be more exposed in a downturn; past performance does not indicate future results.
Third, climate and physical risks, including hurricanes, tornadoes, severe storms, and flooding, are significant. The absence of easily accessed Alabama specific hazard scores does not diminish the reality that certain markets, particularly along the Gulf Coast and in tornado prone regions, face elevated risk of loss events. These risks can drive higher insurance premiums, deductibles, and potential coverage restrictions, directly affecting operating expenses and capital expenditure requirements.
Fourth, while Alabama’s regulatory climate is generally viewed as less restrictive than some other states, the lack of comprehensive public statewide data on tax rates, local fees, and property specific regulatory regimes means that investors must be cautious about assumptions. Changes in local policies, such as zoning, permitting, or code enforcement practices, can materially affect project timelines and costs.
Section 19Investor Implications
For accredited investors, Alabama offers a blend of income growth, moderate home prices, and an active development pipeline within a legal and tax environment that is generally supportive of investment. The data from the Federal Reserve Bank of St. Louis, the Bureau of Labor Statistics, HousingHandbook, Redfin, the state housing finance authority, HUD, NOAA, FEMA, and Alabama state agencies support a thesis of incremental growth rather than boom and bust dynamics.
This suggests several practical implications. Multifamily strategies focused on workforce and middle income segments in metros like Huntsville, Birmingham and Hoover, Mobile, and Montgomery can benefit from rising incomes and moderate rent levels, provided that investors account for competition from new supply and property level vacancy risk. Single family rental portfolios can exploit the gap between acquisition costs and achievable rents, especially where local schools, employment centers, and infrastructure create durable tenant demand.
Industrial and logistics properties near major highways, ports, and manufacturing nodes stand to gain from ongoing investment in infrastructure and shifting supply chains, while necessity retail centers in stable trade areas may offer income, though income is not assured. Office assets, particularly older product, require the most caution and selective underwriting.
Across all asset classes, insurance and climate resilience considerations, localized tax and regulatory structures, and submarket level vacancy and rent dynamics must be integrated into underwriting. The statewide data presented here serve as a macro framework, but investment decisions should be grounded in detailed, property specific and market specific analysis.
Section 20Conclusion
Alabama’s statewide real estate and multifamily market reflects steady demographic growth, significant income gains, low but gradually rising unemployment, and a housing sector that has appreciated strongly while remaining relatively affordable. Public data from the U.S. Census Bureau, the Bureau of Economic Analysis, the Bureau of Labor Statistics, the Federal Housing Finance Agency, the Federal Reserve Bank of St. Louis, HousingHandbook, Redfin, the Alabama Housing Finance Authority, the Alabama Department of Revenue, the Alabama Department of Insurance, the Alabama Department of Transportation, the U.S. Department of Housing and Urban Development, the National Centers for Environmental Information, and the Federal Emergency Management Agency together depict an economy with diversified employment, active homebuilding, and meaningful exposure to climate and weather risks.
For accredited investors, Alabama offers opportunities in multifamily, single family rentals, industrial and logistics, and necessity retail properties, particularly in growing metros and infrastructure advantaged corridors. These opportunities are balanced by risks related to sectoral employment shifts, climate hazards, insurance costs, and localized policy environments. Using the figures and analysis presented here as a foundation, investors can better assess where Alabama assets may fit within diversified portfolios, while recognizing that property level diligence and up to date local data are indispensable.
Sources
- U.S. Bureau of Labor Statistics, Alabama Economy at a Glance,, https://www.bls.gov/eag/eag.al.htm
- Federal Reserve Bank of St. Louis (FRED), Resident Population in Alabama (ALPOP),, https://fred.stlouisfed.org/series/ALPOP
- Federal Reserve Bank of St. Louis (FRED), Per Capita Personal Income in Alabama (ALPCPI),, https://fred.stlouisfed.org/series/ALPCPI
- Federal Reserve Bank of St. Louis (FRED), All Transactions House Price Index for Alabama (ALSTHPI),, https://fred.stlouisfed.org/series/ALSTHPI
- Federal Reserve Bank of St. Louis (FRED), New Private Housing Units Authorized by Building Permits for Alabama (ALBPPRIV),, https://fred.stlouisfed.org/series/ALBPPRIV
- HousingHandbook, Alabama Real Estate Data,, https://housinghandbook.com/state/al
- Redfin, Alabama Housing Market: House Prices and Trends,, https://www.redfin.com/state/Alabama/housing-market
- Alabama Housing Finance Authority,, https://www.ahfa.com/
- Alabama Department of Revenue,, https://www.revenue.alabama.gov/
- Alabama Department of Insurance,, https://aldoi.gov/
- Alabama Department of Transportation,, https://www.dot.state.al.us/
- U.S. Department of Housing and Urban Development, Fair Market Rents by State, County, and Metropolitan Area,, https://www.huduser.gov/portal/datasets/fmr.html
- National Oceanic and Atmospheric Administration (NOAA), Climate at a Glance: Statewide Time Series,, https://www.ncei.noaa.gov/access/monitoring/climate-at-a-glance/statewide/time-series
- Federal Emergency Management Agency (FEMA), Resilience Analysis and Planning Tool (RAPT),, https://www.fema.gov/emergency-managers/practitioners/resilience-analysis-and-planning-tool