In brief · summary: Arizona
Arizona State Real Estate Market Review
Section 01Executive Summary
Arizona combines rapid long term population growth, strong income gains, and a diversified but cyclical economy with a housing market that has cooled from the extreme run up of the early 2020s but remains structurally tight. The resident population series from the Federal Reserve Bank of St. Louis, based on U.S. Census Bureau estimates, shows that the statewide population rose from 7,164.228 thousand persons in 2018 to 7,623.818 thousand persons in 2025, measured in thousands of persons as of July 1. Over the same period, per capita personal income, using Bureau of Economic Analysis data, increased from 45,297 dollars in 2018 to 68,283 dollars in 2025, in current dollars.
The Arizona Economy at a Glance table from the Bureau of Labor Statistics reports that in June 2026 the state’s seasonally adjusted civilian labor force was 3,724.3 thousand persons, employment was 3,543.4 thousand persons, unemployment was 181.0 thousand persons, and the unemployment rate was 4.9 percent. Total nonfarm employment was 3,283.2 thousand jobs in June 2026, with a 12 month change of 0.7 percent, reflecting modest but positive job growth. Sector level data indicate continued strength in mining and logging, a construction sector that has shifted from mild contraction to year over year growth, and a large trade, transportation, and utilities base that has returned to modest expansion.
On the housing side, the All Transactions House Price Index for Arizona from the Federal Housing Finance Agency rose from 383.55 in the first quarter of 2018 to 734.15 in the first quarter of 2026 on an index where the first quarter of 1980 equals 100; this history is not indicative of future results. HousingHandbook, using population weighted Zillow data, reports a typical and median home value of 405,118 dollars, a median rent of 1,736 dollars, a population of 7,380,290 residents, and 417 ZIP codes statewide. Redfin reports that in May 2026 the statewide median sale price for all home types was 448,407 dollars, up 0.8 percent year over year, with 48,346 homes for sale, down 2.6 percent year over year, and 13.3 percent of homes selling above list price, 0.3 percentage points higher than a year earlier.
New residential construction remains active but has moderated from peak levels. The permit data show monthly statewide counts in the low to mid thousands, with notable highs such as 7,221 units in March 2022 and 6,157 units in December 2025 and more recent values of 2,859 units in January 2026 and 4,840 units in June 2026. Together, these indicators describe a market with solid economic underpinnings, meaningful house price appreciation, and constrained supply, but also higher interest rates and more balanced buyer and seller dynamics than during the prior boom. For accredited investors, Arizona offers opportunities in multifamily, single family rentals, and select commercial assets, particularly in high growth metros, while requiring careful attention to cyclical risks, water and climate constraints, and submarket specific fundamentals.
Section 02Population and Migration
Arizona’s population trajectory over the past decade has been one of strong growth, with only a brief interruption in 2020. The resident population, measured in thousands of persons as of July 1, was 7,164.228 thousand in 2018, 7,291.843 thousand in 2019, 7,186.647 thousand in 2020, 7,274.022 thousand in 2021, 7,370.065 thousand in 2022, 7,452.073 thousand in 2023, 7,556.424 thousand in 2024, and 7,623.818 thousand in 2025. Between 2018 and 2019, the population increased from 7,164.228 to 7,291.843 thousand persons, reflecting strong in migration and natural growth. The series shows a modest dip in 2020 to 7,186.647 thousand persons, consistent with pandemic related disruptions and data revisions, followed by a resumption of growth to 7,623.818 thousand persons by 2025.
HousingHandbook’s Arizona profile, drawing on American Community Survey data for population weights, reports a population of 7,380,290 residents across 417 ZIP codes, a figure broadly consistent with the federal series for the early to mid 2020s.
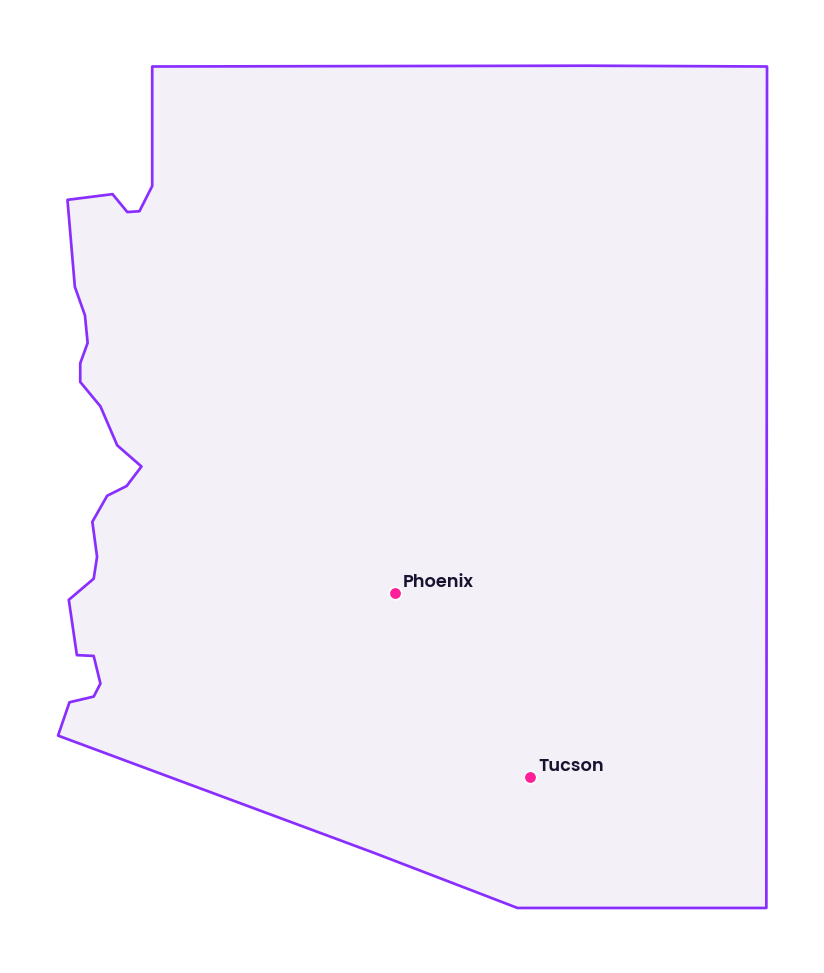
Publicly accessible statewide time series data in this environment do not provide a clean breakdown of population change into domestic migration, international migration, and natural increase with current numeric values. As a result, this review does not specify numeric migration components. Qualitatively, Arizona’s growth is widely understood to be driven by net in migration from higher cost states, particularly to the Phoenix and Tucson metropolitan areas, supported by job growth in technology, manufacturing, logistics, and services and by retirees seeking climate and lifestyle benefits.
For investors, the key implication is that Arizona’s housing demand is underpinned by sustained population growth concentrated in its major metros and growth corridors. The temporary 2020 dip in the population series does not alter the longer term trend of rising headcount and household formation, which supports both rental and ownership demand.
Section 03Jobs and Economic Anchors
Arizona’s labor market in 2026 reflects a maturing expansion after the post pandemic rebound. The Bureau of Labor Statistics shows that the seasonally adjusted civilian labor force was 3,814.2 thousand persons in January 2026 and declined gradually to 3,724.3 thousand persons by June 2026. Employment over the same period was 3,642.8 thousand persons in January, 3,626.1 thousand in February, 3,607.1 thousand in March, 3,582.1 thousand in April, 3,565.8 thousand in May, and 3,543.4 thousand in June 2026. Unemployment increased from 171.4 thousand persons in January to 181.0 thousand persons in June, and the unemployment rate rose from 4.5 percent in January to 4.9 percent in June 2026.
Total nonfarm wage and salary employment in Arizona was 3,262.3 thousand jobs in January 2026 and 3,283.2 thousand jobs in June 2026, with the 12 month change improving from negative 0.4 percent in January to positive 0.7 percent in June. This progression indicates that, while overall job growth slowed significantly from earlier in the cycle, the state remained in modest expansion by mid 2026.
Sector level data highlight Arizona’s diversification. Mining and logging employment, which includes copper and other resource activity, increased from 16.5 thousand jobs in January 2026 to 17.1 thousand in June, with 12 month changes ranging from 7.8 percent in January to 8.9 percent in June, indicating robust growth from a small base. Construction employment rose from 223.2 thousand jobs in January to 227.6 thousand in June, and its 12 month change shifted from negative 1.8 percent in January to positive 1.5 percent in June, suggesting that construction is again expanding after a period of contraction. Manufacturing employment was relatively stable but slightly declining, from 192.8 thousand jobs in January to 191.1 thousand in June, with 12 month changes ranging from negative 0.6 to negative 0.9 percent, reflecting modest headwinds. Trade, transportation, and utilities, a key driver of logistics and consumer facing employment, recorded 623.0 thousand jobs in January and 628.9 thousand in June 2026, with 12 month changes moving from negative 0.7 percent to positive 0.6 percent over the same period. Education and health services, at 568.1 thousand jobs in June, grew 3.7 percent over the year, and professional and business services, at 469.7 thousand jobs, grew 2.2 percent, both providing significant support, while leisure and hospitality, at 361.4 thousand jobs, declined 1.6 percent.
These sector patterns support a narrative of an economy anchored by a large service and logistics base, growing construction activity, and targeted strength in mining and advanced manufacturing, including semiconductor and electronics production in the Phoenix metro. For real estate investors, this mix provides multiple demand drivers for housing, industrial, and retail properties, while the uptick in unemployment and deceleration in job growth caution against assuming unbroken expansion. Submarkets tied to high growth industries and major employers are more likely to sustain rent growth and occupancy than those reliant on more cyclical or slower growing sectors.
Section 04Income
Income growth in Arizona has been strong over the last several years. According to the Bureau of Economic Analysis, per capita personal income, in current dollars, was 45,297 dollars in 2018, 47,718 dollars in 2019, 52,080 dollars in 2020, 57,175 dollars in 2021, 59,120 dollars in 2022, 63,209 dollars in 2023, 66,024 dollars in 2024, and 68,283 dollars in 2025. Between 2018 and 2025, per capita personal income in Arizona increased by 22,986 dollars, with the largest single year gain occurring between 2019 and 2020, when the figure rose from 47,718 to 52,080 dollars. This period coincides with pandemic era federal transfers, wage adjustments, and structural shifts in the economy. From 2020 to 2025, per capita income climbed from 52,080 to 68,283 dollars, reflecting continued wage growth, population composition changes, and investment income.
When considered alongside the resident population series, which shows population rising from 7,164.228 to 7,623.818 thousand persons between 2018 and 2025, the income data imply that total personal income in the state has grown substantially. For real estate investors, rising per capita incomes support the ability of households to afford higher rents and home prices, particularly in employment rich metros. At the same time, income gains are uneven across regions and sectors, which can widen affordability gaps and create both opportunities in attainable and workforce housing and risks for assets that depend on renters at the margins of affordability.
Section 05Housing and Multifamily
Arizona’s housing market experienced a pronounced price run up in the early 2020s followed by a period of slower growth. The All Transactions House Price Index for Arizona, compiled by the Federal Housing Finance Agency, tracks statewide home prices on an index where the first quarter of 1980 equals 100. The index stood at 383.55 in the first quarter of 2018, 410.46 in the first quarter of 2019, 440.91 in the first quarter of 2020, 497.05 in the first quarter of 2021, 639.80 in the first quarter of 2022, 665.13 in the first quarter of 2023, 699.41 in the first quarter of 2024, 717.31 in the first quarter of 2025, and 734.15 in the first quarter of 2026. From early 2018 to early 2026, the index rose by 350.60 points, with particularly sharp appreciation between 2020 and 2022, when it increased from 440.91 to 639.80. After 2022, the trajectory flattened, with more modest gains from 665.13 in early 2023 to 734.15 in early 2026; this history is not indicative of future results. This pattern aligns with a statewide shift from a highly overheated market to a more balanced one as mortgage rates increased and affordability pressures mounted.
HousingHandbook’s Arizona profile, using population weighted Zillow Home Value Index data across 417 ZIP codes, reports a typical and median home value of 405,118 dollars statewide, along with a median rent of 1,736 dollars and a population of 7,380,290 residents. These values place Arizona’s statewide home values well above many interior states, reflecting strong demand in the Phoenix, Tucson, and growing secondary markets.
Within the broader housing stock, multifamily assets play a significant role in accommodating both in migration and household formation. Public sources reviewed here do not provide a clean, current statewide time series for multifamily specific metrics such as average asking rents by class, concessions, absorption by unit type, or multifamily vacancy. Such data are generally available from private providers and are not exposed in the public datasets accessed in this environment. Nevertheless, the combination of high home values, substantial house price appreciation, and robust population and income growth suggests that renter demand remains strong, particularly among younger households, new arrivals, and those priced out of ownership. For institutional investors, this supports the case for well located multifamily properties in major metros and growth corridors, with a focus on product that balances achievable rents with affordability for key worker segments.
Section 06Rents
Rents in Arizona reflect both the state’s economic growth and its attractiveness as a migration destination. HousingHandbook’s Arizona profile, based on population weighted Zillow Observed Rent Index data, reports a statewide median rent of 1,736 dollars. This figure indicates that a representative rental unit across Arizona’s 417 ZIP codes commands a rent in the mid 1,700 dollar range, with higher levels in core submarkets of Phoenix and Scottsdale and lower levels in outlying and rural areas.
The U.S. Department of Housing and Urban Development publishes Fair Market Rents by state, county, and metropolitan area, and maintains a history for all bedroom sizes from 1983 through 2026, but the specific Arizona values are contained in large files that are not parsable in this environment. Consequently, this review does not quote Arizona Fair Market Rent dollar amounts by bedroom count or metro but acknowledges that they are used by public agencies to set voucher payment standards and gauge rental affordability.
Across public sources accessed here, there is no statewide time series that provides detailed class A, class B, and class C multifamily rent levels, or rent growth by metro, in a numeric format suitable for direct quotation. Those figures are typically maintained in subscription datasets. Qualitatively, the intersection of a 405,118 dollar median home value, a 1,736 dollar median rent, and a 68,283 dollar per capita personal income in 2025 suggests that while many households can support current rent levels, affordability is stretched for lower income renters, particularly in high cost Phoenix submarkets. For investors, this underscores the appeal of workforce and middle income multifamily product that can serve employed households priced below new luxury offerings, as well as the importance of underwriting rent growth assumptions conservatively in light of affordability constraints.
Section 07Vacancy
Vacancy is central to investment performance, but comprehensive statewide data on multifamily, single family rental, office, industrial, and retail vacancy for Arizona are not available in the public datasets reviewed for this analysis. The U.S. Census Bureau publishes national and regional rental and homeowner vacancy rates, and various federal and state statistical agencies release employment and production metrics, but none of the accessible public series provide a current numeric breakdown of real estate vacancy rates by property type at the Arizona statewide level.
In the absence of public quantitative vacancy series, this review does not present specific percentage vacancy figures for Arizona’s apartment, single family rental, office, industrial, or retail segments. Instead, vacancy must be assessed through proprietary data, local broker surveys, and property level operating histories. Qualitatively, strong in migration and limited new supply in some submarkets likely keep vacancy relatively tight in well located multifamily assets in Phoenix and Tucson, while older, less competitive office buildings and certain retail properties may experience elevated vacancy consistent with national trends.
For accredited investors, the lack of public vacancy data heightens the importance of submarket specific research and conservative underwriting assumptions, particularly in property types undergoing structural change, such as office and some categories of retail.
Section 08Supply Pipeline
Arizona’s residential construction pipeline has been large by national standards and remains active, although it has moderated from pandemic era peaks. The series that measures new private housing units authorized by building permits in Arizona, based on U.S. Census Bureau data, reports the total number of new private housing units authorized each month statewide. In 2018, monthly counts included 3,531 units in January, 4,261 in April, and 4,509 in July. In 2019, they ranged from 2,641 units in January to 4,359 in June and 3,779 in December. In 2020, authorizations climbed from 5,080 units in January to 5,394 in June and a high of 6,350 in December.
In 2021, monthly counts included 5,173 units in March, 5,996 in June, and 5,858 in December. In 2022, the series reached a peak of 7,221 units in March, then eased to 3,871 in October and 5,252 in December. In 2023, authorizations swung from a low of 2,033 units in January to 6,525 in March, 5,793 in September, and 4,737 in December. In 2024, counts ran from 5,576 units in January and 5,351 in June down to 3,275 in December. In 2025, they moved from 3,672 units in January to 5,235 in April, 4,553 in June, and 6,157 in December. In the first half of 2026, the series recorded 2,859 units in January, 4,133 in March, and 4,840 in June.
These figures demonstrate that Arizona has consistently authorized between roughly 3,000 and 6,000 new private housing units per month over the last several years, with exceptional highs such as 7,221 units in March 2022 and 6,350 units in December 2020, and lower points such as 2,033 units in January 2023 and 2,859 units in January 2026. The very high permit volumes in 2020 through 2022 correspond to a period of intense housing demand and low interest rates, while the moderation in early 2023 and early 2026 likely reflects higher borrowing costs and more cautious developer sentiment.
The series aggregates all private housing units and does not break out multifamily versus single family units in the publicly accessible data used here. Nonetheless, the absolute scale of permits implies a substantial ongoing addition to housing stock, particularly in fast growing metros. For investors, this pipeline supports long term population growth but also introduces localized supply risk in submarkets with heavy construction. Attention to the relationship between new deliveries, absorption, and rent trajectories at the submarket level is essential.
Section 09Single Family Homes
Single family homes are central to Arizona’s housing market, both for owner occupiers and as investment assets. HousingHandbook’s Arizona profile, using population weighted Zillow Home Value Index data, reports a typical and median home value of 405,118 dollars statewide, with a median rent of 1,736 dollars, a population of 7,380,290 residents, and 417 ZIP codes. These figures indicate that Arizona’s median home value is well above many states, reflecting strong demand in metropolitan Phoenix and other growth areas.
Transaction based data from Redfin complement these value estimates. Redfin reports that in May 2026 the median sale price for all home types statewide was 448,407 dollars, up 0.8 percent compared with May 2025. In the same month, there were 48,346 homes for sale in Arizona, a 2.6 percent decrease year over year, and 13.3 percent of homes sold above list price, 0.3 percentage points higher than one year earlier. These indicators show that while the rate of price appreciation has slowed markedly from earlier years and inventory has stabilized or slightly contracted, the market remains competitive, with a meaningful share of homes still receiving offers above list price.
Redfin’s publicly accessible statewide overview in this environment does not expose Arizona specific numeric values for metrics such as median days on market or months of supply, so this review does not cite those figures. Nonetheless, the combination of a 448,407 dollar median sale price, modest positive year over year price growth, slightly lower for sale inventory, and a stable or slightly rising share of above list transactions suggests a market that has shifted from a pronounced seller’s market to a more balanced but still tight one.
For single family rental investors, the relationship between a 405,118 dollar median home value, a 1,736 dollar median rent, and a 68,283 dollar per capita income in 2025 highlights both opportunity and constraint. Households with stable incomes in growth corridors can support relatively high rent payments, particularly in employment rich suburbs, but acquisition prices and operating costs require careful underwriting to achieve target yields. Strategies focused on durable, mid priced homes in strong school districts and employment nodes may offer more resilient income streams than those reliant on higher end appreciation alone.
Section 10Commercial Real Estate and Retail Centers
Arizona’s commercial real estate market spans office towers and mid rise buildings in downtown Phoenix and other business districts, industrial and logistics facilities serving distribution, ecommerce, and manufacturing, and a spectrum of retail assets including grocery anchored centers, power centers, and neighborhood shopping centers. However, publicly accessible statewide datasets in this environment do not provide current numeric series for vacancy rates, effective rents, cap rates, or net absorption for office, industrial, or retail properties in Arizona. Such metrics are largely the domain of private sector data providers and local brokerage research.
In the absence of those quantitative series, this review does not assign specific vacancy percentages, rent levels, or cap rate figures to Arizona’s commercial segments. Qualitatively, the state’s growing population, expanding logistics sector, and importance as a regional distribution hub support demand for industrial and logistics properties, particularly along key freeway and rail corridors in the Phoenix metro and near major interchanges. These assets are likely to exhibit relatively low vacancy and stable or growing rents, subject to national logistics cycles and construction pipelines.
Office markets in Arizona, especially in downtown and suburban Phoenix, mirror national trends, with tenants seeking high quality space and consolidating footprints in the face of hybrid work patterns. Older, less efficient buildings may face sustained vacancy and downward pressure on rents, while well amenitized, accessible assets with strong tenant rosters can remain competitive. Retail performance is bifurcated, as grocery anchored and necessity oriented neighborhood centers serving growing residential areas tend to perform well, while some discretionary and big box retail faces headwinds from ecommerce and changing consumer behavior.
For accredited investors, the lack of public statewide commercial metrics requires deeper engagement with local market data and brokerage insights. Industrial and necessity retail assets in high growth corridors may present relatively favorable risk adjusted opportunities, though returns are not assured, whereas office investments demand especially rigorous tenant, lease, and capital expenditure analysis.
Section 11Transactions and Capital Markets
Comprehensive statewide data on transaction volumes, aggregate sales values, and average cap rates for Arizona’s multifamily, single family rental, office, industrial, and retail properties are not present in the public datasets used for this review. While deed records, multiple listing services, and federal filings contain the underlying information, statewide roll ups by property type and cap rate aggregates are typically compiled by private data vendors and are not exposed through open sources.
Publicly accessible federal datasets that do relate to capital markets, such as the All Transactions House Price Index for Arizona, capture price trends but not transaction counts or yields. As a result, this review does not provide numeric statewide transaction volumes, average deal sizes, or cap rate statistics for Arizona’s real estate sectors.
In practice, capital flows into Arizona real estate are influenced by national credit conditions, interest rates, and investor risk appetite, as well as by the state’s demographic and economic fundamentals. The combination of strong per capita income growth, continued population gains, and long term house price appreciation, balanced by higher interest rates and climate and water concerns, shapes institutional sentiment. For accredited investors, current capital market conditions in Arizona must be assessed through discussions with lenders, brokers, and investment partners, combined with property specific cash flow analyses, rather than through statewide public transaction statistics.
Section 12Taxes
Tax policy affects net returns for Arizona real estate investments, but the publicly accessible content retrieved from the Arizona Department of Revenue does not include current tabular schedules of individual income tax brackets, corporate tax rates, or statewide property tax averages. The Department of Revenue serves as the central state tax administration body, providing online services through which taxpayers can pay individual and business taxes, track refunds, and apply for licenses.
Because the content retrieved does not present numeric tax rates or brackets, this review does not state specific percentage rates for Arizona’s individual or corporate income taxes, statewide sales taxes, or typical effective property tax rates by jurisdiction. For accredited investors, this means that tax assumptions in underwriting should be based on up to date schedules from the Arizona Department of Revenue and relevant local governments, as well as consultation with tax advisors.
In general, property taxes, any applicable state and local sales taxes, and income tax treatment of rental income and capital gains are important determinants of after tax returns. Jurisdiction specific assessments, special districts, and incentive programs can also affect cash flows. Investors should treat tax diligence as a core component of market entry and asset selection. This review is not tax advice; investors should consult qualified tax advisors regarding their specific circumstances.
Section 13Insurance
Insurance costs and coverage terms in Arizona are shaped by exposure to hazards such as extreme heat, drought, wildfires, monsoon related flooding, and, in some areas, dust storms and hail. The state’s insurance regulation is managed by a state level insurance regulator, but the accessible public content in this environment did not yield usable numeric information on insurance market conditions or rate filings.
As a result, this review does not provide statewide average premium levels, rate change percentages, or loss ratios for homeowners, renters, or commercial property insurance in Arizona. Nonetheless, it is clear that insurers must price for both current weather patterns and evolving climate risks, and that premiums, deductibles, and coverage availability can vary significantly by location, construction type, and proximity to high risk areas such as wildland urban interfaces or flood prone zones.
For investors, the practical implication is that insurance assumptions in pro formas cannot be generalized from national averages. Site specific commercial property insurance quotes, including wind, hail, flood, and wildfire coverage where relevant, are essential to understanding net operating income and lender requirements. In some submarkets, rising insurance costs may materially affect investment viability and tenant affordability.
Section 14Landlord Tenant and Regulatory Environment
Arizona’s landlord tenant framework is established primarily through state statutes and supplemented by local ordinances, court procedures, and, in certain areas, homeowner association and zoning rules. However, the legislative texts and official summaries that would provide precise rules on topics such as security deposit limits, notice periods, and eviction timelines were not accessible in a structured, numeric form in this environment. Therefore, this review does not quote specific statutory provisions.
Broadly, Arizona is generally regarded as a relatively landlord friendly jurisdiction compared with many coastal states, with processes for enforcing lease terms and recovering possession that are often more streamlined than in more heavily regulated urban markets elsewhere in the country. There is no publicly accessible data series in the sources used here that quantifies average eviction timelines or litigation rates by county.
For accredited investors, this qualitative assessment means that legal risk around rent regulation and eviction processes may be lower than in some alternative markets, but local counsel should confirm the current regulatory environment in each target jurisdiction. Particular attention should be paid to municipal rules, fair housing enforcement, and any local initiatives related to tenant protections or short term rentals, which can vary across Arizona’s cities and towns.
Section 15Infrastructure
Infrastructure is a key underpinning of Arizona’s real estate performance, especially in the fast growing Phoenix and Tucson corridors and along major interstate and freight routes. The Arizona Department of Transportation describes its statewide role and maintains an active program of freeway improvement and interchange reconstruction projects in the Phoenix and Tucson areas, including work along major interstate corridors such as Interstate 10.
The retrieved content does not provide numeric summaries of highway miles, daily vehicle counts, or capital budget figures, so this review cannot present those statistics. However, the emphasis on freeway expansion and reconstruction in Phoenix and Tucson underscores the state’s focus on accommodating growth and improving mobility in its major metros. Infrastructure in the form of highways, arterial roads, airports, and freight corridors directly supports logistics, commuting patterns, and access to employment and services.
For investors, proximity to current and planned transportation projects can significantly influence asset performance. Properties near upgraded freeway interchanges or major arterial improvements may experience enhanced accessibility and tenant demand, while those exposed to construction disruption or long term congestion may face temporary operational challenges. Incorporating infrastructure plans into market selection and underwriting is particularly important in Arizona’s growth corridors.
Section 16Climate and Physical Risks
Arizona’s climate and physical risks are central to long term real estate performance. The National Centers for Environmental Information’s Climate at a Glance statewide time series tool allows users to select Arizona and analyze temperature and precipitation trends over time, but Arizona specific numeric series are not visible in the retrieved content in this environment. Nonetheless, widely documented climatic trends indicate rising average temperatures, more frequent and intense heat waves, prolonged drought conditions, changing precipitation patterns including heavy monsoon rains in some regions, and heightened wildfire risk in wildland urban interface areas.
The Federal Emergency Management Agency’s Resilience Analysis and Planning Tool provides more than 100 preloaded data layers on population, infrastructure, and hazards, and it draws on the National Risk Index, which identifies communities most at risk from 18 natural hazards across the United States. The materials accessed here do not display Arizona specific risk scores or hazard frequencies but make clear that such data exist for hazards including wildfire, riverine and flash flooding, drought, and extreme heat.
For real estate investors, Arizona’s climate and physical risks manifest through elevated cooling costs, potential water supply constraints, wildfire exposure in some suburban and rural markets, and localized flood risk associated with intense monsoon storms. These risks can influence operating expenses, capital expenditure needs for resilience and hardening, insurance availability and cost, and ultimately asset liquidity. Incorporating site specific hazard assessments, building system evaluations, and local resilience planning into due diligence is increasingly necessary for long term investment success.
Section 17Opportunities
The quantitative and qualitative evidence presented here highlights several opportunity themes for accredited investors in Arizona, each subject to material risk and with no assurance of any particular outcome. First, robust population growth, with the resident population rising from 7,164.228 to 7,623.818 thousand persons between 2018 and 2025, combined with strong per capita income gains from 45,297 to 68,283 dollars over the same period, supports enduring demand for housing and consumer oriented real estate in the state’s major metros.
Second, the All Transactions House Price Index for Arizona nearly doubled from 383.55 in early 2018 to 734.15 in early 2026, and Redfin’s data show continued but slower appreciation with a 0.8 percent year over year increase in the median sale price to 448,407 dollars in May 2026; past appreciation is not indicative of future results. This trajectory suggests that while the most explosive phase of price growth has passed, home values remain supported by fundamentals, though any future appreciation is uncertain and not assured.
Third, the residential construction pipeline, with monthly permits often between roughly 3,000 and 6,000 units and peaks such as 7,221 units in March 2022 and 6,157 units in December 2025, provides both opportunities to participate in new development and a buffer against severe undersupply in high growth corridors. Well located for rent and for sale projects that align with local incomes and housing needs may capture demand.
Fourth, Arizona’s diversified economy, with significant employment in trade, transportation, and utilities of 623.0 thousand jobs in January 2026 rising to 628.9 thousand in June, growing construction from 223.2 to 227.6 thousand jobs over the same period, and a strengthening mining and logging sector, supports industrial, logistics, and service oriented retail assets. These properties can benefit from growth in ecommerce, manufacturing, and regional distribution.
Fifth, the relative landlord friendliness of Arizona’s legal environment and the absence of statewide rent control, as understood from general legal context though not quantified here, can make the state more attractive than heavily regulated jurisdictions for income oriented real estate strategies, provided that investors maintain appropriate tenant relations and compliance practices.
Section 18Risks
Alongside these opportunities, Arizona presents material risks that investors must weigh. Economic deceleration is one concern, as the data show that total nonfarm job growth slowed significantly, with the 12 month change in total nonfarm employment hovering near zero in early 2026 before reaching only 0.7 percent in June 2026. The unemployment rate increased from 4.5 percent in January to 4.9 percent in June 2026, indicating some softening in labor market conditions. A more pronounced slowdown or recession could pressure rents, occupancy, and asset values, particularly in more cyclical property types and peripheral locations.
Second, the substantial run up in house prices, reflected in the index’s move from 440.91 in early 2020 to 639.80 in early 2022 and 734.15 in early 2026, raises questions about affordability and the potential for price corrections in overextended submarkets. The Redfin data showing only 0.8 percent year over year growth in median sale price in May 2026 suggest that appreciation has already cooled, and further normalization is possible; past performance does not indicate future results.
Third, climate and water risks are structural. Arizona’s exposure to extreme heat, drought, wildfire, and monsoon flooding can lead to rising operating costs, capital expenditure needs, and insurance premiums, while long term water supply constraints in certain basins may limit new development or increase regulatory scrutiny. These factors could impair the viability of some projects and shift demand patterns over time.
Fourth, construction and development risk is nontrivial. The high volume of residential permits in recent years, including 7,221 units in March 2022 and sustained activity through 2025, means that some submarkets face near term supply pressure. Projects delivered into a softer leasing environment or with aggressive underwriting may underperform.
Finally, the absence of publicly available statewide vacancy, rent, and cap rate data for commercial properties necessitates reliance on private data and local expertise. Investors operating with incomplete or outdated information risk mispricing assets or misjudging submarket dynamics.
Section 19Investor Implications
For accredited investors, Arizona’s statewide data suggest that the market remains a substantial but more nuanced opportunity set than during the early 2020s boom. Strong population and income growth, significant long term house price appreciation, and a diversified economic base continue to support demand for housing and many types of commercial real estate. However, higher interest rates, a slowing but still positive labor market, elevated asset prices, and structural climate and water risks require more selective and disciplined strategies.
Multifamily investments in Phoenix, Tucson, and growing secondary markets can benefit from sustained renter demand, especially when properties are positioned to serve middle income households and workers in growth industries. Single family rental strategies that focus on mid priced homes in stable neighborhoods with good access to employment and transportation may generate income and potential appreciation, though income, returns, and appreciation are not assured, and must account for acquisition costs, maintenance in a harsh climate, and evolving insurance expenses.
Industrial and logistics assets linked to Arizona’s transportation corridors and distribution networks are well placed to capture long term growth in goods movement and ecommerce, while grocery anchored and necessity retail centers in expanding residential areas may generate income, though income is not assured. Office investments are the most sensitive to structural changes in work patterns and require granular tenant and building level analysis.
Across asset classes, investors should integrate Arizona specific factors, such as localized water constraints, climate exposure, infrastructure investments, and submarket level supply pipelines, into underwriting and portfolio construction. The public datasets used here provide a macro framework, and robust local intelligence and conservative assumptions about rent growth, exit yields, and capital expenditure are essential complements.
Section 20Conclusion
Arizona’s real estate and multifamily market in mid 2026 is characterized by strong long term fundamentals, moderated but still positive growth, and evolving risks. Federal Reserve Bank of St. Louis series document substantial gains in population and per capita income and a near doubling of the statewide house price index since 2018. Bureau of Labor Statistics data show a labor market that remains in expansion but with slower job growth and a modestly higher unemployment rate. HousingHandbook and Redfin provide a picture of a for sale market with high median values, constrained inventory, and competitive but less frenzied dynamics than in the recent past. Building permit data highlight a significant ongoing supply pipeline, while HUD, NOAA, and FEMA resources frame the policy and hazard context, even where state specific numeric values are not easily extractable.
For accredited investors, Arizona remains a meaningful market for long term capital deployment in multifamily, single family rentals, industrial and logistics assets, and necessity retail, particularly in core and growth corridor submarkets. However, the era of easy gains from rapid appreciation appears to be over, replaced by a landscape where asset selection, resilience to climate and water risks, and careful alignment of leverage and cash flows are decisive. The figures and qualitative context presented in this review provide a foundation for that assessment, but they should be supplemented with detailed local data and professional advice before any investment decision.
Sources
- U.S. Bureau of Labor Statistics, Arizona Economy at a Glance,, https://www.bls.gov/eag/eag.az.htm
- Federal Reserve Bank of St. Louis (FRED), Resident Population in Arizona (AZPOP),, https://fred.stlouisfed.org/series/AZPOP
- Federal Reserve Bank of St. Louis (FRED), Per Capita Personal Income in Arizona (AZPCPI),, https://fred.stlouisfed.org/series/AZPCPI
- Federal Reserve Bank of St. Louis (FRED), All Transactions House Price Index for Arizona (AZSTHPI),, https://fred.stlouisfed.org/series/AZSTHPI
- Federal Reserve Bank of St. Louis (FRED), New Private Housing Units Authorized by Building Permits for Arizona (AZBPPRIV),, https://fred.stlouisfed.org/series/AZBPPRIV
- HousingHandbook, Arizona Real Estate Data,, https://housinghandbook.com/state/az
- Redfin, Arizona Housing Market: House Prices and Trends,, https://www.redfin.com/state/Arizona/housing-market
- Arizona Department of Revenue,, https://azdor.gov/
- Arizona Department of Transportation,, https://azdot.gov/
- U.S. Department of Housing and Urban Development, Fair Market Rents by State, County, and Metropolitan Area,, https://www.huduser.gov/portal/datasets/fmr.html
- National Oceanic and Atmospheric Administration (NOAA), Climate at a Glance: Statewide Time Series,, https://www.ncei.noaa.gov/access/monitoring/climate-at-a-glance/statewide/time-series
- Federal Emergency Management Agency (FEMA), Resilience Analysis and Planning Tool (RAPT),, https://www.fema.gov/emergency-managers/practitioners/resilience-analysis-and-planning-tool