In brief · summary: Arkansas
Arkansas State Real Estate Market Review
Section 01Executive Summary
Arkansas offers a slow but steady growth profile with moderate home prices, rising incomes, and a diversified but modest scale economy. The resident population series from the Federal Reserve Bank of St. Louis, based on U.S. Census Bureau estimates, shows that the statewide population increased from 3,012.161 thousand persons in 2018 to 3,114.791 thousand persons in 2025, measured in thousands of persons as of July 1. Over the same period, per capita personal income, using Bureau of Economic Analysis data, rose from 43,031 dollars in 2018 to 61,752 dollars in 2025, in current dollars.
The Arkansas Economy at a Glance table from the Bureau of Labor Statistics reports that the seasonally adjusted civilian labor force in June 2026 was 1,457.7 thousand persons, employment was 1,398.0 thousand persons, unemployment was 59.7 thousand persons, and the unemployment rate was 4.1 percent. Total nonfarm employment was 1,343.0 thousand jobs in June 2026, with a 12 month change of 0.4 percent, indicating modest positive growth. Construction employment was 66.8 thousand jobs in June 2026, manufacturing employment was 159.2 thousand, and trade, transportation, and utilities employment was 273.0 thousand jobs, illustrating a mix of industrial, logistics, and services activity.
On the housing side, the All Transactions House Price Index for Arkansas from the Federal Housing Finance Agency rose from 273.60 in the first quarter of 2018 to 478.52 in the first quarter of 2026 on an index where the first quarter of 1980 equals 100; this history is not indicative of future results. HousingHandbook, using population weighted Zillow data, reports a typical and median home value of 226,215 dollars, a median rent of 1,355 dollars, a population of 3,049,715 residents, and 614 ZIP codes statewide. Redfin reports that in May 2026 the statewide median sale price for all home types was 278,012 dollars, up 3.0 percent year over year, with 18,683 homes for sale, up 7.1 percent year over year, and 12.3 percent of homes selling above list price, down 1.9 percentage points year over year.
New residential construction is active but not extreme. The permit data show monthly counts that typically range from several hundred to more than 1,800 units statewide, with recent values such as 1,675 units in March 2025, 1,486 units in December 2025, 1,854 units in March 2026, and 1,150 units in June 2026. Together, these data describe a market with moderate growth, relatively affordable housing by national standards, and a steady supply pipeline. For accredited investors, Arkansas presents opportunities in workforce and middle income multifamily, single family rentals, and industrial and neighborhood retail, particularly in growing metros and logistics corridors, but requires careful attention to micro market fundamentals, limited liquidity, and structural risks such as climate and insurance trends.
Section 02Population and Migration
Arkansas has experienced modest population growth over the last several years. The resident population, measured in thousands of persons as of July 1, was 3,012.161 thousand in 2018, 3,020.985 thousand in 2019, 3,014.399 thousand in 2020, 3,027.127 thousand in 2021, 3,047.429 thousand in 2022, 3,069.856 thousand in 2023, 3,096.080 thousand in 2024, and 3,114.791 thousand in 2025. The series shows that Arkansas’s population was just above three million residents in 2018 and increased by 102.630 thousand persons by 2025. There was a small decline between 2019 and 2020, from 3,020.985 to 3,014.399 thousand persons, which is consistent with national pandemic era disruptions and measurement revisions, but the trend turned positive again after 2020. Growth from 2020 to 2025 added around 100 thousand residents in total, reinforcing the notion of slow but steady expansion rather than rapid in migration.
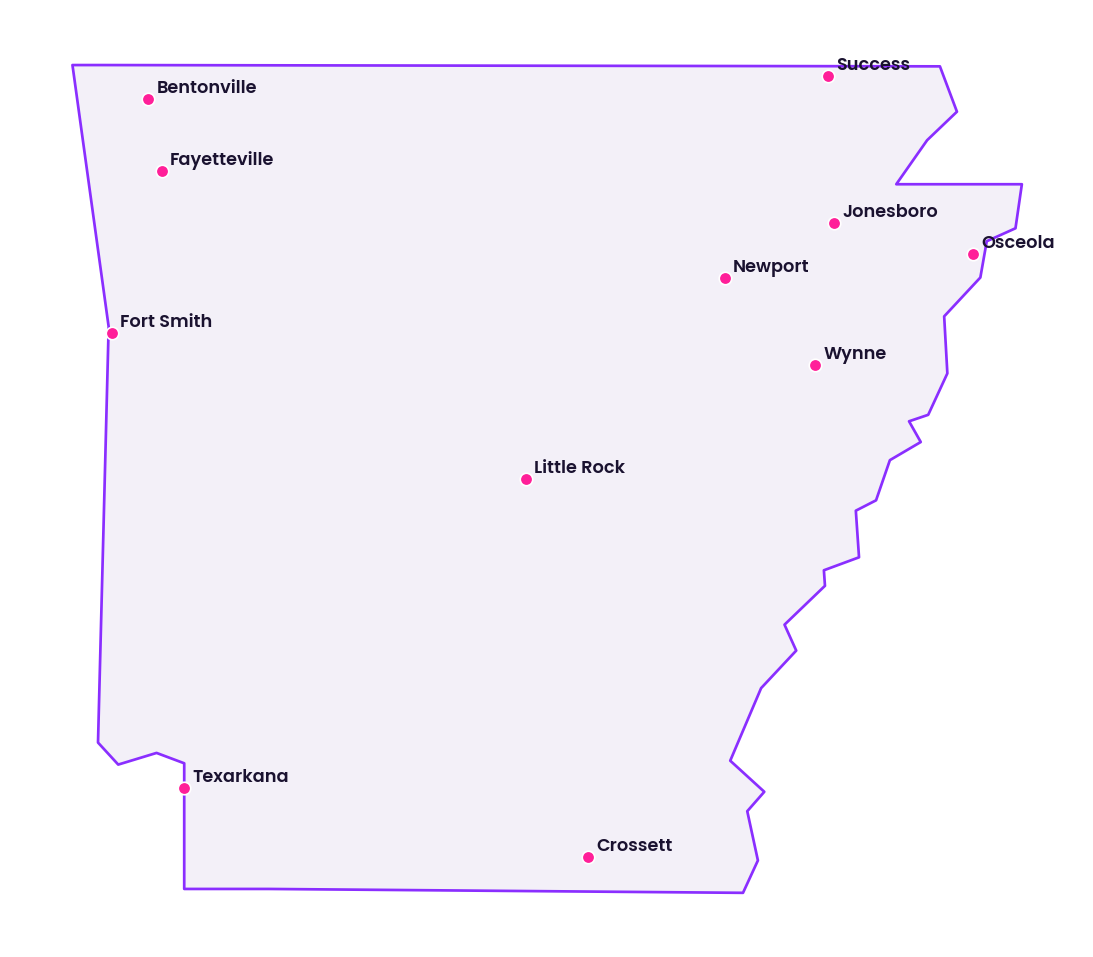
HousingHandbook’s Arkansas profile, using American Community Survey data to weight Zillow values by ZIP code population, reports a statewide population of 3,049,715 residents across 614 ZIP codes, broadly consistent with the federal series for the early to mid 2020s. The public data accessed in this environment do not provide a current, Arkansas specific breakdown of population change into net domestic migration, net international migration, and natural increase, so this review does not present numeric migration component figures. Qualitatively, population growth is concentrated in metropolitan areas such as Northwest Arkansas, including Bentonville, Rogers, Springdale, and Fayetteville, the Little Rock region, and select regional centers, while many rural counties remain flat or declining.
For investors, this pattern suggests that demand for housing and commercial space will be strongest in those metros and corridors, with more limited upside in structurally shrinking rural areas. The modest aggregate growth rate implies that the state is unlikely to see the kind of speculative overshoot seen in some faster growing Sun Belt markets, but it also limits the tide that can lift weaker submarkets.
Section 03Jobs and Economic Anchors
Arkansas’s labor market in 2026 reflects a mature expansion with modest growth and relatively low unemployment. According to the Bureau of Labor Statistics, the statewide seasonally adjusted civilian labor force was 1,451.3 thousand persons in January 2026 and 1,457.7 thousand persons in June 2026. Employment increased from 1,387.7 thousand persons in January to 1,398.0 thousand in June, while unemployment declined from 63.6 thousand persons in January to 59.7 thousand in June. The unemployment rate fell from 4.4 percent in January to 4.1 percent in June 2026.
Total nonfarm wage and salary employment was 1,345.9 thousand jobs in January 2026 and 1,343.0 thousand in June 2026, with the 12 month change in total nonfarm employment easing from 0.8 percent in January to 0.4 percent in June. This indicates that job growth remained positive but subdued, with the state adding jobs at a slower rate than in earlier stages of the expansion.
Sector level data shed light on the state’s economic structure. In June 2026, mining and logging employment was 4.8 thousand jobs, essentially unchanged from a year earlier, with a 12 month change of 0.0 percent, reflecting a small but stable resource sector. Construction employment was 66.8 thousand jobs, with a 12 month change of 0.6 percent, suggesting modest growth after a period of flat or slightly negative trends in early 2026. Manufacturing employment stood at 159.2 thousand jobs, with a 12 month change of negative 0.1 percent, indicating essentially flat manufacturing headcount. Trade, transportation, and utilities, a key driver for logistics and consumer activity, recorded 273.0 thousand jobs, with a 12 month change of 0.8 percent, pointing to moderate growth in those functions. Professional and business services, at 167.3 thousand jobs, grew 1.6 percent over the year, and education and health services, at 210.6 thousand jobs, grew 0.4 percent, while financial activities, at 58.3 thousand jobs, declined 2.7 percent.
Beyond the labor data, the Arkansas Economic Development Commission promotes a portfolio of large certified industrial sites dispersed across multiple regions, including sites near Little Rock, Texarkana, Osceola, Crossett, Jonesboro, Paragould, Newport, and Wynne. The scale and geographic reach of these sites underscore Arkansas’s focus on manufacturing, logistics, and industrial recruitment.
For real estate investors, this economic mix creates a demand base for workforce housing, industrial and logistics properties, and neighborhood retail tied to local employment centers. At the same time, the relatively modest job growth rate and flat manufacturing employment argue for conservative assumptions about long term demand growth, especially in areas without strong population inflows or strategic industrial assets.
Section 04Income
Income growth in Arkansas over the past several years has been substantial, even from a relatively low base. According to the Bureau of Economic Analysis, per capita personal income, in current dollars, was 43,031 dollars in 2018, 43,737 dollars in 2019, 47,131 dollars in 2020, 53,349 dollars in 2021, 53,714 dollars in 2022, 56,540 dollars in 2023, 59,172 dollars in 2024, and 61,752 dollars in 2025. Between 2018 and 2025, per capita personal income in Arkansas increased by 18,721 dollars. The largest single year gain occurred between 2019 and 2020, when the figure rose from 43,737 to 47,131 dollars, consistent with national patterns influenced by pandemic era fiscal transfers and changes in labor markets. From 2020 to 2025, per capita income continued to rise from 47,131 to 61,752 dollars, reflecting wage growth, shifts in industry mix, and growth in certain higher value sectors.
When viewed alongside the resident population series, which shows the population increasing from 3,012.161 to 3,114.791 thousand persons between 2018 and 2025, these numbers imply a meaningful rise in total personal income across the state. For investors, rising per capita incomes support the ability of households to afford higher rents and home prices, particularly in stronger metropolitan areas such as Northwest Arkansas and the Little Rock region. However, Arkansas still remains below the national average in income, which means affordability concerns are acute for lower income households and that rent and price growth must be balanced against local earning power.
Section 05Housing and Multifamily
Arkansas’s housing market has experienced sustained price appreciation without reaching the extreme levels seen in some coastal or high growth Sun Belt states. The All Transactions House Price Index for Arkansas from the Federal Housing Finance Agency tracks statewide home prices on an index where the first quarter of 1980 equals 100. The index stood at 273.60 in the first quarter of 2018, 294.03 in the first quarter of 2020, 314.16 in the first quarter of 2021, 373.54 in the first quarter of 2022, 415.05 in the first quarter of 2023, 437.19 in the first quarter of 2024, 461.06 in the first quarter of 2025, and 478.52 in the first quarter of 2026. From early 2018 to early 2026, the index increased by 204.92 points, with particularly strong appreciation between 2020 and 2022, when it rose from 294.03 to 373.54. Growth continued, albeit at a slower pace, from 373.54 in early 2022 to 478.52 in early 2026; this history is not indicative of future results. This pattern mirrors a national period of rapid house price increases driven by low interest rates and pandemic era housing demand, followed by a deceleration as borrowing costs rose.
HousingHandbook’s Arkansas profile, based on population weighted Zillow Home Value Index data across 614 ZIP codes, reports a typical and median home value of 226,215 dollars statewide, with a median rent of 1,355 dollars and a population of 3,049,715 residents. These figures confirm that Arkansas remains relatively affordable compared with many states, even after recent appreciation. The presence of several high value ZIP codes, such as those in Northwest Arkansas and affluent neighborhoods of Little Rock, indicates meaningful intra state variation.
Publicly accessible data in this environment do not provide a clean statewide time series for multifamily specific metrics such as average asking rents by class, class A versus class B and C vacancy rates, absorption, or cap rates. Those figures are generally available only through private datasets. As a result, this review does not present numeric multifamily vacancy or rent growth percentages. Qualitatively, the combination of rising house prices, moderate incomes, and a substantial renter population suggests steady demand for apartments, especially workforce and middle income product in employment centers. Multifamily properties positioned to provide cash flow at rent levels aligned with local incomes may remain of interest in Arkansas’s metros and college towns, though income and returns are not assured, and investors must rely on local broker data and underwriting to quantify submarket conditions.
Section 06Rents
Rents in Arkansas reflect both the state’s affordability and its moderate wage levels. HousingHandbook’s Arkansas profile, using population weighted Zillow Observed Rent Index data, reports a statewide median rent of 1,355 dollars. This figure represents the median rent across 614 ZIP codes, meaning that a representative rental unit in Arkansas commands a rent in the mid 1,300 dollar range, with higher rents in stronger submarkets such as Bentonville, Fayetteville, and select Little Rock neighborhoods, and lower rents in rural and lower income areas.
The U.S. Department of Housing and Urban Development maintains Fair Market Rents for all counties and metropolitan areas and provides a history covering 1983 through 2026, but the Arkansas specific values are embedded in large files that are not parsable in this environment. Consequently, this review cannot quote Arkansas Fair Market Rents by bedroom count or metro for 2026. Similarly, public free sources accessed here do not expose statewide numeric series for class A versus class B and C multifamily rents or rent growth rates by major Arkansas metros.
Despite these limitations, the data that are available, particularly the relationship between a 226,215 dollar median home value, a 1,355 dollar median rent, and a 61,752 dollar per capita personal income in 2025, suggest that Arkansas households, on average, face a more favorable rent to income relationship than households in many more expensive states. Nonetheless, affordability can still be tight for low income renters, especially in submarkets with limited supply and concentrated employment growth. For investors, this backdrop supports strategies that focus on attainable and workforce multifamily product, where rents are competitive but supportable by broad segments of the local labor force.
Section 07Vacancy
No public statewide dataset accessed for this review provides current numeric vacancy rates by property type for Arkansas. The U.S. Census Bureau publishes national and regional homeowner and rental vacancy rates, and various private data providers maintain detailed vacancy series for multifamily, office, industrial, and retail properties, but those figures are not available through the open sources used here.
As a result, this review does not state specific percentage vacancy rates for Arkansas apartments, single family rentals, office buildings, industrial properties, or retail centers. Qualitatively, modest population growth, rising incomes, and moderate construction activity support relatively healthy occupancy in well located multifamily and single family rental assets, particularly in growing metros and near major employers. Conversely, older or less competitive office buildings and some legacy retail properties, especially in slow growth or rural areas, are likely to face higher vacancy in line with national patterns.
For accredited investors, the absence of statewide public vacancy metrics underscores the need to rely on local brokerage data, property level operating histories, and private sector research to understand occupancy dynamics and to underwrite realistic lease up and rollover assumptions.
Section 08Supply Pipeline
The residential construction pipeline in Arkansas is meaningful relative to the state’s size but remains moderate on an absolute basis. The series that measures new private housing units authorized by building permits in Arkansas, using U.S. Census Bureau data, tracks the number of new private housing units authorized each month statewide. Recent activity illustrates the range. In 2019, monthly counts included 643 units in January, a spike to 2,195 units in August, and 1,322 units in December. In 2021, the state authorized 1,886 units in March, and in 2022 it authorized 1,503 units in June and 708 units in November. In 2023, counts ran from 1,313 units in June to 889 in September, and in 2024 from 1,089 units in February to 1,641 in September. More recently, the state authorized 1,675 units in March 2025, 1,486 units in December 2025, 1,854 units in March 2026, and 1,150 units in June 2026.
These figures show that Arkansas typically authorizes between several hundred and roughly 1,800 new private housing units per month, with occasional spikes such as 2,195 units in August 2019 and 1,886 units in March 2021. This pattern suggests a healthy, though not overwhelming, pipeline that responds to demand and financing conditions.
The series aggregates all private housing units and does not break out multifamily versus single family permits in the accessible data used here, so this review does not provide separate numeric pipelines for apartments versus single family homes. For investors, the key takeaway is that while Arkansas continues to add new housing supply, the scale of development is consistent with modest population growth rather than speculative overbuilding. Submarket level analysis is still crucial, as certain metros or corridors may experience more concentrated deliveries that temporarily soften rents or occupancy.
Section 09Single Family Homes
Single family homes dominate Arkansas’s housing stock and are central to both owner occupier and rental strategies. HousingHandbook’s Arkansas profile, using population weighted Zillow Home Value Index data, reports a typical and median home value of 226,215 dollars statewide, along with a median rent of 1,355 dollars, a population of 3,049,715 residents, and 614 ZIP codes. These numbers place Arkansas well below national median home values, underscoring its relatively affordable positioning.
Redfin’s Arkansas housing market data provide transaction based context. In May 2026, the median sale price for all home types statewide was 278,012 dollars, up 3.0 percent compared with May 2025. In the same month, there were 18,683 homes for sale in Arkansas, a 7.1 percent increase year over year, and 12.3 percent of homes sold above list price, down 1.9 percentage points from one year earlier. This combination, a modest rise in prices, an increase in for sale inventory, and a smaller share of homes closing above list, indicates that the market has shifted from a stronger seller’s environment toward more balanced conditions, though demand remains healthy.
For investors, these metrics suggest that Arkansas’s single family market remains accessible in price terms, with moderate appreciation and increasing inventory. Single family rental strategies can benefit from relatively low acquisition costs and solid tenant demand, particularly in metros with stable job growth and good schools. However, the slowing pace of price gains and higher inventory also mean that underwriting should not assume the rapid appreciation experienced in some prior years. Cash flow resilience, property condition in a humid and storm prone climate, and tenant quality become more decisive than speculative upside.
Section 10Commercial Real Estate and Retail Centers
Arkansas’s commercial real estate market is shaped by its role as a logistics and retail hub and by its mix of manufacturing, health care, education, and government employment. Office space is concentrated in downtown and suburban Little Rock and in regional centers such as Fayetteville, Fort Smith, and Jonesboro, while industrial and logistics facilities cluster around interstate corridors, rail lines, and major distribution centers. Retail includes grocery anchored neighborhood centers, power centers, and local main streets.
Public free datasets accessed for this review do not provide Arkansas specific numeric series for office, industrial, or retail vacancy rates, asking and effective rents, cap rates, or net absorption. Those metrics are generally published by private data providers and local brokerage firms and are not exposed through the open sources used here. As a result, this review does not quote specific percentage vacancies, rent levels, or yield ranges for Arkansas commercial and retail properties.
Qualitatively, industrial and logistics assets in Arkansas benefit from the state’s central location and transportation infrastructure, including interstate highways and rail connections that support distribution to multiple regions. Retail demand is supported by stable population in many markets and by the presence of large employers and institutions. Office markets share national headwinds from hybrid work trends, with older, less efficient buildings likely facing higher vacancy and more pressure on rents, while better located and amenitized properties retain tenants more effectively.
For accredited investors, this environment points toward relative strength in industrial and logistics properties and in necessity oriented retail centers, particularly grocery anchored and service focused centers in growing neighborhoods. Office investments demand more caution, granular tenant by tenant analysis, and realistic capital expenditure planning, given the absence of favorable statewide growth tailwinds and the lack of public metrics to benchmark performance.
Section 11Transactions and Capital Markets
Statewide public data providing comprehensive transaction volumes, aggregate sales values, and average cap rates by property type for Arkansas are not available in the open sources referenced in this review. While deed records and local multiple listing services contain the raw data on transactions, and private data providers compile statewide and metro level statistics, those detailed series are not exposed through federal or state public databases in a form that can be used here.
Accordingly, this review does not present numeric statewide transaction volumes, aggregate dollar volumes of deals, or average cap rate levels for multifamily, single family rental portfolios, office, industrial, or retail properties in Arkansas. Instead, capital market conditions must be inferred qualitatively from national credit conditions, local lending standards, and anecdotal evidence from market participants.
In general, Arkansas’s relatively stable fundamentals and modest growth profile attract investors focused on income and capital preservation rather than aggressive appreciation. Debt availability is influenced by national interest rates and lender risk appetite, while local banks and regional lenders play important roles in financing smaller and mid sized properties. For accredited investors, this means that underwriting and deal sourcing in Arkansas should emphasize realistic entry yields, conservative leverage, and strong in place cash flows rather than speculative expectations of rapid repricing.
Section 12Taxes
Tax policy has a direct effect on real estate returns, but detailed statewide rate tables for Arkansas’s individual income tax, corporate income tax, sales and use taxes, and property tax averages are not visible in the content retrieved from the Arkansas Department of Finance and Administration in this environment. The department administers state taxes and communicates with the public on tax administration matters, but the content available here does not display current tax brackets, statutory rates, or average effective property tax burdens.
Given this limitation, this review does not state specific percentage rates for Arkansas’s income taxes, sales taxes, or typical effective property tax rates by county or municipality. For investors, the practical implication is that tax assumptions in underwriting must be based on up to date schedules and guidance from the Arkansas Department of Finance and Administration and from the relevant local taxing jurisdictions, as well as advice from qualified tax professionals.
In qualitative terms, property taxes, any applicable state and local sales and use taxes, and the treatment of rental income and capital gains in state tax law all affect net operating income and investor returns. Arkansas also makes use of various incentives and financing tools, some of which are administered by the Arkansas Development Finance Authority, to support economic development and housing. Understanding whether a particular project can benefit from such mechanisms is an important part of transaction structuring and risk assessment. This review is not tax advice; investors should consult qualified tax advisors regarding their specific circumstances.
Section 13Insurance
Insurance costs and coverage in Arkansas are influenced by risks such as severe thunderstorms, tornadoes, hail, heavy rainfall, and associated flooding, as well as by broader national reinsurance and capital market trends. The Arkansas Insurance Department oversees consumer protection and industry regulation, assisting residents with insurance related questions and complaints, licensing producers and other regulated parties, overseeing insurer solvency, and reviewing certain health insurance rate filings.
The content retrieved for this review does not provide numeric series on statewide average homeowners, renters, or commercial property insurance premiums, nor does it present rate change percentages or loss ratios. As a result, this review does not quote specific premium levels or percentage increases for Arkansas insurance products. For investors, this means that insurance expenses must be determined through property specific quotes that reflect location, construction type, occupancy, and hazard exposure. Rising claims costs, changing catastrophe models, and reinsurance pricing can all affect premiums and deductibles over time, particularly in areas exposed to wind, hail, and flood risk.
Section 14Landlord Tenant and Regulatory Environment
Arkansas’s landlord tenant framework is established by state statutes and judicial interpretations, with additional influences from local ordinances, building codes, and fair housing enforcement. The public sources accessed for this review do not provide structured summaries or statutory text detailing specific rules on security deposit limits, notice periods, eviction timelines, or rent increase procedures, and legislative and court sites that would contain those details were not parsed in this environment. Accordingly, this review does not quote statute numbers or numeric limits on deposits or fees.
Broadly, Arkansas is often regarded as comparatively favorable to landlords relative to some coastal states, with fewer layers of rent regulation and a legal environment that allows enforcement of lease terms, subject to federal and state fair housing protections. However, the absence of a statewide rent control framework does not mean that there are no protections for tenants, and local practices and court interpretations can vary.
For accredited investors, the key implication is that legal risk around rent regulation may be lower than in more heavily regulated markets, but this cannot be taken for granted. Detailed review by local counsel of current landlord tenant law, eviction procedures, and any applicable local ordinances is essential before making significant investments, especially in markets where political sentiment on housing is evolving.
Section 15Infrastructure
Infrastructure investments and transportation networks are important underpinnings of Arkansas’s real estate markets, especially for industrial, logistics, and commuter oriented housing. The Arkansas Economic Development Commission’s featured properties illustrate the state’s industrial footprint, with large certified sites dispersed across communities such as Little Rock, Texarkana, Osceola, Crossett, Jonesboro, Paragould, Newport, and Wynne. The scale and geographic dispersion of these sites indicate significant rail, road, and utility infrastructure capable of supporting manufacturing and logistics operations.
Detailed content from the Arkansas Department of Transportation was not accessible in this environment, so this review cannot present numeric statistics on highway miles, daily traffic volumes, or capital budgets. Nevertheless, Arkansas’s network of interstate highways, including routes connecting to Memphis, Dallas, St. Louis, and other regional hubs, supports the state’s role in freight movement and regional distribution. Airports in Little Rock, Northwest Arkansas, and other cities provide passenger and cargo connectivity that further bolsters real estate tied to logistics and corporate activity.
For investors, proximity to transportation infrastructure and industrial corridors is a critical determinant of performance for both industrial assets and workforce housing. Properties located near major interchanges, ports, and industrial parks can benefit from tenant demand and employment access, while those in more remote areas may face slower absorption and weaker rent growth. Infrastructure conditions and planned upgrades should therefore be integrated into market selection and underwriting.
Section 16Climate and Physical Risks
Arkansas faces a range of climate and physical risks that can affect real estate. The National Centers for Environmental Information’s Climate at a Glance statewide time series tool provides state level analysis of temperature and precipitation trends, but Arkansas specific numeric series were not visible in the retrieved content. Nevertheless, Arkansas is widely recognized as being exposed to severe thunderstorms, tornadoes, hail, heavy rainfall events, and associated flash and riverine flooding. Seasonal temperature extremes, including hot and humid summers, also influence building performance and operating costs.
The Federal Emergency Management Agency’s Resilience Analysis and Planning Tool includes more than 100 preloaded data layers on population, infrastructure, and hazards, and it draws on the National Risk Index, which identifies communities most at risk from 18 natural hazards across the United States. The materials accessed here do not display Arkansas specific risk scores or frequencies for particular hazards, but they confirm that datasets exist covering risks relevant to the state.
For real estate investors, these climate and physical risks manifest through potential property damage, business interruption, increased insurance premiums and deductibles, and potential regulatory changes around building codes, floodplain development, and resilience standards. Multifamily and single family properties may face roof, siding, and mechanical system stresses from wind and hail, and commercial properties in flood prone areas may require additional mitigation measures. Incorporating site specific hazard assessments and resilience planning into due diligence is increasingly necessary, even in a relatively low cost state like Arkansas.
Section 17Opportunities
The quantitative and qualitative evidence in this review highlights several opportunity themes in Arkansas, each subject to material risk and with no assurance of any particular outcome. First, the state’s steady population growth, from 3,012.161 to 3,114.791 thousand persons between 2018 and 2025, combined with rising per capita income from 43,031 to 61,752 dollars over the same period, supports durable, if modest, demand for housing and consumer oriented real estate. While the growth rate is not dramatic, it provides a foundation for long term income oriented investment.
Second, the All Transactions House Price Index for Arkansas nearly doubled from 273.60 in early 2018 to 478.52 in early 2026, and Redfin’s data show that the median sale price reached 278,012 dollars in May 2026, up 3.0 percent year over year. This indicates that home values have risen meaningfully yet remain well below many national peers, creating a relatively affordable entry point, though any future yield or appreciation is uncertain and not assured.
Third, the supply pipeline, as measured by monthly building permits, shows ongoing construction at levels consistent with the state’s size, without clear signs of overbuilding. Recent permit counts such as 1,675 units in March 2025 and 1,854 units in March 2026 suggest that developers are active but not excessively aggressive. This balance supports long term occupancy and rent stability in well chosen locations.
Fourth, the structure of the Arkansas economy, reflected in the labor data and the Arkansas Economic Development Commission’s industrial site portfolio, supports opportunities in workforce multifamily, single family rentals, and industrial and logistics properties. Large industrial sites in Little Rock, Texarkana, Jonesboro, and other communities provide focal points for job creation and associated housing demand.
Fifth, Arkansas’s relatively low home values and moderate rents, with a 226,215 dollar median home value and a 1,355 dollar median rent, enable investors to target attainable housing segments where local households can afford rent levels, though yields and returns are not assured. In a higher rate environment, these segments may prove more resilient than luxury offerings in more volatile markets.
Section 18Risks
Balanced against these opportunities are several material risks. Economic growth is modest, with total nonfarm employment increasing at a 12 month rate of only 0.4 percent as of June 2026. A cyclical downturn or industry specific shock in sectors such as manufacturing, logistics, or retail could disproportionately affect certain metros and submarkets, putting pressure on occupancy and rent levels.
Second, while home prices remain relatively low in absolute terms, sustained house price appreciation, particularly the increase in the house price index from 294.03 in early 2020 to 373.54 in early 2022 and 478.52 in early 2026, may strain affordability for lower income households; past performance does not indicate future results. Rising mortgage rates exacerbate this issue, potentially shifting more households into the rental market but also limiting the ability of some renters to afford higher rents.
Third, climate and physical risks related to severe weather, flooding, and temperature extremes can increase operating costs, capital expenditure requirements, and insurance premiums. The role of the Arkansas Insurance Department in regulatory oversight and rate review underscores that insurance markets are actively managing property risks, but the lack of explicit numeric premium data in this environment prevents precise quantification. Nonetheless, investors must anticipate that insurance costs may rise over time, particularly for assets in higher risk areas.
Fourth, data limitations themselves constitute a risk. The absence of public statewide metrics for vacancy, commercial rents, and cap rates means that investors must rely heavily on private data and local expertise. Misjudging occupancy, tenant demand, or exit yields due to incomplete information can impair returns.
Finally, liquidity risk is nontrivial. Arkansas’s smaller market size and lower transaction volumes compared with major coastal metros may result in wider bid and ask spreads, longer marketing times, and less predictable pricing at exit, particularly for larger or more specialized assets.
Section 19Investor Implications
For accredited investors, Arkansas represents a classic income oriented, value driven market rather than a speculative growth story. The federal and state data presented here depict a state with steady population and income growth, moderate but consistent house price appreciation, affordable home values and rents, and a diversified but modestly growing economy. These characteristics support strategies focused on durable cash flow rather than aggressive appreciation.
Multifamily investments in Arkansas are likely to perform best when they target workforce and middle income segments in metros with stable or growing employment bases, such as Northwest Arkansas, Little Rock, and select regional centers. Assets with modest leverage, conservative rent growth assumptions, and adequate reserves for capital expenditures and insurance increases are well positioned to weather economic variability.
Single family rental and build to rent strategies can also be compelling, leveraging a 226,215 dollar median home value and strong rental demand at a 1,355 dollar median rent. However, acquisition discipline, careful location selection, and professional management are essential to scaling such portfolios profitably.
Industrial and logistics properties tied to Arkansas’s industrial sites and transportation corridors may offer attractive long term demand, but investors must assess tenant quality, lease terms, and local competition carefully. Retail investments are likely to favor grocery anchored and necessity oriented centers serving established neighborhoods and growth corridors, rather than more discretionary formats.
Across all asset classes, investors should integrate Arkansas specific risks, including climate exposure, local economic concentration, data limitations, and liquidity, into portfolio construction. Partnering with experienced local operators and lenders, using conservative underwriting, and conducting thorough physical and legal due diligence are vital steps to converting the state’s favorable fundamentals into realized returns.
Section 20Conclusion
Arkansas’s statewide real estate and multifamily market in mid 2026 is characterized by moderate growth, relative affordability, and a steady, income oriented opportunity set. Federal Reserve Bank of St. Louis and Bureau of Economic Analysis series document significant gains in per capita income and a meaningful rise in house prices since 2018, while Bureau of Labor Statistics data show a labor market with low unemployment but modest job growth. HousingHandbook and Redfin provide a picture of a housing market where median values and sale prices remain accessible by national standards, with moderate appreciation and rising inventory.
The residential construction pipeline, as reflected in building permit data, indicates continued additions to housing stock without obvious signs of statewide overbuilding. State agencies such as the Arkansas Development Finance Authority and the Arkansas Economic Development Commission emphasize affordable housing, industrial recruitment, and economic development, providing additional context for long term demand drivers.
For accredited investors, Arkansas offers a platform for stable, cash flow oriented investments in multifamily, single family rental, industrial, and necessity retail assets, particularly in metros and corridors with demonstrable employment and infrastructure anchors. Success in this market will depend less on broad macro tailwinds than on disciplined asset selection, conservative leverage, careful attention to climate, insurance, and regulatory risks, and deep local knowledge.
Sources
- U.S. Bureau of Labor Statistics, Arkansas Economy at a Glance,, https://www.bls.gov/eag/eag.ar.htm
- Federal Reserve Bank of St. Louis (FRED), Resident Population in Arkansas (ARPOP),, https://fred.stlouisfed.org/series/ARPOP
- Federal Reserve Bank of St. Louis (FRED), Per Capita Personal Income in Arkansas (ARPCPI),, https://fred.stlouisfed.org/series/ARPCPI
- Federal Reserve Bank of St. Louis (FRED), All Transactions House Price Index for Arkansas (ARSTHPI),, https://fred.stlouisfed.org/series/ARSTHPI
- Federal Reserve Bank of St. Louis (FRED), New Private Housing Units Authorized by Building Permits for Arkansas (ARBPPRIV),, https://fred.stlouisfed.org/series/ARBPPRIV
- HousingHandbook, Arkansas Real Estate Data,, https://housinghandbook.com/state/ar
- Redfin, Arkansas Housing Market: House Prices and Trends,, https://www.redfin.com/state/Arkansas/housing-market
- Arkansas Development Finance Authority,, https://adfa.arkansas.gov/
- Arkansas Department of Finance and Administration,, https://www.dfa.arkansas.gov/
- Arkansas Insurance Department,, https://insurance.arkansas.gov/
- Arkansas Economic Development Commission,, https://www.arkansasedc.com/
- U.S. Department of Housing and Urban Development, Fair Market Rents by State, County, and Metropolitan Area,, https://www.huduser.gov/portal/datasets/fmr.html
- National Oceanic and Atmospheric Administration (NOAA), Climate at a Glance: Statewide Time Series,, https://www.ncei.noaa.gov/access/monitoring/climate-at-a-glance/statewide/time-series
- Federal Emergency Management Agency (FEMA), Resilience Analysis and Planning Tool (RAPT),, https://www.fema.gov/emergency-managers/practitioners/resilience-analysis-and-planning-tool