In brief · summary: Connecticut
Connecticut State Real Estate Market Review
Section 01Executive Summary
Connecticut is a mature, high income, slow growth state where real estate performance is driven less by rapid population expansion and more by income strength, sector mix, and tight for sale inventory. According to the Federal Reserve Bank of St. Louis, using Census Bureau estimates, the resident population was essentially flat over the last decade, rising from 3,574.561 thousand persons in 2018 to 3,688.496 thousand persons in 2025, expressed in thousands of persons as of July 1 each year. Over the same period, per capita personal income rose from 72,159 dollars in 2018 to 98,879 dollars in 2025, placing Connecticut among the highest income states in the country. House prices have appreciated substantially in recent years, as the All Transactions House Price Index for Connecticut from the Federal Housing Finance Agency increased from 390.58 in the first quarter of 2018 to 720.72 in the first quarter of 2026, on an index where the first quarter of 1980 equals 100.
HousingHandbook, which aggregates Census and Zillow data at the ZIP code level, reports a typical and median home value of 433,117 dollars in Connecticut, based on the population weighted median Zillow Home Value Index across 288 ZIP codes, a statewide population estimate of 3,624,508 residents, and a median rent of 2,203 dollars. Redfin’s state level housing market snapshot shows a median sale price of 458,372 dollars in May 2026, up 7.9 percent year over year, with 10,442 homes for sale, down 0.32 percent from a year earlier, and 57.0 percent of homes selling above list price, an increase of 2.1 percentage points year over year. Labor market conditions are softening but still relatively stable, with the Bureau of Labor Statistics reporting a civilian labor force of 1,931.3 thousand persons in January 2026 and 1,889.1 thousand persons in June 2026, and the unemployment rate rising from 4.5 percent in January to 5.2 percent in June.
For accredited investors, these data describe a market with strong incomes, elevated but still rising home prices, tight and competitive for sale conditions, and modest job growth concentrated in education and health services, manufacturing, and professional services. Multifamily assets benefit from high rents and limited new supply, while single family rental and for sale strategies must navigate high entry prices and local tax and insurance structures. Commercial real estate fundamentals vary widely by asset type and location, and investors must lean on metro level broker data for vacancy and cap rate details, as no comprehensive public statewide series exists.
Section 02Population and Migration
Connecticut’s population profile is characterized by long term stability with only modest recent growth. The resident population, based on Census Bureau estimates and expressed in thousands of persons as of July 1, was 3,574.561 thousand persons in 2018, 3,579.643 thousand in 2020, 3,618.707 thousand in 2022, 3,674.449 thousand in 2024, and 3,688.496 thousand in 2025.
HousingHandbook’s statewide profile, which uses American Community Survey data and geographic weighting, reports a population of 3,624,508 residents as of its latest update. Differences between the two series reflect methodological and timing differences, but both point to a state of roughly 3.6 to 3.7 million residents with only small net changes year to year.
Net migration figures by origin and destination for 2024 and 2025 are available in detailed Census migration tables but were not accessible in a consolidated, machine readable format in this environment, so this review does not present specific net domestic or international migration counts. Qualitatively, Connecticut has seen periods of modest out migration to lower cost states offset by in migration of higher income households into certain suburbs, particularly in the southwest corridor linked to the New York metropolitan area. For real estate investors, the key implication is that statewide demand growth is modest, but submarkets tied to strong employment bases and high amenity communities can still see meaningful local demand growth, while weaker towns may experience stagnant or declining populations and associated demand headwinds.
Section 03Jobs and Economic Anchors
Connecticut’s labor market in mid 2026 reflects a high income, service oriented economy with slow job growth and a gradually rising unemployment rate. According to the Bureau of Labor Statistics, the civilian labor force declined from 1,931.3 thousand persons in January 2026 to 1,889.1 thousand persons in June 2026, while employment fell from 1,844.3 thousand to 1,791.6 thousand over the same period. Unemployment increased from 86.9 thousand persons in January to 97.6 thousand in June, and the unemployment rate rose from 4.5 percent to 5.2 percent. Total nonfarm wage and salary employment increased slightly from 1,721.2 thousand jobs in January 2026 to 1,726.5 thousand in June 2026, with the 12 month change in total nonfarm employment at 0.5 percent in June.
Sector detail underscores the state’s economic anchors. In June 2026, manufacturing employment stood at 155.9 thousand jobs, with a 12 month change of 2.1 percent, suggesting modest growth in advanced manufacturing and related activities. Education and health services employed 383.1 thousand people, with a 12 month change of 1.9 percent, reflecting the central role of health care systems and educational institutions in driving employment. Trade, transportation, and utilities accounted for 298.0 thousand jobs, with a 12 month change of 0.2 percent, while professional and business services employed 221.5 thousand people, with a 12 month change of 0.2 percent. Construction employment was 66.1 thousand jobs in June 2026, with a 12 month change of 3.1 percent, indicating relatively stronger growth in construction compared with total nonfarm employment.
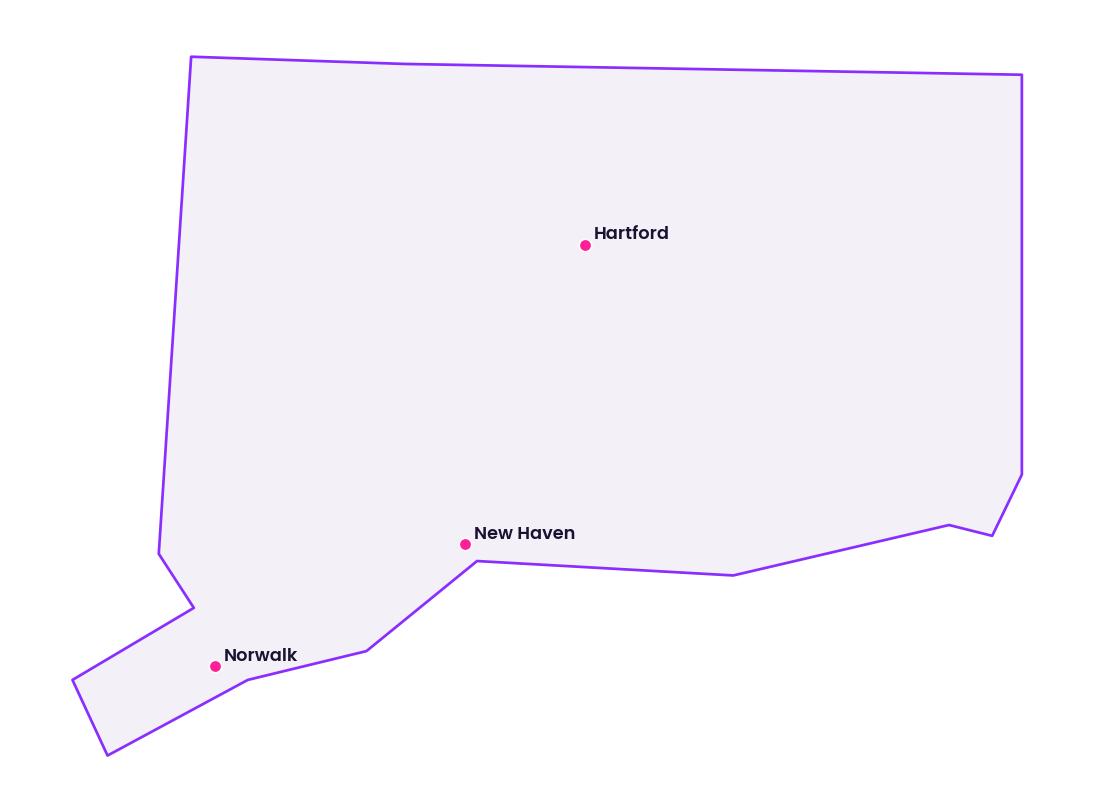
These figures portray an economy anchored by manufacturing, health care, education, and professional services, with some growth in construction. For real estate investors, this mix supports steady demand for multifamily housing near employment centers, especially in metros such as Hartford, New Haven, and Stamford and Norwalk, and provides a base for industrial and logistics demand along key transportation corridors. However, modest overall job growth and a gradually rising unemployment rate also signal that demand expansion is limited relative to higher growth Sun Belt states, and underwriting should reflect realistic assumptions about rent growth and occupancy in line with local employment trends.
Section 04Income
Connecticut’s income profile is a major support for its real estate markets. According to the Bureau of Economic Analysis, per capita personal income was 72,159 dollars in 2018, 76,832 dollars in 2020, 82,126 dollars in 2021, 85,393 dollars in 2022, 90,276 dollars in 2023, 95,083 dollars in 2024, and 98,879 dollars in 2025. This trajectory reflects both wage and investment income growth and places Connecticut near the top of states in per capita income. While the series is statewide and does not capture distributional differences, it highlights the capacity of many households to pay higher rents and home prices, especially in high income suburbs and coastal communities.
For investors, high per capita income is a double edged factor. It supports premium rents and home values, particularly in affluent submarkets, and underpins luxury and upper middle market housing strategies. At the same time, income inequality means that lower income households may face affordability challenges in tight markets, creating both risk and opportunity in workforce and affordable segments. Income linked underwriting, using local median household incomes, rent to income ratios, and income bands rather than state averages, is essential when assessing how much rent growth a particular property can sustain.
Section 05Housing and Multifamily
Connecticut’s house price trajectory over the past several years has been strong, especially coming out of the pandemic period. The All Transactions House Price Index for Connecticut, compiled by the Federal Housing Finance Agency on a base where the first quarter of 1980 equals 100, registered 390.58 in the first quarter of 2018, 412.05 in the first quarter of 2020, 521.43 in the first quarter of 2022, 620.74 in the first quarter of 2024, and 720.72 in the first quarter of 2026. This represents substantial cumulative appreciation over eight years and a particularly pronounced run up from 2020 through 2024 as low interest rates and pandemic era migration patterns drove demand.
HousingHandbook’s statewide profile reports a typical and median home value of 433,117 dollars, defined as the population weighted median of the Zillow Home Value Index across 288 ZIP codes, and a statewide population of 3,624,508. The combination of a high index level and a typical home value above 400,000 dollars places Connecticut firmly in the higher cost tier of housing markets, particularly when combined with per capita income near 100,000 dollars.
For multifamily, these dynamics create both demand and constraints. High for sale prices and tight inventory encourage households to remain renters for longer, supporting occupancy in well located apartment communities. At the same time, high land and construction costs, coupled with a relatively modest new construction pipeline, limit the number of new units that can be delivered profitably. The Connecticut Housing Finance Authority describes its mission as financing affordable housing and helping first time homebuyers, including financing new affordable housing and renovations that convert worn out apartments into comfortable new homes. This public capital plays a particularly important role in the development and preservation of income restricted rental housing, shaping competition and partnership opportunities for investors targeting affordable or workforce segments.
Section 06Rents
Rents in Connecticut are elevated relative to national averages and are supported by high household incomes in many submarkets. HousingHandbook reports a median rent of 2,203 dollars for Connecticut, based on the population weighted median Zillow Observed Rent Index across ZIP codes. When compared with per capita personal income of 98,879 dollars in 2025, this suggests that many higher income households can support market rents, although this relationship varies widely by locality and household type.
The U.S. Department of Housing and Urban Development publishes detailed Fair Market Rent schedules by county and metropolitan area, and fiscal year 2026 values draw on 2023 American Community Survey data and local survey information. Those files provide bedroom size and geography specific values, but within this environment the large statewide Excel and CSV files could not be parsed into a concise, accurate statewide summary, so this review does not reproduce specific Connecticut county level Fair Market Rent dollar amounts. Nonetheless, the presence of these benchmarks is important for investors in voucher supported and income restricted properties, as they help determine maximum allowable gross rents.
For multifamily investors, the combination of a 2,203 dollar median rent and high per capita income indicates room for differentiated rent tiers. Premium Class A properties in affluent suburbs and urban nodes can command rents well above the statewide median, while Class B and C properties in less affluent areas must be priced carefully to avoid excessive rent burdens. Investors should use local rent surveys and property level rent rolls to calibrate expectations, recognizing that statewide medians mask significant intra state variation.
Section 07Vacancy
No official, single statewide public series providing contemporaneous vacancy rates for apartments, offices, industrial properties, or retail centers in Connecticut was identified in the federal and state datasets accessed for this review. Vacancy data for specific property types and metros are typically produced by private vendors and brokerage research platforms, which fall outside the named public sources used here.
Qualitatively, multifamily vacancy is generally lower in employment rich corridors and affluent suburbs, and higher in weaker small town and exurban markets where population growth is stagnant or negative. Office vacancy remains elevated in many central business districts and suburban office parks as hybrid work and space optimization continue, while well located industrial and logistics properties near major highways and ports tend to exhibit tighter vacancy. Retail vacancy varies by format, with grocery anchored and necessity based centers typically better occupied than discretionary power centers and older strip centers. Because numeric statewide vacancy rates are not publicly available in consolidated form, investors should obtain metro and submarket level vacancy and absorption data from brokerage research and local surveys when underwriting specific assets.
Section 08Supply Pipeline
Building permit data indicate that Connecticut continues to add new housing units, but at levels consistent with a mature, slow growth state rather than a high growth Sun Belt market. The series that measures new private housing units authorized by building permits, published by the Census Bureau, counts 454 units authorized in January 2022, 682 in January 2023, and 253 in January 2024, with mid year variation reflecting the seasonality and volatility typical of smaller states. Looking at the most recent data, the series reports 253 units authorized in January 2024, 312 in February 2024, 297 in March 2024, 557 in April 2024, 406 in May 2024, and 328 in June 2024, while for 2026 it records 434 units in January, 211 in February, 240 in March, 458 in April, 593 in May, and 853 in June.
These permit counts cover both single family and multifamily units, and the month to month volatility underscores the need to look at rolling or annual totals when assessing the pipeline. Even so, the absolute numbers, generally in the hundreds rather than the thousands per month, highlight that Connecticut is not facing an overwhelming wave of new supply at the state level. For investors, this suggests that in aggregate, new construction is unlikely to flood the market, but localized submarkets may still see significant new deliveries, particularly in urban centers and transit oriented nodes where multifamily projects are clustered. Underwriting should therefore focus on local permit and construction pipelines, not just statewide totals.
Section 09Single Family Homes
The for sale single family market in Connecticut is both expensive and competitive. HousingHandbook reports a typical and median home value of 433,117 dollars, based on the population weighted median of the Zillow Home Value Index across 288 ZIP codes. Redfin’s statewide housing market data for May 2026 indicate that the median sale price for all home types in Connecticut was 458,372 dollars, an increase of 7.9 percent compared with May 2025. The same snapshot reports that there were 10,442 homes for sale in May 2026, down 0.32 percent year over year, and that 57.0 percent of homes sold above list price, up 2.1 percentage points from a year earlier.
Redfin characterizes this combination of relatively strong year over year price growth, slightly lower inventory, and a majority of transactions closing above list price as consistent with a competitive market where buyers often face bidding pressure. The lack of a public statewide months of supply metric means this review cannot quantify inventory tightness directly, but the fact that more than half of homes sell above asking prices strongly indicates seller leverage in many segments.
For single family rental investors, high purchase prices and rising values compress yields unless rents are set at premium levels or acquisition strategies focus on less expensive submarkets. However, the same affordability pressures that make ownership difficult for some households create sustained rental demand, especially in family oriented neighborhoods with good schools. Investors must weigh property taxes, insurance costs, and capital expenditure needs against expected rent trajectories, and in some cases may find stronger risk adjusted returns in smaller metros or towns where home prices are below the statewide median but demand is stable.
Section 10Commercial Real Estate and Retail Centers
No publicly available statewide database consolidates current vacancy rates, effective rents, or capitalization rates for Connecticut’s office, industrial, and retail sectors into a single time series. Such information is generally compiled by private research platforms and brokerage houses. As a result, this review does not present numeric statewide vacancy or cap rate figures for commercial real estate.
Qualitatively, Connecticut’s office market is anchored by the Hartford metropolitan area and the southwestern corridor that connects to the New York City region. Many legacy office buildings face elevated vacancy due to remote and hybrid work, and tenant preferences for higher quality, amenity rich buildings have widened the performance gap between Class A assets and older stock. Industrial and logistics properties benefit from proximity to Interstate 95, rail connections, and ports and distribution nodes, and tend to have tighter vacancy and stronger rent growth than the office sector, particularly in submarkets that serve both regional and New York adjacent demand. Retail centers are heterogeneous, as grocery anchored and necessity based neighborhood centers in stable or affluent communities often maintain healthy occupancy and rents, while older strip centers and discretionary retail in weaker trade areas may experience higher vacancy and pressure on rents. Investors should supplement the macro context provided here with metro level broker research to obtain precise current data on vacancy, absorption, and pricing for target property types.
Section 11Transactions and Capital Markets
There is no single, comprehensive public database that aggregates all commercial and residential real estate transaction volumes, cap rates, and pricing metrics for Connecticut at the statewide level in a way that can be easily parsed and cited. Transaction data are dispersed across county recorders and assessors, while statewide summaries are typically produced by private data vendors.
From a qualitative capital markets perspective, Connecticut is viewed as a stable, income oriented market attractive to core and core plus investors in certain submarkets, particularly high income coastal communities, strong suburban nodes, and employment centers. Multifamily and industrial assets can access agency, life insurance, and bank financing at spreads and leverage levels influenced by national capital markets conditions and property quality. Office and retail assets face more cautious lender and equity appetite, reflecting sector specific risks. Investors should rely on transaction comparables, broker opinions of value, and lender quotes to calibrate expected entry yields, exit pricing, and financing terms for each opportunity, recognizing that those details are not contained in a public statewide dataset.
Section 12Taxes
The Connecticut Department of Revenue Services administers state income, sales and use, corporation business, and other taxes. Its public site highlights services for individuals and businesses, including online filing and payment, resident and nonresident income tax information, sales and use tax guidance, and corporation business tax resources. However, the specific numeric schedules for current state personal income tax brackets, sales tax rates, and detailed property tax mill rates by municipality are distributed across various publications and calculators, and a single consolidated, machine readable statewide table of effective property tax rates could not be retrieved and parsed within this environment.
For investors, this means that while Connecticut is understood as a relatively high tax state, particularly in certain municipalities, precise tax impacts must be modeled at the asset level using up to date local mill rates, assessed value methodologies, and state income and sales tax rules. Special districts, municipal surcharges, and targeted incentive programs can materially affect net operating income and returns. Investors should obtain current tax information for each property’s jurisdiction and incorporate conservative assumptions about potential valuation and rate changes over the investment horizon.
Section 13Insurance
The Connecticut Insurance Department describes its mission as ensuring that insurance companies follow state laws and treat consumers fairly, regulating insurers in a way that promotes fair competition and makes insurance available, and providing guidance, support, and education. The department uses the National Association of Insurance Commissioners’ electronic filing systems to review insurance rate and form filings and provides public access to non confidential filings through those systems.
The department’s public pages accessed for this review do not provide a single, consolidated numeric table of average homeowners or commercial property insurance premiums by county or coverage type. Premiums and deductibles in practice are highly sensitive to location, building characteristics, coverage levels, and hazard exposure. For Connecticut, relevant hazards include coastal storms, inland flooding, winter storms, and, to a lesser extent, wind and hail for certain areas. Because statewide average premiums could not be identified from public data in this environment, investors should obtain property specific insurance quotes and model potential premium growth and coverage changes, particularly for assets in coastal or flood prone areas where risk and regulatory scrutiny may be higher.
Section 14Landlord Tenant and Regulatory Environment
Connecticut’s landlord tenant framework is defined by statewide statutes and local ordinances, with additional housing related programs and policies administered by agencies such as the Connecticut Housing Finance Authority and other housing bodies. The authority’s public materials emphasize support for first time homebuyers and financing for affordable rental housing and renovations that improve existing apartments, reflecting an institutional focus on housing affordability and stability. However, the pages accessed for this review do not provide a consolidated, numeric summary of key landlord tenant parameters such as maximum security deposits, notice periods, or any statewide rent increase limits.
As of this review, no single public dataset could be retrieved that lists all local rental regulations and tenant protections across Connecticut municipalities in a structured form. For investors, the practical implication is that regulatory risk is moderate but must be assessed locally. State law sets baseline obligations, while cities and towns may adopt additional procedures or protections that affect lease structures, nonpayment remedies, and compliance requirements. Legal review of applicable state and local landlord tenant law should be incorporated into due diligence, especially for portfolios spanning multiple jurisdictions within the state.
Section 15Infrastructure
Connecticut’s infrastructure network, comprised of interstate highways such as Interstate 95 and Interstate 84, commuter and intercity rail lines, ports, and airports, supports both commuter flows to larger regional economies and in state logistics and tourism. While several state agencies publish information on infrastructure planning and funding, such as the Department of Transportation and related offices, this review did not retrieve a concise public dataset summarizing statewide statistics like lane mile counts, average daily traffic by corridor, or aggregate annual capital investment totals.
From an investor’s standpoint, infrastructure matters most at the local level, since proximity to highways and commuter rail shapes industrial and office site selection, quality of local roads and utilities influences development feasibility, and transit availability affects multifamily competitiveness in certain corridors. Because comprehensive statewide infrastructure metrics were not available in a single public series for citation here, investors should evaluate access and planned infrastructure projects asset by asset, using state and municipal planning documents and transportation maps as part of their location due diligence.
Section 16Climate and Physical Risks
Connecticut faces a range of physical risks that are material to real estate underwriting, including coastal storm surge and sea level rise, inland flooding, winter storms, and localized wind and precipitation extremes. The National Centers for Environmental Information’s Climate at a Glance tool provides an interactive interface for examining statewide time series of temperature and precipitation for Connecticut, but the version accessible in this environment presented only the selection interface, with fields for state, location, parameter, time scale, and date range, without numeric climate data that could be parsed into a table. Federal hazard tools such as the Federal Emergency Management Agency’s online mapping platforms similarly provide detailed hazard maps but do not offer simple, aggregated statewide risk scores in a readily consumable format.
Despite these data access limitations, the underlying risks are well recognized. Coastal properties along Long Island Sound are exposed to storm surge and long term sea level rise, riverine and flash flood risks affect inland floodplains, and winter storms can damage infrastructure and buildings across the state. For investors, these hazards manifest in insurance pricing and availability, required property level mitigation measures, and potential disruptions to occupancy and operations. Risk assessments should therefore incorporate property specific hazard mapping, engineering evaluations where appropriate, and conservative assumptions about potential increases in insurance premiums and capital expenditures related to resilience over time.
Section 17Opportunities
Connecticut offers a range of opportunities for accredited investors, particularly those focused on income stability and targeted growth rather than rapid expansion. Multifamily opportunities are strongest in employment rich and high income submarkets where high home prices and limited for sale inventory keep many households in the rental market longer than they might otherwise. The combination of a 2,203 dollar median rent and high per capita income suggests scope for both premium and mid market rental product, provided that pricing aligns with local incomes and competition. Affordable and workforce housing strategies can leverage partnerships or financing programs associated with the Connecticut Housing Finance Authority, which focuses on affordable housing development and homeownership support.
Single family rental strategies can benefit from tight for sale inventory and robust competition in certain price bands, especially in communities with strong school districts and commute access where ownership remains aspirational for many households. Industrial and logistics assets located near interstate corridors, ports, and population centers can tap into regional distribution demand that bridges New England and the New York metropolitan region. Finally, select retail assets, particularly grocery anchored neighborhood centers in stable or affluent neighborhoods, may support relatively more stable cash flows where demographic and income trends support tenant performance. The observations in this section are general and educational, are not projections or assurances of any particular return, occupancy, or rent level, and any specific investment must be evaluated on its own facts.
Section 18Risks
Key risks for investors in Connecticut include modest overall population and job growth, high entry prices, and localized exposure to climate and regulatory changes. The population and labor data show that population and employment growth are slow, with only incremental increases in resident population and a total nonfarm employment growth rate of 0.5 percent year over year as of June 2026. This environment limits the extent to which demand can grow organically and heightens the importance of submarket selection and asset quality. High house prices and rents, as indicated by the house price index, HousingHandbook, and Redfin, compress yields for acquisitions unless underwriting assumptions are conservative and capital structures account for elevated basis.
Tax and insurance burdens can erode returns if not properly underwritten, particularly in municipalities with higher property tax rates or in coastal and flood prone areas where insurance costs may rise. The absence of easily accessible public statewide vacancy and cap rate data increases reliance on private data and local broker intelligence, and investors who misjudge supply and demand balances or exit pricing may face underperformance. Finally, policy shifts around housing, taxes, or environmental regulation, while not captured in historical series, represent a nontrivial source of long term risk. Real estate investments are speculative, are subject to market, financing, liquidity, and physical hazard risks, and can result in the loss of some or all of an investor's invested capital, including the possible loss of principal.
Section 19Investor Implications
For accredited investors, Connecticut should be approached as a complex, income rich but growth limited market where success depends on granular location analysis and disciplined underwriting. Statewide data confirm high incomes, elevated and rising home values, tight for sale inventory, and modest job growth, but these averages mask substantial variation between strong and weak markets. Multifamily strategies may be best focused on durable employment nodes and high amenity suburbs where rent growth can track income growth and new supply is constrained. Single family rental and build to rent opportunities may be strongest in submarkets where home prices are below the statewide median yet household incomes and school quality are supportive.
Commercial strategies should distinguish carefully between property types, since industrial and logistics assets generally offer more favorable fundamentals than office in the current cycle, while retail must be evaluated tenant by tenant and trade area by trade area. Across all segments, investors should model property specific taxes, insurance costs, and potential resilience investments, and structure capital stacks to accommodate modest rent and occupancy growth assumptions. Connecticut can play a constructive role in diversified portfolios as a provider of stable income streams and selective growth, but it rewards patience, deep local knowledge, and a cautious view on leverage and exit pricing. Nothing in this section is a recommendation to pursue any specific strategy or investment, and there is no assurance that any objective described will be achieved.
Section 20Conclusion
Connecticut’s statewide real estate and multifamily market as of August 2026 is characterized by high incomes, strong house price appreciation, tight and competitive for sale conditions, and modest labor market growth. Public data from the Federal Reserve Bank of St. Louis, the Bureau of Labor Statistics, HousingHandbook, Redfin, the U.S. Department of Housing and Urban Development, and state agencies collectively depict a mature market where demand is anchored by income and sector mix rather than rapid population expansion. Opportunities exist across multifamily, single family rental, industrial, and select retail assets, particularly in strong submarkets with robust employment and amenities. At the same time, investors must account for slow aggregate growth, high entry prices, localized hazard and regulatory risks, and the need for detailed local data beyond what is available in statewide public series. For accredited investors, Connecticut is best approached with a focus on durable income, careful submarket selection, and conservative assumptions about growth and capital markets conditions.
Sources
- U.S. Bureau of Labor Statistics, Connecticut Economy at a Glance,, https://www.bls.gov/eag/eag.ct.htm
- Federal Reserve Bank of St. Louis (FRED), Resident Population in Connecticut (CTPOP),, https://fred.stlouisfed.org/series/CTPOP
- Federal Reserve Bank of St. Louis (FRED), Per Capita Personal Income in Connecticut (CTPCPI),, https://fred.stlouisfed.org/series/CTPCPI
- Federal Reserve Bank of St. Louis (FRED), All Transactions House Price Index for Connecticut (CTSTHPI),, https://fred.stlouisfed.org/series/CTSTHPI
- Federal Reserve Bank of St. Louis (FRED), New Private Housing Units Authorized by Building Permits for Connecticut (CTBPPRIV),, https://fred.stlouisfed.org/series/CTBPPRIV
- HousingHandbook, Connecticut Real Estate Data,, https://housinghandbook.com/state/ct
- Redfin, Connecticut Housing Market: House Prices and Trends,, https://www.redfin.com/state/Connecticut/housing-market
- U.S. Department of Housing and Urban Development, Fair Market Rents by State, County, and Metropolitan Area,, https://www.huduser.gov/portal/datasets/fmr.html
- National Centers for Environmental Information (NOAA), Climate at a Glance: Statewide Time Series,, https://www.ncei.noaa.gov/access/monitoring/climate-at-a-glance/statewide/time-series
- Connecticut Department of Revenue Services,, https://portal.ct.gov/drs
- Connecticut Insurance Department,, https://portal.ct.gov/CID
- Connecticut Housing Finance Authority,, https://www.chfa.org/