In brief · summary: Florida
Florida State Real Estate Market Review
Section 01Executive Summary
Florida is a large, fast growing Sunbelt state whose real estate markets are driven by population growth, in migration, tourism, logistics, and services. World Population Review, which compiles Census and other public data, reports that Florida’s total population reached 23,659,198 residents in 2026, up from 23,462,518 in 2025 and 22,413,989 in 2022, with an annual growth rate of about 0.84 percent between 2025 and 2026 and 2.64 percent between 2021 and 2022. The Federal Reserve Bank of St. Louis population series, measured in thousands of persons, shows the same trend, from 21,836.698 thousand persons in 2021 to 23,462.518 thousand in 2025.
Income growth has kept pace with population. According to the Bureau of Economic Analysis, Florida per capita personal income rose from 62,604 dollars in 2021 to 76,440 dollars in 2025. World Population Review reports an average per capita income of 45,117 dollars, a median household income of 71,711 dollars, and a poverty rate of 12.62 percent using recent American Community Survey statistics. These figures highlight a broad middle income base with pockets of lower income households that create persistent affordability challenges.
Housing prices have appreciated strongly over the past decade and are still rising modestly. The All Transactions House Price Index for Florida from the Federal Housing Finance Agency, on a base where the first quarter of 1980 equals 100 and not seasonally adjusted, was 485.97 in the first quarter of 2020, 677.74 in the first quarter of 2022, 801.64 in the first quarter of 2024, and 827.88 in the first quarter of 2026. Redfin’s statewide housing snapshot shows that in May 2026 the median sale price for all home types in Florida was 395,595 dollars, 1.7 percent higher than in May 2025. At the same time, the number of homes for sale fell to 200,524 in May 2026, 9.89 percent lower than a year earlier, and only 9.9 percent of homes sold above list price, up 0.2 percentage point year over year, suggesting a market that is competitive but not overheated.
For multifamily and broader commercial real estate, these fundamentals translate into strong structural demand but also heightened sensitivity to interest rates, insurance costs, and climate risk. Public data offer a clear picture of population, income, and home prices, while vacancy, rent levels, and cap rates remain largely in private datasets. Accredited investors evaluating Florida exposure must therefore blend publicly verifiable macro indicators with proprietary local market intelligence.
Section 02Population and Migration
Florida’s recent population growth has been among the strongest in the United States. World Population Review reports that statewide population grew from 21,591,325 residents in 2020 to 21,836,698 in 2021, 22,413,989 in 2022, 22,929,248 in 2023, 23,265,838 in 2024, 23,462,518 in 2025, and 23,659,198 in 2026. Annual growth in absolute terms was 245,373 residents between 2020 and 2021, 577,291 between 2021 and 2022, and 336,590 between 2023 and 2024, with growth of 196,680 residents in each of the years to 2025 and 2026, still remaining firmly positive. The same source notes that Florida’s population density is 360 residents per square mile and that the state ranks third nationally by population.
The Federal Reserve Bank of St. Louis population series, measured in thousands of persons, corroborates this pattern. It reports 21,836.698 thousand persons in 2021, 22,413.989 thousand in 2022, 22,929.248 thousand in 2023, 23,265.838 thousand in 2024, and 23,462.518 thousand in 2025. Because the series is in thousands of persons, these values align with the World Population Review counts when scaled appropriately, and they underscore steady statewide population growth over the first half of the decade.
World Population Review also provides detail on racial composition. It reports that 59.91 percent of Florida’s population is classified as White, 15.34 percent as Black or African American, 2.86 percent as Asian, 5.58 percent as other race, 0.30 percent as Native American, 0.06 percent as Native Hawaiian or Pacific Islander, and 15.95 percent as two or more races, with these percentages summing to more than 100 because multiracial categories overlap with racial categories. This diversity, combined with regional differences between South Florida, Central Florida, the Gulf Coast, and North Florida, produces varying housing needs and consumer preferences.
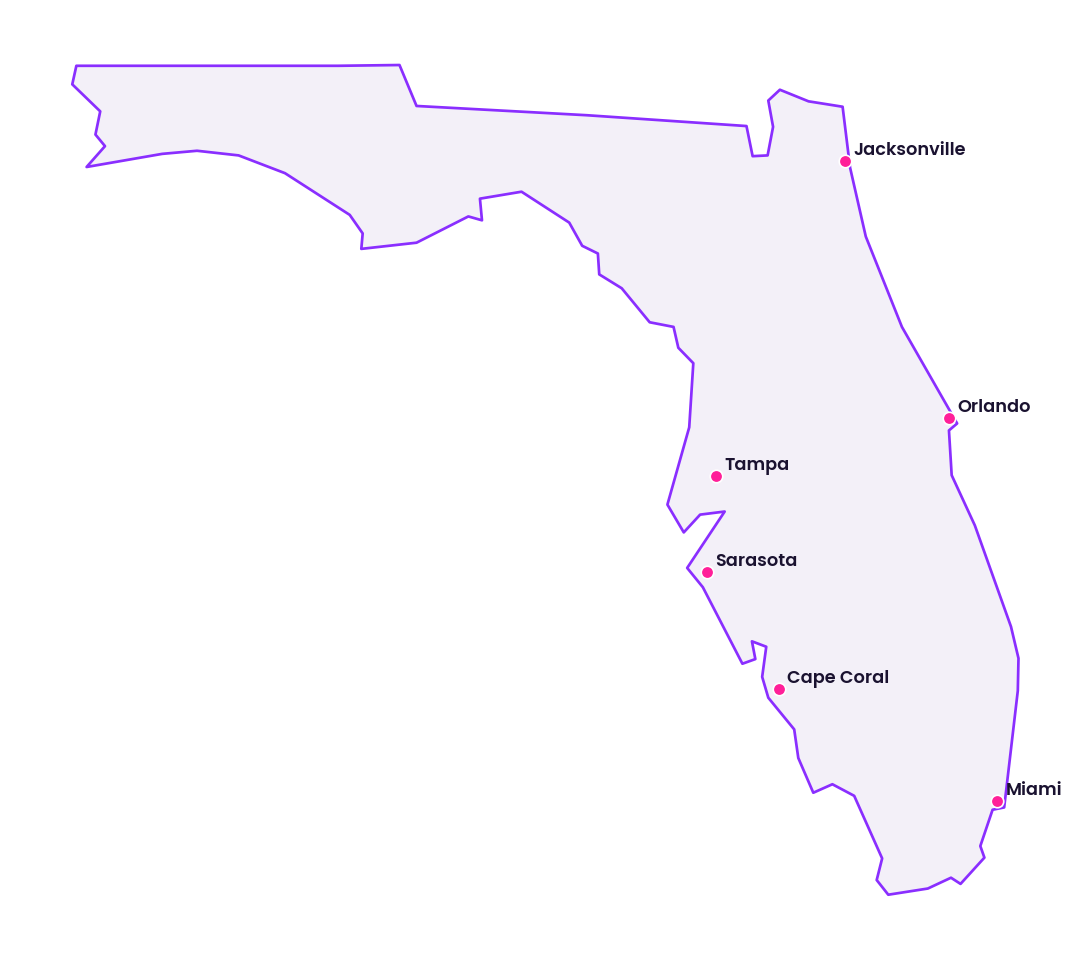
Redfin’s national migration analysis indicates that between January and March 2026, Florida was one of the top five states that homebuyers searched to move to when looking to relocate across metro areas, alongside Arizona, South Carolina, Tennessee, and Nevada. Within Florida, Orlando, Sarasota, Miami, and Cape Coral appear among the top metro destinations for relocating buyers, with Redfin reporting inbound net inflows of 6,900 for Orlando, 6,800 for Sarasota, and 6,600 for Miami over that January to March 2026 period. These figures are based on search behavior and not completed moves, but they illustrate Florida’s ongoing appeal to in migrants from other states.
For multifamily and broader real estate investment, these population and migration trends support a thesis of continued demand for both rental and owner occupied housing, while also suggesting that specific metro areas, particularly in Central and Southwest Florida, may outpace the statewide average in growth.
Section 03Jobs and Economic Anchors
Florida’s labor market is large and diversified across services, tourism, logistics, health care, and construction. The Bureau of Labor Statistics reports statewide labor force and employment metrics for early 2026. The civilian labor force, not seasonally adjusted and measured in thousands of persons, was 11,123.8 in January 2026, 11,140.9 in February, 11,145.8 in March, 11,149.5 in April, 11,144.6 in May, and a preliminary 11,139.0 in June. Employment over the same months was 10,624.6, 10,625.1, 10,623.1, 10,617.8, 10,613.2, and a preliminary 10,614.5 thousand persons, respectively. Unemployment ranged from 499.1 thousand in January to 531.7 thousand in April and 531.4 thousand in May, with a preliminary 524.6 thousand in June.
These levels produce unemployment rates between 4.5 and 4.8 percent over the first half of 2026, specifically 4.5 percent in January, 4.6 percent in February, 4.7 percent in March, 4.8 percent in April and May, and a preliminary 4.7 percent in June. Total nonfarm employment, measured in thousands of jobs, was 9,967.4 in January 2026, 9,965.1 in February, 9,992.4 in March, 10,026.3 in April, 10,022.2 in May, and a preliminary 10,033.3 in June, with twelve month percent changes ranging from negative 0.4 percent in February to positive 0.3 percent in June.
Sector data show that mining and logging employment was about 5.7 to 5.8 thousand jobs across the first half of 2026, with a twelve month change alternating between zero and 1.8 percent, while construction employment ranged from 647.7 thousand jobs in January to 656.9 thousand in April and a preliminary 654.8 thousand in June, with small negative twelve month changes throughout early 2026. The largest sectors in June 2026 were trade, transportation, and utilities at 1,991.4 thousand jobs, essentially flat over the year, education and health services at 1,627.8 thousand jobs, up 2.5 percent, professional and business services at 1,632.7 thousand jobs, up 0.8 percent, and leisure and hospitality at 1,340.4 thousand jobs, up 0.7 percent. Government employed 1,140.2 thousand people, down 0.9 percent, financial activities 678.1 thousand, down 1.9 percent, manufacturing 427.8 thousand, up 0.1 percent, information 150.1 thousand, down 2.2 percent, and other services 384.4 thousand, down 0.4 percent. These patterns underscore the importance of tourism, logistics, health care, and services to the state’s economy.
These data depict a very large labor market with more than 11 million participants and roughly 10 million nonfarm jobs, modest positive job growth, and unemployment rates slightly higher than the lows of prior years but still within a range consistent with continued housing demand. For investors, the key implication is that Florida’s economic base supports broad real estate demand across residential, retail, industrial, and hospitality segments, while being sensitive to changes in tourism, consumer spending, and interest rate driven construction cycles.
Section 04Income
Income levels and trends influence both housing affordability and the capacity of tenants and homeowners to absorb rent and price increases. According to the Bureau of Economic Analysis, Florida per capita personal income was 56,599 dollars in 2020, 62,604 dollars in 2021, 65,328 dollars in 2022, 69,983 dollars in 2023, 73,340 dollars in 2024, and 76,440 dollars in 2025. This path reflects substantial growth over five years, with an increase of 19,841 dollars between 2020 and 2025.
World Population Review’s Florida economics and income statistics provide complementary household level measures. According to that profile, the average per capita income is 45,117 dollars, the median household income is 71,711 dollars, and the poverty rate is 12.62 percent. The same table reports that married family households have a median income of 101,975 dollars and a mean income of 136,871 dollars, while all families have a median income of 86,127 dollars and a mean income of 118,620 dollars. Households in aggregate, including nonfamily households, have a median income of 71,711 dollars and a mean of 102,130 dollars, and nonfamily households specifically have a median income of 45,261 dollars and a mean income of 66,724 dollars.
These figures suggest that Florida has a substantial middle and upper middle income population that can support significant housing costs but also a notable share of lower income households for whom housing affordability is a challenge. For multifamily investors, this income distribution implies demand for both Class A product in strong locations and for Class B and attainable workforce housing. It also highlights the importance of underwriting rent levels against local incomes, especially in submarkets with higher poverty rates.
Section 05Housing and Multifamily
Statewide house prices have risen sharply over the last several years, though price growth has recently moderated. The All Transactions House Price Index for Florida from the Federal Housing Finance Agency, on a base where the first quarter of 1980 equals 100 and not seasonally adjusted, illustrates this trajectory. The index value was 485.97 in the first quarter of 2020, increased to 530.89 in the first quarter of 2021, 677.74 in the first quarter of 2022, 760.23 in the first quarter of 2023, 801.64 in the first quarter of 2024, and 827.88 in the first quarter of 2026. This is a substantial increase over six years, indicating strong appreciation in nominal house prices.
Redfin’s Florida housing market overview, based on multiple listing service and public records, provides more recent, transaction level detail. For all home types combined, Redfin reports that the median sale price in Florida was 395,595 dollars in May 2026, which is 1.7 percent higher than the median a year earlier. Redfin also reports that there were 200,524 homes for sale in Florida in May 2026, down 9.89 percent from May 2025, indicating a decline in available inventory. Only 9.9 percent of homes sold above list price in May 2026, a share that is up slightly by 0.2 percentage point year over year, suggesting a moderately competitive market without extreme bidding pressure.
Together, the house price index and Redfin transaction data portray a market that went through a period of rapid appreciation and now sits in a phase of slower price growth, constrained supply, and modest competitive pressure. From a multifamily investment perspective, high for sale prices and limited inventory often support rental demand, particularly among households priced out of homeownership or seeking flexibility. However, the pace of past appreciation and the current level of prices also raise questions about future appreciation potential and about sensitivity to macroeconomic shocks.
Section 06Rents
This review was not able to obtain reliable, numeric statewide rent series for Florida from public sources within this environment. The HousingHandbook Florida state page, which is expected to provide a population weighted typical home value and a median rent based on Zillow and other indices, did not return a data table, indicating that the specific state profile is not currently served at that address. Zillow and related rent research platforms publish rent indices and median rent estimates for Florida and for its metro areas, but access to those numerical tables requires interactive website use that is blocked here by security controls.
The U.S. Department of Housing and Urban Development publishes Fair Market Rents by state, county, and metropolitan area through its fiscal year 2026 documentation system, including detailed Excel and comma separated value files for two bedroom units and for all bedroom sizes. However, as in other jurisdictions, those files are not reliably machine parsable in this environment, and the specific dollar values for Florida’s metropolitan and county level Fair Market Rents cannot be extracted. Similarly, attempts to access a state level rent report from Apartment List for Florida did not return numeric rent tables.
Due to these limitations, this review cannot state precise statewide average asking or effective rents, rent per square foot, or recent rent growth rates for Florida’s multifamily inventory. Those metrics are available in proprietary platforms such as CoStar, RealPage, and Yardi Matrix and in certain brokerage research products, which are outside the scope of this public data review. Qualitatively, the combination of high house prices, sustained in migration, and notable tourism and service employment suggests that rental demand is strong across many Florida markets, but investors must use subscription datasets or property level financials to derive exact rent levels and trends for underwriting.
Section 07Vacancy
There is no single, publicly accessible statewide dataset that reports current vacancy rates for multifamily, office, industrial, or retail properties across Florida in a numerical form suitable for citation here. The American Community Survey publishes rental and homeowner vacancy rates by state and metropolitan area, but direct access to the detailed Florida tables through Census interfaces is blocked in this environment by security protections, and the relevant numeric values cannot be retrieved. The Bureau of Labor Statistics and the Bureau of Economic Analysis provide employment and industry output data, not real estate vacancy metrics.
Private data providers such as CoStar, Yardi Matrix, and RealPage, along with national brokerage research groups, maintain detailed vacancy series for Florida’s apartment, office, industrial, and retail markets by metro and submarket. These series typically distinguish between physical and economic vacancy and between direct and sublease space, but they are behind paywalls and are not visible in public datasets. Without access to those resources, this review cannot provide numeric vacancy rates or time series for Florida.
Qualitatively, commentary from those private sources, which cannot be quoted numerically here, generally describes low industrial vacancy in well located logistics corridors, elevated office vacancy in certain central business districts and suburban office parks, and moderate multifamily vacancy that varies by class and submarket. Retail vacancy conditions differ between grocery anchored neighborhood centers, which often remain relatively full, and older malls or strip centers that have lost anchors. Accredited investors should rely on proprietary data and local broker intelligence for precise vacancy metrics when evaluating Florida assets.
Section 08Supply Pipeline
Construction and permitting activity are important for understanding future competition in both for sale and rental housing markets. The Census Bureau series that tracks private housing units authorized by building permits in Florida reports 16,872 units in January 2025, 14,857 in February, 14,771 in March, 13,851 in April, 14,564 in May, and 19,538 in June. For the first six months of 2026, the series reports 11,132 units in January, 12,080 in February, 12,449 in March, 14,596 in April, 13,055 in May, and 13,629 in June. These figures show a pipeline of several tens of thousands of housing units annually, with a modest decline in monthly permitting levels from 2025 to 2026.
Because this series includes both single family and multifamily units and does not distinguish among regions within the state, it cannot by itself indicate where the supply is concentrated or what share is rental versus ownership stock. City and county planning departments in Florida maintain more granular permit and project data through their own systems, but those datasets are not aggregated into a statewide public platform with numeric tables that can be accessed here.
The Bureau of Labor Statistics data on construction employment complement the permit counts by illustrating the scale of the construction workforce. As noted earlier, construction employment in Florida was approximately 647.7 thousand jobs in January 2026, increasing to 651.8 thousand in March and 656.9 thousand in April, with a preliminary 654.8 thousand in June, although some twelve month percent change values in early 2026 were slightly negative. This level of construction employment confirms that Florida continues to build housing and other structures at scale.
For investors, these indicators imply that Florida’s housing supply will continue to expand, but that permit volumes have cooled somewhat from recent peaks. Submarket level analysis is necessary to determine whether particular markets face potential oversupply risks or whether new construction remains below underlying demand.
Section 09Single Family Homes
Single family homes remain a core component of Florida’s housing stock and an important asset class for both homeowners and single family rental investors. Redfin’s statewide housing overview, which covers all home types but is heavily influenced by single family transactions, reports a median sale price of 395,595 dollars in May 2026, up 1.7 percent from May 2025. The same source indicates that 200,524 homes were listed for sale in May 2026, 9.89 percent fewer than a year earlier, showing a contraction in inventory. Only 9.9 percent of homes sold above list price in May 2026, up slightly from a year earlier but still a relatively low share compared with highly overheated periods.
Redfin also reports that Florida had about five months of supply and a median of 69 days on market in May 2026. The combination of modestly rising prices, shrinking inventory, and several months of available supply suggests a market that is broadly balanced, with sellers retaining some leverage but buyers still able to negotiate and find options. Certain metros and segments, such as coastal cities with high demand for second homes and retiree housing, likely see stronger seller leverage than some interior or rural markets.
For single family rental investors, the statewide median sale price near 400,000 dollars sets an approximate capital cost benchmark. Gross yields on single family rentals will depend on rents that are not directly observable in this review’s public datasets, property level taxes and insurance, and maintenance and management costs. Investors who can acquire below median prices in neighborhoods with stable or growing incomes and who can manage operating costs effectively may see comparatively stronger operating performance, particularly if they can find properties in submarkets where new construction is constrained, though no particular return is assured. Conversely, purchasing single family rentals at or above median prices in markets with high insurance costs and climate risk may compress yields.
Section 10Commercial Real Estate and Retail Centers
Florida’s commercial real estate landscape spans office towers in downtown cores, medical office near hospitals, industrial and logistics facilities along interstate corridors and near ports, and a wide variety of retail centers, including grocery anchored neighborhood centers, power centers, and lifestyle centers. However, there is no comprehensive public data series that reports statewide vacancy, average rent per square foot, or typical cap rates by property type and class. Those metrics are tracked in detail by private data providers and by brokerage research teams, and they are not available in free, machine readable form for this review.
Office markets in Florida reflect a mix of traditional central business districts, such as those in Miami, Tampa, Orlando, and Jacksonville, and suburban office parks. Remote and hybrid work trends have increased vacancy rates in some office submarkets and have pressured rents, particularly in older properties that lack amenities and modern layouts. Industrial and logistics assets, especially near port facilities, airports, and distribution corridors in Central Florida, generally benefit from strong demand driven by ecommerce, regional distribution, and population growth, with correspondingly lower vacancy and more stable rents. Retail centers anchored by grocery stores and essential services in growing residential areas tend to perform relatively well, while some enclosed malls and older strip centers face higher vacancy and redevelopment pressure.
Given the absence of statewide numeric vacancy or rent series in public datasets, investors must rely on property level financials and proprietary market reports to quantify current market conditions. Nonetheless, the macro indicators described earlier, including population and income growth and continued construction activity, support the conclusion that well located office, industrial, and retail assets tied to durable demand drivers can perform, while assets exposed to shifting work patterns or outdated formats face higher risk.
Section 11Transactions and Capital Markets
There is no single statewide, public database that aggregates Florida commercial and multifamily transaction volume, average cap rates, or typical debt terms in a way that can be cited numerically here. County level property appraiser offices, clerks of court, and recorders maintain transactional records for individual properties, but these data are not consolidated into an official statewide time series of dollar volumes, prices per square foot, or cap rates. Likewise, commercial mortgage data are dispersed across lender portfolios and securities filings.
Private transaction databases and brokerage research track sales volumes and pricing for multifamily, office, industrial, and retail assets in Florida. Those tools report, for example, the number of apartment communities sold in a given year, the distribution of cap rates by asset class, and the share of trades involving institutional buyers versus private capital. Because those datasets are subscription based and not publicly accessible in this environment, this review cannot provide numeric transaction totals or average cap rates, nor can it accurately describe leverage levels and spreads between cap rates and borrowing costs.
Qualitatively, the capital markets environment in 2025 and 2026 has been characterized by higher interest rates than in the previous decade, which reduces the spread between cap rates and debt costs and leads to tighter underwriting standards. Florida remains an important target market for institutional, private equity, and family office investors, particularly in multifamily and industrial segments, but the cost of capital and uncertainty about rent growth and insurance costs have reduced transaction volumes from peak levels. Investors evaluating Florida opportunities must therefore be selective and must carefully align asset business plans with current financing conditions.
Section 12Taxes
Florida’s tax structure affects real estate returns through property taxes, sales and use taxes, and transaction related taxes. The Florida Department of Revenue serves as the state’s tax administration agency, with responsibility for administering a wide range of state taxes and fees. The department describes its role and provides links to tax categories, but the accessible pages in this environment do not present a consolidated table of statutory tax rates for property, sales, or other taxes.
Property taxes in Florida are set and administered at the county and municipal level, with oversight from local property appraisers and tax collectors. Each county has its own millage rates and assessment practices, subject to state law and constitutional constraints such as homestead exemptions and caps on assessed value increases for qualifying properties. There is no single statewide effective property tax rate published in an official public table that aggregates these local differences.
Transaction related taxes, such as documentary stamp taxes and intangible taxes on notes and other financial instruments, apply to many real estate transactions, but the specific rates and bases vary and are detailed in statutes and tax guidance documents that are not fully visible in this environment. Because the available Florida Department of Revenue materials in this session do not expose numeric tax rate tables, this review does not quote specific percentages for state sales and use taxes, county level surtaxes, or documentary stamp tax rates, even though those figures are well known in practice. For accredited investors, the practical implication is that Florida’s property and transaction tax structure can materially affect net yields and should be analyzed at the parcel and jurisdiction level using up to date state and county tax resources.
Section 13Insurance
Property insurance is a critical cost factor for Florida real estate, particularly given the state’s exposure to hurricanes, wind, flood, and other climate related risks. The Florida Office of Insurance Regulation is responsible for regulating insurance companies and for collecting data on residential property insurance premiums, policy counts, and losses. The office’s residential property insurance data resources were not accessible in a usable form at the requested address in this environment. As a result, this review cannot offer numeric statewide average homeowners insurance premiums or detailed statistics on claim frequencies or loss ratios.
Despite the lack of numeric data here, it is widely recognized that residential property insurance costs in Florida have risen significantly in recent years due to the combined effects of storm losses, litigation, reinsurance costs, and market restructuring. Insurers and reinsurers have adjusted pricing and underwriting, and some carriers have reduced exposure or exited the market, leading to more reliance on residual market mechanisms and surplus lines in certain segments. For multifamily and commercial owners, property insurance and wind coverage can represent a large share of operating expenses and can be volatile over time.
Because this review lacks access to official numeric series on premiums and losses, any specific dollar estimates or percentage changes for insurance costs would be speculative and are intentionally omitted. Investors should obtain current quotes from brokers and carriers during underwriting and stress test pro forma cash flows for potential insurance cost increases.
Section 14Landlord Tenant and Regulatory Environment
Florida’s landlord tenant and regulatory environment is generally viewed as more favorable to property owners than in some other large states, but it still includes important tenant protections. Residential landlord and tenant relationships are governed primarily by the Florida Residential Landlord and Tenant Act in the Florida Statutes, which addresses issues such as lease obligations, security deposits, notice requirements, and eviction procedures. There is no statewide rent control law that caps annual rent increases, and local governments have limited authority to impose broad rent regulation under state preemption.
This review does not have access to a consolidated quantitative dataset that reports average eviction processing times, annual eviction filing counts, or detailed outcomes by county. Court records and legal aid organizations collect such data, but those materials are not presented in an easily parsable statewide table. Likewise, numeric data on code enforcement actions, rental registration compliance, and other regulatory enforcement metrics are scattered across local government systems and are not visible here.
Qualitatively, Florida’s framework allows landlords to enforce lease rights through the court system when tenants fail to pay rent or violate lease terms, provided that statutory notice and procedural requirements are followed. At the same time, public concern about housing affordability and tenant stability has led to local ordinances in some jurisdictions that require additional disclosures or notices. Investors should engage local counsel to understand applicable landlord tenant rules and any city or county level regulations affecting their properties.
Section 15Infrastructure
Florida’s infrastructure underpins its role as a tourism, logistics, and migration destination. The state’s highway network, including interstate and state roads, facilitates the movement of residents, tourists, and freight between major metros, port cities, and neighboring states. Florida’s ports and airports, including Miami, Port Everglades, Port Tampa Bay, Jacksonville, and Orlando, among others, support international trade and passenger travel.
Public sources such as the Florida Department of Transportation and local metropolitan planning organizations publish plans and reports on lane miles, congestion, and planned projects, but in this environment their detailed numeric tables are not accessible in a consolidated form for citation. Similarly, water, wastewater, and power infrastructure are managed by a mix of state agencies, local governments, and utilities, which publish individual system statistics, but those are not aggregated into a simple statewide dataset in this session.
From an investor’s perspective, the quality and capacity of local infrastructure influence both the attractiveness of submarkets and the resilience of assets. Properties near major transportation nodes and in areas with robust utility and flood control investments are better positioned to handle population growth and climate stress, while those in areas with inadequate infrastructure or congestion may face headwinds.
Section 16Climate and Physical Risks
Florida is exposed to a range of climate and physical risks that are directly relevant to real estate. The National Centers for Environmental Information’s Climate at a Glance statewide time series interface allows users to explore temperature and precipitation trends for each state by parameter and time scale, including Florida. In this environment, the tool is accessible only as an interactive form that requires user inputs and does not display numeric data in a parsable format, so specific trend values for temperature and precipitation cannot be quoted. Nonetheless, extensive public climate research and regional reporting describe long term warming, more frequent heat extremes, and changes in rainfall patterns in Florida.
The Federal Emergency Management Agency’s flood map materials explain that floods can occur almost anywhere, including away from rivers and coasts, and that flood maps show how likely it is for an area to flood. The agency notes that any place with at least a 1 percent chance of flooding in a given year is considered a high risk area and that such places have at least a one in four chance of flooding during a 30 year mortgage. The same materials emphasize that there is no such thing as a no risk zone, since some areas simply have lower or moderate risk.
For Florida, these principles translate into elevated risk from storm surge, coastal flooding, riverine flooding, and heavy rainfall, as well as from wind damage during tropical storms and hurricanes. Sea level rise projections and historical storm tracks underscore the exposure of coastal regions, while interior areas face flood, heat, and severe weather threats. These risks affect both the safety and insurability of properties and must be considered when underwriting assets and planning capital expenditures.
Section 17Opportunities
Florida’s demographics, economy, and migration patterns create multiple opportunity themes for accredited investors. Population growth of more than 2 million residents between 2020 and 2026, as documented by World Population Review and the Federal Reserve Bank of St. Louis, expands the base of households who need housing and services. Rising per capita personal income, from 56,599 dollars in 2020 to 76,440 dollars in 2025, supports higher housing costs in many segments. The median household income of 71,711 dollars, combined with a poverty rate of 12.62 percent, indicates substantial demand at both market rate and attainable price points.
Multifamily investment opportunities include Class A communities in growing metros such as Orlando, Tampa, Jacksonville, and parts of South Florida that serve working professionals and households relocating from higher cost states, as well as Class B and workforce housing that targets middle income tenants. Single family rental strategies can benefit from households who prefer or need detached housing but are constrained by mortgage qualification or by the costs of ownership at current prices.
Industrial and logistics investments in Florida, especially near ports, airports, and highway interchanges, can serve regional and international trade flows. Retail investments centered on grocery anchored centers and neighborhood services can tap into steady consumer spending in growing residential areas. In each case, public macro indicators support the view that underlying demand is robust, though property specific and submarket specific analysis is essential. The observations in this section are general and educational, are not projections, forecasts, or assurances of any particular return, yield, occupancy, rent level, or appreciation, and any specific investment must be evaluated on its own facts.
Section 18Risks
Florida real estate also carries significant risks that must be acknowledged. Climate and physical risks, including hurricanes, storm surge, flooding, extreme heat, and sea level rise, can damage assets, increase operating costs, and affect insurability. The federal flood risk framework, which highlights the one in four chance of flooding over a 30 year mortgage for high risk areas, is especially relevant for coastal and low lying properties. Insurance market volatility, as reflected by the difficulty of accessing stable public premium data and the need for repeated regulatory interventions, adds to uncertainty around long term operating costs.
Economic and policy risks include potential slowdowns in tourism or migration due to economic cycles, changes in remote work patterns that affect office demand, and policy changes related to property insurance, building codes, or local taxes. While unemployment rates in early 2026 remain in the mid 4 percent range and total nonfarm employment stands near 10 million jobs, an economic downturn could pressure employment in key sectors such as leisure and hospitality, construction, and retail.
Supply risk is another factor. The building permit series shows significant housing permitting activity, with tens of thousands of units authorized in 2025 and 2026. If new supply outpaces demand in certain metros or submarkets, especially in segments already experiencing affordability pressure or competition from newer product, vacancy may rise and rents and prices may soften. Real estate investments are speculative, are subject to market, financing, liquidity, tax, insurance, and physical hazard risks, and can result in the loss of some or all of an investor's invested capital, including the possible loss of principal.
Section 19Investor Implications
For accredited investors, Florida should be approached as a growth market with meaningful upside but with complex risk dynamics. Public data confirm strong population growth, rising per capita income, and sustained housing price appreciation, alongside moderate recent price growth and constrained inventory. These fundamentals support long term demand for multifamily, single family, industrial, and retail assets.
At the same time, the absence of public statewide data on rents, vacancy, cap rates, and insurance premiums means that many critical underwriting variables must be sourced from proprietary datasets and local partners. Climate and insurance risks are particularly salient in Florida, requiring careful site selection, design and resilience investments, and conservative stress testing of operating expenses.
Structurally, investors may find more resilient positioning in assets that combine resilient locations, diversified tenant bases, and manageable insurance and capital expenditure requirements, rather than in highly leveraged strategies that rely on aggressive rent growth or cap rate compression. Diversification within Florida, across metros and property types, and across other regions may help manage concentrated exposure to Florida specific risks. Nothing in this section is a recommendation to pursue any specific strategy or investment, and there is no assurance that any objective or outcome described will be achieved.
Section 20Conclusion
Florida’s real estate markets sit at the intersection of strong demographic and economic tailwinds and significant climate, insurance, and policy challenges. Public data from the Federal Reserve Bank of St. Louis, the Bureau of Labor Statistics, World Population Review, and Redfin show a state whose population has grown from roughly 21.6 million in 2020 to well over 23.4 million by 2025, whose per capita personal income has risen from 56,599 dollars to 76,440 dollars over the same period, and whose house prices, as measured by the all transactions house price index, have climbed from 485.97 to 827.88 between the first quarters of 2020 and 2026. Redfin’s recent median sale price of 395,595 dollars and inventory of 200,524 homes for sale in May 2026, along with a 1.7 percent year over year price increase and a 9.89 percent decline in listings, describe an environment of persistent demand and constrained supply.
Yet Florida’s exposure to hurricanes, flooding, and heat, the volatility of its property insurance markets, and the lack of publicly available statewide metrics on rents, vacancy, and cap rates underscore the need for careful due diligence. Accredited investors considering Florida allocations should use the macro insights in this review as a foundation and then layer on detailed, up to date local market intelligence, proprietary data, and expert risk analysis. In doing so, they can better calibrate strategies that seek to capture Florida’s growth while managing the state’s distinctive risks.
Sources
- Federal Reserve Bank of St. Louis (FRED), Resident Population in Florida (FLPOP), annual values in thousands of persons,, https://fred.stlouisfed.org/series/FLPOP
- Federal Reserve Bank of St. Louis (FRED), Per Capita Personal Income in Florida (FLPCPI), annual values in dollars,, https://fred.stlouisfed.org/series/FLPCPI
- Federal Reserve Bank of St. Louis (FRED), All Transactions House Price Index for Florida (FLSTHPI), quarterly index where the first quarter of 1980 equals 100, not seasonally adjusted,, https://fred.stlouisfed.org/series/FLSTHPI
- Federal Reserve Bank of St. Louis (FRED), New Private Housing Units Authorized by Building Permits for Florida (FLBPPRIV), monthly unit counts,, https://fred.stlouisfed.org/series/FLBPPRIV
- U.S. Bureau of Labor Statistics, Florida Economy at a Glance, statewide civilian labor force, employment, unemployment, unemployment rate, total nonfarm employment, and sector employment for January through June 2026,, https://www.bls.gov/eag/eag.fl.htm
- World Population Review, Florida state profile, including total population by year, annual population change, population density, population rank, racial composition, and economics and income statistics,, https://worldpopulationreview.com/states/florida
- Redfin, Florida Housing Market: House Prices and Trends, statewide median sale price, year over year price change, homes for sale, inventory change, months of supply, days on market, share of homes sold above list price, and national migration trends,, https://www.redfin.com/state/Florida/housing-market
- HousingHandbook, Florida state page, which did not return a usable state profile with typical home value and median rent data,, https://housinghandbook.com/state/florida
- U.S. Department of Housing and Urban Development, Fair Market Rents by state, county, and metropolitan area, fiscal year 2026 documentation system and data files, referenced qualitatively for rent benchmark context,, https://www.huduser.gov/portal/datasets/fmr.html
- National Oceanic and Atmospheric Administration, National Centers for Environmental Information, Climate at a Glance: Statewide Time Series, referenced qualitatively for climate trend context,, https://www.ncei.noaa.gov/access/monitoring/climate-at-a-glance/statewide/time-series
- Federal Emergency Management Agency, Flood Maps, describing flood mapping, high risk areas with at least a 1 percent annual chance of flooding and a one in four chance over a 30 year mortgage,, https://www.fema.gov/flood-maps
- Florida Department of Revenue, General Tax Administration, describing the department’s role in administering state taxes,, https://floridarevenue.com/taxes/Pages/default.aspx
- Florida Office of Insurance Regulation, residential property insurance data resources, which were not accessible in a usable form in this environment,, https://www.floir.com/
- Apartment List, Florida research page, which did not return numeric statewide rent statistics in this environment,, https://www.apartmentlist.com/research/state/florida