In brief · summary: Georgia
Georgia State Real Estate Market Review
Section 01Executive Summary
Georgia is a large and fast growing Sunbelt state anchored by the Atlanta metropolitan area and a diversified mix of logistics, manufacturing, corporate services, and higher education. World Population Review reports that Georgia’s total population reached 11,401,288 residents in 2026, up from 11,302,748 in 2025 and 11,204,208 in 2024, with an annual growth rate of roughly 0.87 percent between 2025 and 2026 and higher growth immediately after 2020. The Federal Reserve Bank of St. Louis shows that the Georgia population series, measured in thousands of persons, increased from 10,732.595 thousand in 2020 to 11,302.748 thousand in 2025, confirming steady expansion.
Economic conditions in early 2026 are mixed. The Bureau of Labor Statistics reports that the statewide civilian labor force was 5,445.6 thousand persons in January 2026 and rose to a preliminary 5,477.9 thousand by June, while employment increased from 5,252.9 thousand to a preliminary 5,294.2 thousand and the unemployment rate edged down from 3.5 percent in January to a preliminary 3.4 percent in June. Total nonfarm employment was roughly flat over the period, around 4,981 to 4,999 thousand jobs, with twelve month changes hovering near zero to 0.2 percent, signaling a mature labor market that is no longer expanding rapidly.
On the housing side, the Federal Housing Finance Agency all transactions house price index for Georgia rose from 391.77 in the first quarter of 2020 to 524.49 in the first quarter of 2022, 619.07 in the first quarter of 2024, and 662.12 in the first quarter of 2026, on a scale where the first quarter of 1980 equals 100. This represents substantial home price appreciation over six years. Redfin reports that there are currently 71,288 homes for sale in Georgia, with a statewide median list price of 395,000 dollars and an average price per square foot of 179 dollars as of the latest snapshot. Together, these indicate an active single family market where pricing has moved materially higher compared with the pre pandemic period.
Reliable public data on statewide apartment rents, vacancy, and cap rates for Georgia are not available in this environment from either federal sources or fully parsable state and private websites. The United States Department of Housing and Urban Development provides Fair Market Rent schedules for Georgia in downloadable Excel and comma separated files, but these files are too large and complex to extract Georgia specific figures here. Private platforms such as CoStar, RealPage, and Yardi Matrix track Georgia multifamily rents and vacancy in detail, but their data are not public. As a result, this review treats rent and vacancy conditions qualitatively while using federal and reputable web sources for population, income, home prices, and macro labor conditions.
For accredited investors, Georgia offers a large and diverse market led by Atlanta and supported by mid sized metros such as Savannah, Augusta, Macon, and Columbus. The combination of population growth, relatively high median household income, and strong logistics and corporate employment favors long term housing demand, while the lack of public multifamily performance series requires careful underwriting based on proprietary data and local insight.
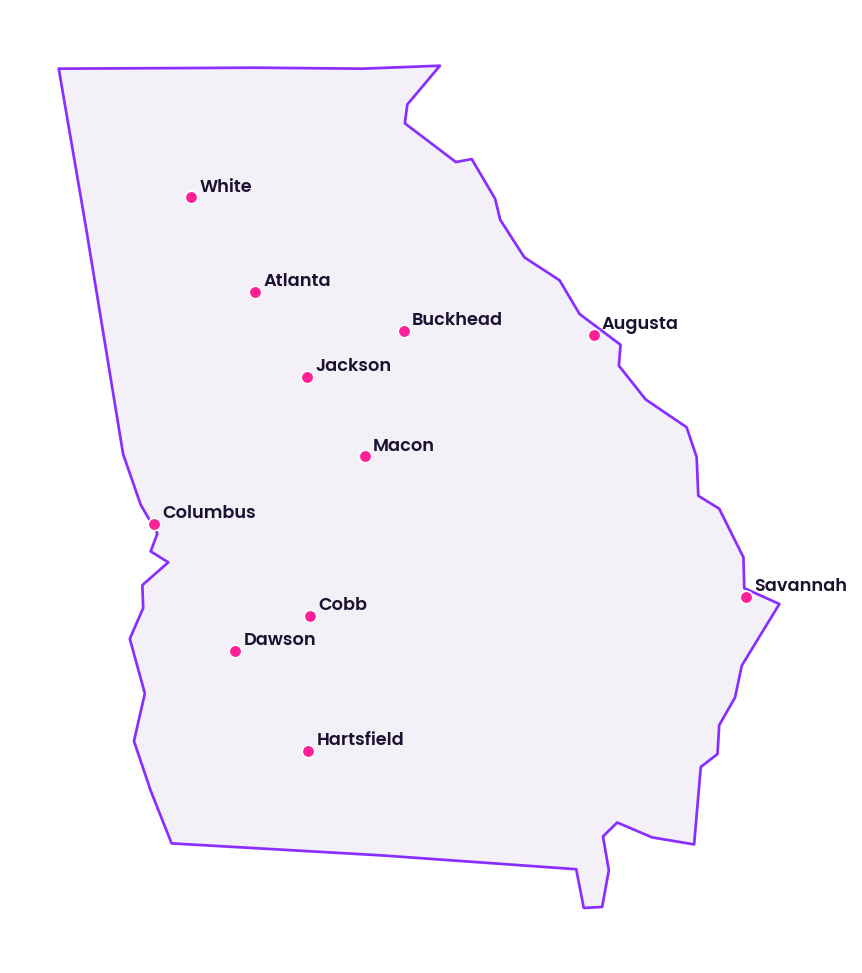
Section 02Population and Migration
Georgia’s population trends show both long term expansion and solid recent growth. World Population Review reports that total population increased from 10,732,595 residents in 2020 to 10,793,038 in 2021, 10,929,992 in 2022, 11,063,669 in 2023, 11,204,208 in 2024, 11,302,748 in 2025, and 11,401,288 in 2026. The same source shows annual changes of 104,575 residents between 2019 and 2020, 60,443 between 2020 and 2021, 136,954 between 2021 and 2022, 133,677 between 2022 and 2023, 140,539 between 2023 and 2024, and 98,540 between 2024 and 2025, with growth rates ranging from 0.56 percent to 1.27 percent in those years, highlighting strong growth in the first half of the 2020s.
World Population Review also notes that Georgia’s population density is 192 residents per square mile and that the state ranks eighth in the United States by population. The population is racially diverse, with White and Black or African American residents comprising the two largest groups, alongside meaningful Asian and multiracial communities.
The Federal Reserve Bank of St. Louis population series, which measures population in thousands of persons, provides another perspective on growth. It reports that Georgia’s population was 10,732.595 thousand persons in 2020, 10,793.038 thousand in 2021, 10,929.992 thousand in 2022, 11,063.669 thousand in 2023, 11,204.208 thousand in 2024, and 11,302.748 thousand in 2025. Although the units differ, these values closely track the World Population Review counts and confirm that Georgia has added roughly 570 thousand residents between 2020 and 2025.
World Population Review’s discussion of county level growth notes that Fulton County has nearly 1.1 million residents, with large suburban counties such as Gwinnett and Cobb each near 800,000 residents, and that some suburban counties such as Dawson and Jackson have grown more than 27 percent since 2020, while certain rural counties have experienced population declines. This pattern indicates that net migration and natural growth are concentrated in the Atlanta region and select suburban and exurban counties, while some rural areas are shrinking. For investors, this means that Georgia’s headline growth masks significant geographic variation in demand, reinforcing the need for metro and submarket level analysis.
Section 03Jobs and Economic Anchors
Georgia’s labor market is broad and service oriented, with major contributions from trade, transportation, and utilities, professional and business services, education and health services, manufacturing, and government. The Bureau of Labor Statistics shows that the statewide civilian labor force, measured in thousands of persons and seasonally adjusted, was 5,445.6 in January 2026, 5,451.1 in February, 5,455.3 in March, 5,461.4 in April, 5,470.7 in May, and a preliminary 5,477.9 in June. Employment was 5,252.9 thousand in January, 5,256.9 in February, 5,262.3 in March, 5,271.1 in April, 5,283.9 in May, and a preliminary 5,294.2 in June. Unemployment ranged between 183.6 and 194.2 thousand persons over those months, and the unemployment rate moved from 3.5 percent in January to a preliminary 3.4 percent in June 2026.
Total nonfarm wage and salary employment, measured in thousands of jobs and seasonally adjusted, was 4,981.4 in January 2026, 4,978.1 in February, 4,988.9 in March, 4,995.5 in April, 4,999.0 in May, and a preliminary 4,988.9 in June. The twelve month change for total nonfarm jobs was 0.1 percent in January, negative 0.1 percent in February, 0.2 percent in March, 0.0 percent in April, 0.1 percent in May, and a preliminary 0.1 percent in June. This indicates that total employment in Georgia in mid 2026 is approximately flat relative to mid 2025, after strong expansion in earlier years.
Sector detail highlights the state’s economic anchors. Trade, transportation, and utilities employment stood at 1,029.2 thousand jobs in January 2026, 1,027.6 in February, 1,028.8 in March, 1,031.7 in April, 1,033.1 in May, and a preliminary 1,028.6 in June, with twelve month changes between negative 1.0 and negative 0.4 percent. This sector, which includes logistics, warehousing, and retail, remains large but has plateaued.
Education and health services employment was 740.8 thousand jobs in January 2026, rising to a preliminary 750.9 thousand by June, with twelve month growth between 3.1 and 3.8 percent, showing that education and health care are expanding even as some other sectors flatten or contract. Leisure and hospitality jobs were about 517.4 thousand in January, increasing to a preliminary 522.6 thousand in June, with twelve month changes around negative 0.4 to positive 0.8 percent, indicating that this sector has largely recovered from earlier disruptions but is not growing rapidly.
Manufacturing employment was approximately 425.7 to 427.9 thousand jobs across the first half of 2026, with twelve month changes between negative 0.7 and negative 0.1 percent, suggesting slightly declining manufacturing employment. Professional and business services counted around 741.7 to 746.2 thousand jobs with twelve month changes between negative 1.1 and negative 0.2 percent, indicating modest contraction.
These figures underscore that Georgia’s economy is large and diversified, with more than 4.9 million nonfarm jobs and a labor force above 5.4 million persons. The Atlanta region concentrates corporate headquarters, technology, and professional services, while statewide logistics, port activity at Savannah, manufacturing, and health care play important roles. For real estate investors, this breadth reduces dependence on any single employer, but the recent flattening in total employment means that demand growth for space and housing may moderate compared with earlier years.
Section 04Income
Per capita personal income in Georgia has risen significantly over the past several years. According to the Bureau of Economic Analysis, Georgia’s per capita income was 51,497 dollars in 2020, 56,257 dollars in 2021, 57,405 dollars in 2022, 60,010 dollars in 2023, 62,875 dollars in 2024, and 65,382 dollars in 2025. This indicates an increase of 13,885 dollars per person between 2020 and 2025.
World Population Review provides complementary income statistics from a household perspective. Georgia’s average per capita income is 48,542 dollars, the median household income is 74,664 dollars, and the statewide poverty rate is 13.48 percent. The same source reports that median income for married families is 111,373 dollars with a mean of 143,975 dollars, median income for all families is 90,337 dollars with a mean of 120,846 dollars, median income for all households is 74,664 dollars with a mean of 103,618 dollars, and median income for nonfamily households is 45,785 dollars with a mean of 64,867 dollars.
These income figures describe a state where many households earn solid middle and upper middle incomes, especially married families and higher income professionals, but where more than thirteen percent of residents live in poverty. For multifamily and single family rental investors, the spread between higher income households and lower income or nonfamily households suggests opportunities across price points, from higher quality rentals and for sale housing in stronger submarkets to more affordable communities that serve working households, provided that pricing and leverage reflect income levels and resilience.
Section 05Housing and Multifamily
The Federal Housing Finance Agency’s all transactions house price index for Georgia offers a long running view of statewide home price movements. On a base where the first quarter of 1980 equals 100, the index was 391.77 in the first quarter of 2020 and rose to 412.10 by the fourth quarter of 2020, 524.49 in the first quarter of 2022, 576.50 in the fourth quarter of 2022, 619.07 in the first quarter of 2024, and 662.12 in the first quarter of 2026. This pattern reflects strong appreciation during and after the pandemic, with particularly rapid growth in 2021 and 2022 and continued, although slower, gains through early 2026. The index is statewide, quarterly, and not seasonally adjusted.
Redfin’s statewide snapshot adds a current market perspective on listing conditions, though it focuses on homes for sale rather than closed transactions. According to Redfin, there are currently 71,288 homes for sale in Georgia, the median list price is 395,000 dollars, and the average list price per square foot is 179 dollars. These numbers indicate that Georgia’s for sale housing market operates at price points that are accessible to many middle income households but are meaningfully higher than pre pandemic levels implied by the house price index.
Public data in this environment do not provide statewide multifamily metrics such as median apartment prices, capitalization rates, or detailed rent rolls. Multifamily properties in Georgia range from large institutional assets in Atlanta and its suburbs, including high rise and mid rise communities, to smaller garden style properties in secondary and tertiary metros and workforce housing in smaller cities. The demand base includes households drawn by job opportunities in logistics, professional services, manufacturing, and health care, as well as students and faculty in university towns.
Because federal sources and accessible state and private websites do not publish a clean statewide multifamily price series, this review cannot present quantitative information on apartment sale prices or cap rates. Instead, investors should use the house price index as a broad indicator of home price momentum and combine it with proprietary multifamily transaction data when evaluating opportunities.
Section 06Rents
Quantitative statewide rent data for Georgia are not available in this environment from public sources that can be parsed cleanly. The United States Department of Housing and Urban Development’s Fair Market Rent system provides fiscal year 2026 documentation and data files, including county level data and small area Fair Market Rents in Excel and comma separated formats. However, the Georgia specific values within those large files cannot be extracted here, so this review does not state dollar amounts for Fair Market Rents in Georgia.
Private platforms such as CoStar, RealPage, and Yardi Matrix compile detailed rent series for Georgia’s apartment markets, including class level and submarket level data, but these datasets are not public. Major consumer facing rental sites such as Apartment List and Zillow do publish rent reports at the state and metro level, yet in this environment their Georgia specific data either require interactive access or are not reliably retrievable. A HousingHandbook state page for Georgia did not return a usable statewide rent summary in this environment. As a result, this review cannot provide reliable numeric statements about average or median apartment rents, rent growth percentages, or rent to income ratios at the Georgia state level.
Qualitatively, Georgia’s mix of growing population, rising incomes, and large metro areas, particularly Atlanta, supports robust demand for rental housing. Rents in prime submarkets of Atlanta and high growth suburbs are likely to be significantly higher than in smaller cities or rural areas, and rent growth over the past several years has probably mirrored broader Sunbelt trends. Nevertheless, any specific monthly rent figures or growth rates must be drawn from proprietary data or direct property level information rather than from the public sources available here.
Section 07Vacancy
There is no statewide, public vacancy rate series for multifamily or commercial properties in Georgia that can be accessed and parsed in this environment. The American Community Survey reports homeowner and rental vacancy rates, but deriving a Georgia statewide time series requires interactive access to Census tools that are not available here. The Bureau of Labor Statistics and the Bureau of Economic Analysis do not publish real estate vacancy measures, and there is no single federal dataset that consolidates Georgia multifamily vacancy across all property types.
Private data providers, including CoStar, Yardi Matrix, and major brokerage research teams, track apartment and commercial vacancy in Georgia’s markets, especially Atlanta and other large metros, but these figures are not public. Because of this, this review cannot state current or historical vacancy rates or changes in vacancy for Georgia apartments, offices, industrial buildings, or retail centers. Any quantitative claim about statewide vacancy would require proprietary or locally compiled data beyond the scope of public sources.
Investors must therefore treat vacancy as a property specific and submarket specific variable and should rely on local brokers, property managers, and subscription data when assessing the health of particular segments.
Section 08Supply Pipeline
Georgia’s housing supply pipeline can be partially observed through building permits data. The Census Bureau series carried by the Federal Reserve Bank of St. Louis reports the number of private housing units authorized by building permits each month for Georgia. Georgia authorized 5,940 private housing units in January 2023, 5,758 units in June 2023, 5,116 units in January 2024, 5,755 units in June 2024, 5,142 units in January 2025, 4,194 units in June 2025, 4,264 units in January 2026, and 5,786 units in June 2026.
These permit counts show that Georgia has been authorizing several thousand housing units per month, with some month to month volatility and a notable dip in mid 2025 before a higher reading in June 2026. Permits cover both single family and multifamily units and thus provide a combined view of residential construction. The level of permitting is consistent with a growing state that continues to build new housing, though it does not directly reveal the mix between apartments and single family homes or the geographic distribution across Atlanta and other metros.
Local planning departments and state housing agencies, including the Georgia Department of Community Affairs, do collect detailed information on affordable housing developments and programs. In this environment, however, attempts to access the department’s site for quantitative data were not successful, so this review cannot add specific unit counts for subsidized or income restricted housing. Overall, Georgia’s pipeline appears active, but investors must examine city and county level permit data and project lists to understand the balance between new supply and demand in individual submarkets.
Section 09Single Family Homes
Georgia’s single family home market is shaped by the strong growth of Atlanta and its suburbs and by moderate price levels in smaller cities and rural counties. The house price index described earlier shows significant appreciation since 2020, rising from 391.77 in the first quarter of 2020 to 662.12 in the first quarter of 2026. This increase of nearly seventy percent in the index level over six years points to substantial statewide home price gains.
Redfin’s statewide listing snapshot provides a contemporaneous view of for sale inventory and pricing. It reports that there are 71,288 homes for sale across Georgia, with a median list price of 395,000 dollars and an average price per square foot of 179 dollars. These figures apply to all for sale homes, not just single family houses, but in Georgia’s housing stock the majority of listed homes are single family detached or attached units, so the snapshot offers a reasonable view of statewide pricing and inventory.
Redfin does not provide an easily accessible statewide months of supply or year over year median sale price change in the retrieved text, so this review cannot quantify whether Georgia is currently a buyer or seller tilted market in numeric terms. Nonetheless, a for sale inventory of more than seventy thousand homes alongside a median list price below 400,000 dollars suggests that buyers still have choices across price points, even as prices have moved up significantly relative to the pre pandemic period implied by the house price index.
For single family rentals, Georgia is an important market for both small investors and institutional single family rental platforms, especially in Atlanta and its suburbs. The statewide median household income of 74,664 dollars and per capita personal income of 65,382 dollars in 2025 provide capacity for rent payments across a range of price tiers. However, the absence of public rent and vacancy data in this environment means that this review cannot calculate typical gross or net yields for single family rentals. Investors who target single family rentals in Georgia must rely on local sale comparables, rent rolls, and property tax and insurance information for each asset.
Section 10Commercial Real Estate and Retail Centers
Commercial real estate in Georgia spans office towers in downtown Atlanta and Buckhead, suburban office parks, industrial and logistics facilities near interstate corridors and major distribution hubs, and a wide range of retail properties including grocery anchored centers and neighborhood shopping centers. The Bureau of Labor Statistics sector employment data show that trade, transportation, and utilities employ around 1,029 to 1,033 thousand workers in early 2026, indicating a large base of retail and logistics activity. Professional and business services employment, at around 742 to 746 thousand jobs, supports demand for office space, while manufacturing employment of roughly 426 to 428 thousand jobs underpins the industrial base.
Despite this, there is no public statewide dataset accessible in this environment that reports Georgia commercial real estate vacancy rates, rent levels, or cap rates by property type. Data on office vacancy in Atlanta, industrial rents near the Port of Savannah and inland hubs, and retail occupancy and rents in various markets are maintained by private research firms and brokerages. Without access to those series, this review cannot quote numeric vacancy percentages, rental rates per square foot, absorption figures, or capitalization rates for Georgia office, industrial, or retail properties.
Qualitatively, Georgia’s role as a logistics hub through the Port of Savannah, Hartsfield Jackson Atlanta International Airport, and interstate networks suggests that industrial and logistics properties have seen strong demand and rental growth over the past decade, particularly in and around Atlanta and Savannah. Office properties may be more bifurcated, with high quality space in prime submarkets performing better than older buildings in weaker locations, especially given national trends toward remote and hybrid work. Retail performance varies by location and tenant mix, with grocery anchored centers in growing suburbs generally more resilient than older strip centers in less dynamic areas.
Accredited investors who target Georgia commercial assets should pair the macro employment and population context described here with up to date, property type specific datasets to assess current pricing, rent levels, and risk.
Section 11Transactions and Capital Markets
Public information on Georgia wide commercial and multifamily transaction volumes, average cap rates, and pricing is limited in this environment. County level property transfer records provide parcel level data on sale prices and dates but are not centralized into a statewide, publicly accessible series that can be readily extracted here. National transaction and cap rate data compiled by brokerage research teams and private platforms often include Georgia and Atlanta in their coverage, but those figures are not publicly available.
As a result, this review cannot provide quantitative statements such as the total dollar volume of multifamily transactions in Georgia in 2025, the average cap rate for Atlanta Class A apartments, or the distribution of office sale cap rates by submarket. It can only note that higher interest rates since 2022 have increased borrowing costs, reducing the spread between property yields and debt costs across property types.
For accredited investors, this means that capital allocation decisions in Georgia must rely on property specific and submarket specific data from local brokers, lenders, and proprietary databases, using the macro context here as a backdrop rather than as a substitute for precise capital markets information.
Section 12Taxes
Georgia’s tax environment influences real estate returns through property taxes and state level income and sales taxes. The Georgia Department of Revenue administers state income, sales, and other taxes and operates the Georgia Tax Center as an online portal for individuals and businesses to manage their state tax obligations. However, the accessible pages do not present a complete numeric table of state income tax brackets or a consolidated list of local property tax rates.
Property taxes in Georgia are administered primarily at the county level, with most counties levying millage rates on assessed values for county, school district, and sometimes city and special district purposes. These rates vary widely by jurisdiction. In this environment, there is no statewide summary table of effective property tax rates by county or property class that can be cited. Therefore, this review cannot provide specific percentage figures for property tax burdens in Georgia, either for typical single family homes or for multifamily and commercial properties.
Investors should obtain current millage rates and assessment practices for the counties and cities relevant to their assets, and evaluate how reassessments, exemptions, and potential changes in rates could affect net operating income. At the state level, income tax obligations for investors depend on legal structure and residency and require consultation with tax advisors.
Section 13Insurance
Insurance costs are a key part of operating expenses for Georgia real estate, particularly in the face of severe weather and, in some areas, flood risks. The Office of the Commissioner of Insurance and Safety Fire serves as the state’s insurance regulator, overseeing the licensing of insurers and agents, reviewing insurance practices, and handling consumer complaints about insurance providers.
However, the materials accessible here do not provide numeric tables of average property insurance premiums, loss ratios, or claim frequencies for Georgia residential or commercial properties. Accordingly, this review cannot quote typical annual insurance costs as dollar amounts per unit, per square foot, or per insured value for Georgia assets.
Given Georgia’s exposure to severe thunderstorms, tornadoes, hail, and flood risks in certain areas, investors should anticipate that insurance premiums and terms can vary significantly by location, construction type, and loss history. Because of the lack of public quantitative series, investors must rely on quotes from insurance brokers, underwriter feedback, and property specific loss histories to estimate and manage insurance costs.
Section 14Landlord Tenant and Regulatory Environment
Georgia’s landlord tenant framework is set primarily by state law, with local zoning, building, and property maintenance ordinances shaping the operating environment in individual jurisdictions. This review does not have access to a summarized numeric dataset of evictions, rent control measures, or other tenant protections by jurisdiction. However, Georgia is generally regarded as a state with no statewide rent control and with landlord tenant statutes that allow landlords to enforce leases, subject to notice and due process requirements.
Municipalities such as Atlanta have adopted various local housing and zoning ordinances, but there is no statewide atlas of these regulations in the public datasets accessed here. Similarly, eviction data are collected in county court systems and by research organizations, but those series are not readily accessible in a consolidated form in this environment.
For investors, the implication is that Georgia does not impose the kind of extensive rent regulation found in some other states, but that landlords must still comply with building codes, health and safety standards, and fair housing laws, and should review local ordinances in markets where they operate.
Section 15Infrastructure
Georgia’s infrastructure supports its role as a regional and national logistics hub. The state hosts Hartsfield Jackson Atlanta International Airport, one of the busiest airports in the world, and the Port of Savannah, a major container port on the Atlantic coast. While these facilities are central to Georgia’s economic profile, this review does not access numeric throughput or capacity statistics for them in public datasets within this environment.
Roads, bridges, and transit systems are maintained by state and local agencies. County and municipal sites often provide information about planned projects and capital improvement programs, but those documents are not aggregated into a statewide numeric infrastructure table accessible here. Therefore, this review cannot quote lane mile counts, bridge inventories, or transit ridership figures.
From a real estate perspective, Georgia’s established transportation network underpins industrial and logistics demand and shapes residential and commercial location decisions. Properties near major interstates, ports, and transit corridors are likely to benefit from greater accessibility and tenant interest, but detailed infrastructure evaluation must rely on local planning and transportation data beyond the scope of this public source review.
Section 16Climate and Physical Risks
Georgia experiences a humid subtropical climate, with hot summers, mild winters, and substantial rainfall. The National Centers for Environmental Information’s Climate at a Glance tool provides interactive statewide time series for temperature and precipitation, allowing users to select locations and parameters. In this environment, the interface is visible but no numeric time series values can be extracted, so this review cannot state precise changes in Georgia’s average temperature or precipitation over time.
Flood risk is another key physical consideration. The Federal Emergency Management Agency’s flood map materials note that floods can occur almost anywhere and that flood maps show how likely an area is to flood. They explain that any area with at least a one percent chance of flooding in a given year is considered high risk and has at least a one in four chance of flooding over a typical thirty year mortgage period, and that there is no such thing as a no risk zone, only lower or moderate risk areas.
Because parcel level flood hazard data for Georgia properties are available only through interactive mapping tools, this review cannot state the percentage of Georgia land or housing units within high risk flood zones. Investors must analyze flood maps for specific properties and consider elevation, drainage, and storm water infrastructure, especially in coastal and low lying inland areas.
In addition to flooding, Georgia faces risks from hurricanes and tropical storms that move inland from the Atlantic and Gulf coasts, as well as tornadoes and severe thunderstorms in various parts of the state. These hazards influence building codes, insurance underwriting, and operating risk for real estate assets.
Section 17Opportunities
Georgia’s size, growth, and economic diversity generate several opportunity themes for accredited investors. The state’s population of 11,401,288 residents in 2026, combined with an increase of roughly 668 thousand residents since 2020, supports long term housing demand. Income growth, with per capita personal income rising from 51,497 dollars in 2020 to 65,382 dollars in 2025 and median household income of 74,664 dollars, suggests that many households have the capacity to support higher rents and home prices over time, particularly in strong job centers.
The Atlanta metropolitan area, which dominates Georgia’s economy, offers opportunities in multifamily, single family rentals, and commercial properties that benefit from corporate relocation, logistics growth, and professional services clustering. Other metros such as Savannah, supported by port activity, and regional hubs like Augusta, Macon, and Columbus, present opportunities in logistics, workforce housing, and neighborhood retail tied to regional employment bases.
Statewide, ongoing new construction, as reflected in monthly permit counts between roughly 4,000 and 6,000 private housing units, offers opportunities to develop new housing tailored to local demand and to acquire recently built properties at pricing that reflects modern construction and energy standards. Investors with access to proprietary rent and vacancy data and strong local operating partners may focus on submarkets where population and employment growth outpace new supply, though no particular return is assured. The observations in this section are general and educational, are not projections, forecasts, or assurances of any particular return, yield, occupancy, rent level, or appreciation, and any specific investment must be evaluated on its own facts.
Section 18Risks
Georgia’s opportunities come with notable risks. Labor market data indicate that total nonfarm employment growth has slowed to approximately flat on a year over year basis as of mid 2026, with twelve month changes for total nonfarm jobs between negative 0.1 percent and 0.2 percent from January to June 2026. Several sectors, including manufacturing, trade, transportation, and utilities, and professional and business services, show slightly negative twelve month employment changes, signaling that parts of the economy are experiencing mild contraction.
Housing affordability is another concern. The house price index for Georgia increased from 391.77 in the first quarter of 2020 to 662.12 in the first quarter of 2026, while Redfin’s median statewide list price is 395,000 dollars. Even though incomes have risen, rapid home price appreciation can strain affordability for lower and moderate income households, particularly in high demand metros.
Physical climate risks, including flooding, severe storms, and hurricane related impacts, threaten properties in both coastal and inland areas. Federal flood map materials emphasize that areas with at least a one percent annual chance of flooding have a one in four chance of flooding over a thirty year period and that there is no zone without risk. Rising insurance costs and changing underwriting criteria can further affect property economics, especially for assets in higher risk zones.
Finally, because this review lacks public quantitative series on statewide rents, vacancy, and cap rates, there is a risk that investors relying solely on macro indicators may misjudge local market conditions. Underwriting must incorporate high quality proprietary data and local intelligence to avoid overestimating achievable rents or underestimating vacancy and capital expenditure needs. Real estate investments are speculative, are subject to market, financing, liquidity, tax, insurance, and physical hazard risks, and can result in the loss of some or all of an investor's invested capital, including the possible loss of principal.
Section 19Investor Implications
For accredited investors, Georgia represents a large, complex market where macro indicators support a constructive long term outlook but where performance will vary significantly by metro, submarket, and asset type. Population growth, rising per capita and household incomes, and a diversified labor market anchored by logistics, professional services, manufacturing, and education and health services create a broad foundation for demand across multifamily, single family, and commercial assets.
At the same time, the flattening of statewide job growth, continuing affordability pressures, and climate and insurance risks require more conservative underwriting and careful asset selection. In practice, investors should treat Georgia not as a monolithic market but as a portfolio of distinct local markets. Atlanta and its suburbs, port related corridors near Savannah, and high growth suburban counties with strong job and population gains present different opportunity and risk profiles than slower growing rural areas.
Given the lack of public multifamily and commercial operating metrics, qualified investors should lean on partnerships with local operators, property managers, and brokers with strong on the ground insights. Using the macro context provided here as a framing tool, they can then evaluate specific deals using property level rent rolls, expense histories, and yield expectations that account for current financing conditions, taxes, and insurance. Nothing in this section is a recommendation to pursue any specific strategy or investment, and there is no assurance that any objective or outcome described will be achieved.
Section 20Conclusion
Georgia has transformed over decades into a major Sunbelt growth state with more than 11.4 million residents, a population density of 192 residents per square mile, and a diverse racial and economic profile. Per capita personal income has climbed from 51,497 dollars in 2020 to 65,382 dollars in 2025, and median household income stands at 74,664 dollars with a poverty rate of 13.48 percent. The statewide unemployment rate is around 3.4 to 3.5 percent, and total nonfarm employment is nearly five million jobs, though twelve month growth has slowed to roughly zero.
On the housing side, the house price index for Georgia has increased from 391.77 to 662.12 between the first quarter of 2020 and the first quarter of 2026, and Redfin reports a statewide median list price of 395,000 dollars and an average list price per square foot of 179 dollars with more than 71,000 homes for sale. Residential permits show several thousand units authorized each month, indicating an active supply pipeline.
Georgia’s scale, growth, and economic diversity position it as an important market for institutional and private capital alike. However, the absence of public statewide rent, vacancy, and cap rate series underscores the need for investors to pair macro data with robust local and proprietary information. Careful attention to submarket dynamics, physical risk, taxes, and insurance will be critical to harnessing Georgia’s opportunities while managing its risks.
Sources
- U.S. Bureau of Labor Statistics, Georgia Economy at a Glance, statewide civilian labor force, employment, unemployment, unemployment rate, total nonfarm wage and salary employment, and sector employment for January through June 2026, seasonally adjusted,, https://www.bls.gov/eag/eag.ga.htm
- Federal Reserve Bank of St. Louis (FRED), Resident Population in Georgia (GAPOP),, https://fred.stlouisfed.org/series/GAPOP
- Federal Reserve Bank of St. Louis (FRED), Per Capita Personal Income in Georgia (GAPCPI),, https://fred.stlouisfed.org/series/GAPCPI
- Federal Reserve Bank of St. Louis (FRED), All Transactions House Price Index for Georgia (GASTHPI), index where the first quarter of 1980 equals 100, quarterly, not seasonally adjusted,, https://fred.stlouisfed.org/series/GASTHPI
- Federal Reserve Bank of St. Louis (FRED), New Private Housing Units Authorized by Building Permits for Georgia (GABPPRIV), monthly,, https://fred.stlouisfed.org/series/GABPPRIV
- World Population Review, Georgia population and demographics, including total population by year, density, population rank, and economics and income statistics,, https://worldpopulationreview.com/states/georgia
- Redfin, Georgia homes for sale, statewide snapshot reporting homes for sale, median list price, and average price per square foot,, https://www.redfin.com/state/Georgia
- Georgia Department of Revenue, state tax information and the Georgia Tax Center,, https://dor.georgia.gov/taxes
- Georgia Office of the Commissioner of Insurance and Safety Fire, insurance regulation and consumer services,, https://oci.georgia.gov
- U.S. Department of Housing and Urban Development, Fair Market Rents by State, County, and Metropolitan Area, fiscal year 2026 documentation system, referenced qualitatively for rent benchmark context,, https://www.huduser.gov/portal/datasets/fmr.html
- National Oceanic and Atmospheric Administration, National Centers for Environmental Information, Climate at a Glance: Statewide Time Series, referenced qualitatively for climate context,, https://www.ncei.noaa.gov/access/monitoring/climate-at-a-glance/statewide/time-series
- Federal Emergency Management Agency, Flood Maps, describing high risk areas with at least a one percent annual chance of flooding and a one in four chance over a thirty year mortgage,, https://www.fema.gov/flood-maps