In brief · summary: Idaho
Idaho State Real Estate Market Review
Section 01Executive Summary
Idaho continues to be one of the faster growing smaller states in the United States, with both population and income rising and a housing market that remains relatively tight. World Population Review estimates that Idaho’s total population reached 2,058,594 residents in 2026, up from 1,849,328 in 2020, which reflects a cumulative increase of 209,266 people and an annual growth rate of 1.42 percent between 2025 and 2026 alone. The Federal Reserve resident population series, which measures Idaho population in thousands of persons, shows a similar trajectory, rising from 1,849.328 thousand in 2020 to 2,029.733 thousand in 2025. This combination of strong in state growth and in migration has been a core demand driver for housing and services.
On the income side, the Federal Reserve per capita personal income series reports that per capita personal income in Idaho increased from 49,726 dollars in 2020 to 55,603 dollars in 2021, 57,074 dollars in 2022, 59,220 dollars in 2023, 62,346 dollars in 2024, and 64,846 dollars in 2025. World Population Review complements this with a statewide average per capita income of 45,294 dollars and a median household income of 74,636 dollars, along with a poverty rate of 10.64 percent. These figures show a relatively low income state in absolute terms but one with rapid income growth that supports upward pressure on rents and home prices.
House prices have escalated significantly over the past several years. The Federal Housing Finance Agency all transactions house price index for Idaho, as presented by the Federal Reserve, shows the index rising from 511.41 in the first quarter of 2020 to 763.97 in the first quarter of 2022, 821.94 in the first quarter of 2024, and 873.60 in the first quarter of 2026. Redfin’s Idaho housing market summary reports that the median sale price for all home types in Idaho reached 490,757 dollars in May 2026, up 2.9 percent compared with the same month a year earlier, while the number of homes for sale declined 12.4 percent year over year to 10,806 listings and 14.5 percent of homes sold above list price.
Labor market conditions remain relatively healthy. The Bureau of Labor Statistics Idaho table shows that the civilian labor force was 1,009.8 thousand persons in January 2026 and a preliminary 1,000.4 thousand in June 2026. Employment over that period moved from 972.7 thousand to a preliminary 963.6 thousand, with unemployment holding at about 36 to 37 thousand persons and a seasonally adjusted unemployment rate of 3.7 percent in both January and June 2026. Total nonfarm employment rose to a preliminary 886.5 thousand jobs in June 2026, up 0.8 percent over twelve months.
At the same time, there are significant data gaps. Public, machine readable statewide series for market rents, multifamily vacancy, capitalization rates, and transaction volumes are not accessible in this environment. The HUD Fair Market Rent portal documents methodology and provides large Excel and comma separated value files for Idaho counties but does not expose numeric Fair Market Rent values in text. As a result, rents, vacancy, and cap rates must be discussed qualitatively and investors are cautioned to use proprietary and local data for underwriting.
Overall, Idaho presents a growth story anchored in strong population gains, rising incomes, and robust house price appreciation, but with constrained public visibility into multifamily performance and significant exposure to housing affordability, construction cycle, and climate and insurance risks.
Section 02Population and Migration
Idaho’s population has expanded rapidly over the past decade. The Federal Reserve resident population series, measured in thousands of persons, provides a long historical view and shows that Idaho’s population increased from 1,752.074 thousand in 2018 to 1,789.060 thousand in 2019, 1,849.328 thousand in 2020, 1,904.855 thousand in 2021, 1,942.951 thousand in 2022, 1,970.497 thousand in 2023, 2,000.872 thousand in 2024, and 2,029.733 thousand in 2025. World Population Review’s 2026 Idaho profile, which presents person level counts, reports a total population of 2,058,594 residents in 2026 and notes that the population increased by 28,861 people between 2025 and 2026, corresponding to an annual growth rate of 1.42 percent that year.
World Population Review also provides a population density figure of 25 residents per square mile for Idaho in 2026 and ranks the state thirty seventh by population among the states. Its annual growth table shows that Idaho added 55,527 residents in 2021 and 38,096 residents in 2022, with annual growth rates of about 3.00 percent in 2021 and 2.00 percent in 2022 during the peak pandemic era years. The Federal Reserve population series implies a further increase of about 60.268 thousand residents between 2019 and 2020. Growth has since moderated but remains above one percent annually.
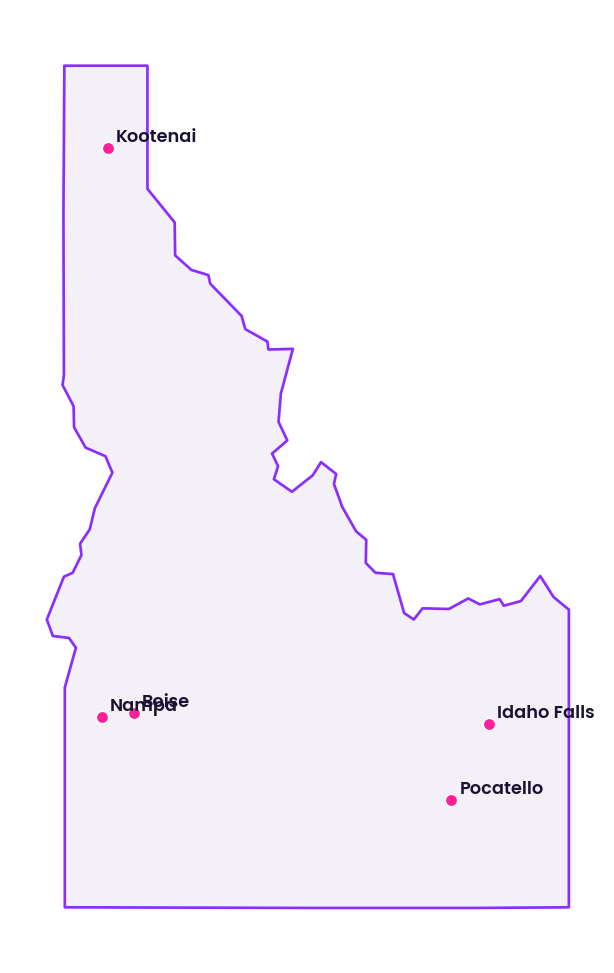
The distribution of population within Idaho is highly uneven. World Population Review reports that Ada County, which includes Boise, is the most populous county with 536,000 residents in 2026 and a growth rate of 7.6 percent since 2020. Canyon County and Kootenai County have grown even faster, with reported growth rates of 16.4 percent and 9.1 percent since 2020 respectively. The state profile notes that population density is far higher in Ada County than in rural counties such as Custer County, which has only about 2 residents per square mile. Clark County, with 783 residents, is the least populous county and is cited as having experienced a population decline of 1.1 percent since 2020.
These patterns confirm that Idaho’s growth is concentrated in a handful of urban and suburban counties, particularly around Boise in Ada and Canyon counties and around Coeur d’Alene in Kootenai County, while large rural areas remain very sparsely populated. For investors, this means that statewide population figures mask sharp differences between fast growing metro counties that attract in migration and more stagnant rural markets. Demand for multifamily and single family rental assets is likely strongest in the growing counties, and local economic and infrastructure conditions there will set the tone for rent growth and absorption.
Public migration data that directly quantify flows into and out of Idaho by origin and destination are not available in this environment. The Redfin national migration analysis embedded on the Idaho housing market page focuses on national patterns and identifies top destination metros in Florida, Nevada, Arizona, and other states, with no numeric entries specific to Idaho. Consequently, while it is widely understood that Idaho has attracted in migration from higher cost states, this review cannot present numeric net in migration figures or detailed flow tables from public sources here.
Section 03Jobs and Economic Anchors
Idaho’s labor market remains relatively tight. The Bureau of Labor Statistics Idaho table shows that the seasonally adjusted civilian labor force was 1,009.8 thousand persons in January 2026 and a preliminary 1,000.4 thousand in June 2026, while employment moved from 972.7 thousand in January to a preliminary 963.6 thousand in June. Unemployment during that period fluctuated only modestly, from 37.1 thousand persons in January to a preliminary 36.8 thousand in June, while the state’s unemployment rate held at 3.7 percent in January, February, May, and June 2026 and dipped slightly to 3.6 percent in March and April. These figures depict an economy at near full employment by historical standards.
Total nonfarm wage and salary employment in Idaho was 878.7 thousand jobs in January 2026 and a preliminary 886.5 thousand jobs in June 2026, representing a twelve month change of 0.8 percent in June according to the Bureau of Labor Statistics. Sector level data show a diversified but service heavy employment base. In June 2026, mining and logging accounted for a preliminary 4.5 thousand jobs, construction for a preliminary 76.4 thousand jobs, manufacturing for a preliminary 77.2 thousand jobs, and trade, transportation, and utilities for a preliminary 168.3 thousand jobs. Information employment was a preliminary 8.7 thousand jobs, financial activities 42.5 thousand jobs, professional and business services 112.2 thousand jobs, education and health services 146.1 thousand jobs, leisure and hospitality 91.7 thousand jobs, other services 30.5 thousand jobs, and government 128.4 thousand jobs.
Twelve month change figures underscore where job growth is strongest. In June 2026, trade, transportation, and utilities employment posted a preliminary 2.1 percent year over year increase, education and health services recorded a 2.0 percent increase, manufacturing employment rose 2.7 percent, and other services employment increased 4.1 percent. Construction employment grew 2.4 percent year over year, while financial activities jobs were up 1.2 percent. In contrast, leisure and hospitality employment declined 3.2 percent over the year and government employment fell 1.4 percent, indicating some softness in visitor related sectors and public employment.
These sector trends highlight that Idaho’s growth is being driven by population serving industries such as trade, transportation, and utilities, as well as health and education, rather than by an outsized expansion in any single export industry. Manufacturing, particularly in food processing and technology related production, remains a meaningful contributor but is not dominant in absolute job counts. Professional and business services, with over 112 thousand jobs, and financial activities, with over 42 thousand jobs, reflect a growing white collar base that is particularly relevant for higher end rental and for sale housing demand in Boise and other metros.
For real estate investors, the main implication is that Idaho’s economic anchors are relatively broad based but tied closely to continued population growth and household consumption. The modest overall employment growth rate of less than one percent year over year suggests a maturing expansion rather than a breakneck boom, and it reinforces the importance of asset selection and submarket positioning rather than relying solely on statewide growth narratives.
Section 04Income
Idaho’s income profile is improving but remains moderate compared with coastal states. The Federal Reserve per capita personal income series, which reports figures in dollars from Bureau of Economic Analysis data, shows a clear upward trend, rising from 49,726 dollars in 2020 to 55,603 dollars in 2021, 57,074 dollars in 2022, 59,220 dollars in 2023, 62,346 dollars in 2024, and 64,846 dollars in 2025.
Between 2020 and 2025, per capita personal income in Idaho increased by 15,120 dollars, which represents a gain of about 30 percent over five years. The large jump from 49,726 dollars in 2020 to 55,603 dollars in 2021 reflects both wage and salary growth and federal transfer payments during and after the acute phase of the pandemic, while the continued increases in subsequent years indicate lasting income growth.
World Population Review provides complementary statistics based on survey and Census data. It reports that Idaho’s average per capita income is 45,294 dollars, the median household income is 74,636 dollars, and the statewide poverty rate is 10.64 percent. The same profile includes a breakdown of median and mean incomes by household type, noting that married families have a median income of 98,274 dollars and a mean income of 124,807 dollars, while all families have a median income of 89,174 dollars and a mean income of 114,047 dollars. Nonfamily households, by contrast, have a median income of 43,770 dollars and a mean income of 60,163 dollars.
These figures show that Idaho has a meaningful share of lower income households alongside a growing middle and upper income segment. The difference between the per capita personal income of 64,846 dollars in 2025 and the average per capita income of 45,294 dollars from the World Population Review profile reflects differences in definitions and time periods, as the Federal Reserve series covers total personal income from all sources divided by total population, while the survey based figure is an average of reported incomes. For investors, the key point is that Idaho households have more capacity to pay rent and mortgages than a decade ago, but affordability remains a constraint for many households, particularly in high cost counties.
Section 05Housing and Multifamily
House prices in Idaho have appreciated sharply since 2020. The Federal Housing Finance Agency all transactions house price index for Idaho, as reported by the Federal Reserve, provides a consistent measure of price trends for repeat financed homes. The index stood at 511.41 in the first quarter of 2020, rose to 763.97 by the first quarter of 2022, reached 821.94 in the first quarter of 2024, and climbed to 873.60 in the first quarter of 2026.
The index is normalized to 100 in 1980, so an index value of 511.41 in the first quarter of 2020 indicates that house prices in Idaho were more than five times their 1980 level at that point. By the first quarter of 2026, the index had reached 873.60, which means that nominal house prices were more than eight and a half times their 1980 level. Between the first quarter of 2020 and the first quarter of 2026, the index increased by 362.19 points, a gain of about 71 percent over six years. The steepest portion of that increase occurred between 2020 and 2022, when the index moved from 511.41 to 763.97, reflecting the intense pandemic era housing boom.
Redfin’s Idaho housing market overview provides a snapshot of current pricing and supply conditions. It reports that in May 2026 the median sale price for all home types in Idaho was 490,757 dollars, up 2.9 percent year over year. The same source notes that there were 10,806 homes for sale in Idaho in May 2026, which is 12.4 percent fewer than a year earlier, and that 14.5 percent of homes sold above list price, an increase of 3.2 percentage points compared with the prior year.
These numbers suggest that while the extreme price run up of 2020 through 2022 has moderated, Idaho remains an expensive market relative to local incomes, and supply is constrained. The combination of rising prices, shrinking for sale inventory, and a meaningful share of homes closing above list price points to a market that is still tilted toward sellers, especially in desirable metros such as Boise, Eagle, Meridian, and Coeur d’Alene.
From a multifamily perspective, sustained price appreciation in the single family and condo markets supports demand for rental housing among households that are priced out of ownership or prefer to rent. The absence of public multifamily specific price indices for Idaho in this environment means that this review cannot quantify appreciation for apartment buildings separately from the overall index. However, the broad strength in the house price index, combined with low unemployment and rising incomes, is consistent with strong investor interest in stabilized and value add multifamily assets statewide.
Section 06Rents
In contrast to house prices and incomes, publicly accessible statewide rent statistics for Idaho are limited in this environment. HUD’s Fair Market Rent portal documents the methodology for developing Fair Market Rents by county and metropolitan area and provides data files for fiscal years 2024 through 2026, but the actual rent amounts for Idaho counties are contained in large Excel and comma separated value files, such as the 2026 county level data and small area Fair Market Rents spreadsheets, which are not parseable here. The text portions of the portal explain that fiscal year 2026 Fair Market Rents are based on 2023 American Community Survey data and local surveys, but they do not list numeric dollar values for Idaho. A national residential data aggregator that sometimes summarizes rents by area returns a not found message for Idaho and therefore cannot supply statewide or metro rent metrics in this review.
Major private rental data providers such as RealPage, Yardi Matrix, and CoStar maintain detailed apartment rent series for Idaho markets, but their data are not available as free public datasets in this environment. Similarly, consumer facing rental listing sites may publish state and city level rent estimates, but attempts to access many of these research pages, as seen in other states, often yield interactive shells without exposed numeric tables.
As a result, this review cannot state median asking rent, effective rent per unit, rent per square foot, or year over year rent growth for Idaho, either statewide or by metropolitan area. Rents must therefore be discussed qualitatively. Based on the significant increase in house prices, the strong population growth, and rising incomes, it is reasonable to infer that market rate rents in Idaho’s major metros have risen over the past several years, especially in Boise and surrounding cities. However, without public numeric series, investors should not make decisions based on assumptions from this narrative alone and must instead rely on proprietary rent rolls, local surveys, and professional datasets when modeling cash flows.
Section 07Vacancy
Public, machine readable data on rental vacancy rates in Idaho are also sparse here. The Census Bureau’s Housing Vacancy Survey provides national and regional vacancy statistics but does not publish readily accessible state level vacancy series in this environment. The American Community Survey includes estimates of rental and homeowner vacancy by state and metropolitan area, but the relevant tables are not accessible through this toolset due to security and format constraints. No alternative public source has been identified that reliably reports statewide or city level multifamily vacancy rates for Idaho.
The same limitation applies to commercial vacancy statistics for office, industrial, and retail properties. While private data providers maintain detailed vacancy series by market and submarket, there is no open dataset in this environment that aggregates such metrics for Idaho.
Consequently, this review cannot provide numeric vacancy rates for apartments, single family rentals, office, industrial, or retail assets in Idaho. Investors should assume that vacancy conditions vary significantly by asset class and submarket, with tighter conditions in high growth metro areas and potentially higher vacancies in rural or structurally challenged markets, and should obtain local leasing data and broker reports to quantify those differences.
Section 08Supply Pipeline
Residential construction activity in Idaho can be tracked through the Federal Reserve building permit series, which measures the number of private housing units authorized by building permits each month statewide. Recent June observations illustrate the scale and variability of permitting, with 2,145 units authorized in June 2022, 1,687 units in June 2023, 1,414 units in June 2024, 1,718 units in June 2025, and 1,660 units in June 2026.
These figures show that statewide permitting remained elevated during the housing boom, with 2,145 units authorized in June 2022, then declined to 1,687 units by June 2023 and 1,414 units by June 2024, before rebounding to 1,718 units in June 2025 and easing slightly to 1,660 units in June 2026. The monthly pattern is volatile, but the broader message is that Idaho continues to add roughly a thousand or more new housing units per month through the permitting process, which over time translates into meaningful new supply in the markets that receive those projects.
The series covers all private residential units, including single family and multifamily. It does not distinguish between apartments and detached houses, nor does it identify specific metros or submarkets. However, given the county level population growth figures from World Population Review, it is reasonable to infer that a disproportionate share of new permits occur in Ada, Canyon, and Kootenai counties, where population growth has been strongest.
Public data from building departments and planning agencies could, in principle, provide more granular insights into the multifamily pipeline, but those local portals are not accessible here in a way that exposes numeric counts by jurisdiction. As a result, investors must view the statewide permit series as a high level indicator that Idaho is sustaining a robust construction pipeline, particularly during peak years, and then rely on local permit databases and brokerage pipeline tracking to understand supply risks in specific metros and submarkets.
Section 09Single Family Homes
Single family homes are a major component of Idaho’s housing stock and play a central role in both owner occupied and single family rental strategies. The statewide house price and permit series discussed earlier, combined with Redfin’s sales data, provide a useful perspective on this segment.
Redfin reports that in May 2026 the median sale price for all home types in Idaho was 490,757 dollars, an increase of 2.9 percent compared with May 2025. While this figure includes condos and townhomes as well as detached houses, Idaho’s housing market is dominated by single family structures, so the median sale price largely reflects the cost of typical single family homes. The same Redfin summary states that there were 10,806 homes for sale in Idaho in May 2026, down 12.4 percent year over year, which indicates a contraction in available for sale inventory.
Redfin also notes that 14.5 percent of Idaho homes sold above list price in May 2026, up 3.2 percentage points from a year earlier. This share of above list transactions suggests that while bidding wars are not as widespread as in peak pandemic years, a significant minority of listings still experience competitive bidding, particularly in attractive neighborhoods and price points.
Together with the house price index, which shows house prices rising about 71 percent between the first quarter of 2020 and the first quarter of 2026, these metrics point to a single family market that has moved from extremely hot to moderately strong. Price appreciation has slowed to a few percent per year, but prices remain far above pre pandemic levels, inventory is relatively tight, and buyer competition persists in key metros.
For investors pursuing single family rental strategies, this environment offers both opportunity and challenge. High purchase prices and elevated interest rates compress entry yields, but strong demand for rental housing from households priced out of ownership, combined with population growth in key counties, can support stable occupancy and rent growth. The absence of public rent and vacancy statistics in this environment makes it essential to underwrite conservatively using property level rent data and realistic maintenance and tax assumptions.
Section 10Commercial Real Estate and Retail Centers
Idaho’s commercial real estate landscape spans office buildings in Boise and other metros, industrial and logistics facilities along major transportation corridors, and a range of retail formats from grocery anchored shopping centers to small town main streets. However, there is no public, machine readable dataset in this environment that provides statewide or metro level vacancy, effective rent, or capitalization rate statistics for office, industrial, or retail properties.
The Bureau of Labor Statistics sector employment data offer an indirect view of demand drivers. Trade, transportation, and utilities employed a preliminary 168.3 thousand workers in June 2026, up 2.1 percent year over year, which supports ongoing demand for distribution, warehouse, and retail space. Education and health services employed a preliminary 146.1 thousand workers, up 2.0 percent year over year, which underpins demand for medical office, educational facilities, and related services. Professional and business services, with 112.2 thousand jobs and modest growth, support demand for office space, particularly in Boise and regional centers. Manufacturing employment of 77.2 thousand jobs, growing 2.7 percent over the year, supports industrial and flex space demand.
Without vacancy or rent series, this review cannot quantify the balance between supply and demand for any of these property types. Anecdotally, industrial and logistics assets in growth corridors have benefited from online commerce and population growth, while some office assets face pressure from hybrid work and corporate footprint decisions. Retail performance varies by format, with grocery anchored and necessity retail generally more resilient than discretionary formats. Investors must therefore supplement this broad sector view with local market reports, broker data, and property level financials when assessing commercial investments in Idaho.
Section 11Transactions and Capital Markets
Publicly accessible transactional and capital markets data for Idaho real estate are limited in this environment. There is no statewide database here that aggregates commercial or multifamily transaction counts, dollar volumes, or capitalization rates by year. County recorder offices maintain property transfer records, and private data providers aggregate and analyze these transactions, but those resources are not exposed as open structured data in this context.
For the ownership housing market, Redfin’s state summary provides some directional insight, though it focuses more on prices and inventory than on transaction counts. The decline in homes for sale from year earlier levels, combined with modest price appreciation and a nontrivial share of sales above list price, suggests that transaction volumes remain active even as inventory tightens. However, without additional explicit public figures for pending sales and absorption, this review cannot present a full transaction history and instead treats the market as active but supply constrained.
Similarly, capitalization rates for commercial and multifamily assets in Idaho are primarily captured in private appraisal and brokerage data. No public series is available here that would allow quoting average cap rates for Boise or other markets. For accredited investors, this means that any assessment of yields, pricing trends, or capital flows into Idaho real estate must rely on proprietary datasets and market intelligence rather than on public time series.
Section 12Taxes
Idaho’s tax environment influences both operating costs and after tax returns for real estate investments. The Idaho State Tax Commission’s public website indicates that income tax withholding tables for 2026 have been updated and that the state child tax credit has sunset, a change that modestly raises the effective tax burden for families who previously claimed that credit. The specific rate and bracket details are contained in withholding tables that are not reproduced here.
The state levies a personal income tax and a sales tax, and local governments levy property taxes that fund schools and other services. However, the Idaho State Tax Commission site does not provide easily extractable numeric tables of property tax rates or effective tax burdens by county in this environment, and this review therefore cannot quote specific property tax mill rates or statewide average effective rates.
For investors, the key takeaway is that Idaho’s overall tax structure is competitive relative to some high tax states but still meaningful in absolute dollar terms, particularly when combined with rising property valuations. Given the absence of numeric statewide tax rate tables here, investors should model taxes based on actual assessments and current local rates for specific properties and should be aware that income tax and credit changes, such as the sunset of the child tax credit, can affect tenant disposable income over time.
Section 13Insurance
Property insurance in Idaho is provided by private carriers under the regulatory oversight of the Idaho Department of Insurance. The department’s public site highlights educational events and features a wildfire risk forum burn demonstration conducted in partnership with the Insurance Institute for Business and Home Safety. The demonstration emphasizes how defensible space and structural hardening can change fire behavior, underscoring that wildfire risk is a central concern in Idaho’s insurance landscape.
Despite this context, there is no public series in this environment that reports typical property insurance premiums per unit, per square foot, or as a percentage of insured value for Idaho residential or commercial properties. Neither the Idaho Department of Insurance site nor other open sources used here publish statewide averages for property insurance costs, nor do they provide time series of premium increases.
Given Idaho’s mix of forested areas, wildland urban interface zones, river valleys, and high plains, insurance costs can vary significantly by location and by property characteristics. Assets in wildfire prone or flood exposed areas may face higher premiums or coverage limitations, while properties in lower risk zones may retain more stable coverage options. Investors should therefore plan to obtain property specific insurance quotes and consider the potential for future premium increases related to wildfire, flood, and other climate driven risks as part of their underwriting.
Section 14Landlord Tenant and Regulatory Environment
Idaho’s landlord tenant law is generally viewed as more landlord friendly than those of many coastal states, but this characterization is based on legal structures rather than public numeric data. The statutory framework sets out rules for lease terms, notice periods, security deposits, and eviction procedures, but the text of those statutes is not quoted here. No statewide public dataset in this environment reports counts of eviction filings, regulated units, or rent controlled properties, and Idaho does not have a broad statewide rent control regime that would generate such statistics.
The absence of rent control and relatively streamlined eviction procedures can make Idaho attractive for certain investment strategies, particularly in comparison with markets that have extensive rent regulation. At the same time, federal fair housing laws and state level protections still apply, and local jurisdictions may adopt ordinances that affect property operations.
Because this review does not parse statutory text and because public quantitative indicators of landlord tenant outcomes are not accessible here, investors must consult legal counsel and property management professionals to understand the precise regulatory obligations that apply to their assets in Idaho. The main point from a market perspective is that regulatory constraints are less likely than in heavily regulated jurisdictions to cap rent growth or delay occupancy changes, which can support more flexible business plans but also shifts more responsibility to owners for ethical and sustainable practices.
Section 15Infrastructure
Idaho’s infrastructure underpins its real estate markets, but detailed numeric data on transportation capacity, transit ridership, or infrastructure spending by region are not available in this environment. The state’s main transportation network consists of interstate highways such as Interstate 84 and Interstate 15, major federal and state routes, and local road systems that connect urban centers like Boise, Nampa, Idaho Falls, Pocatello, and Coeur d’Alene to surrounding rural areas. Freight rail and trucking support agriculture, mining, and manufacturing sectors, while regional airports provide passenger and cargo connections.
Urban infrastructure, especially in the Boise metropolitan area, has been under pressure from rapid population growth. While this review cannot quote vehicle miles traveled, congestion indices, or capital improvement plan budgets, the combination of strong in migration and limited transit options in many areas suggests that roadway and utility capacity are important considerations for new development. In growing counties like Ada, Canyon, and Kootenai, the pace of infrastructure investment relative to population and housing growth will influence the attractiveness of specific corridors and submarkets.
Investors in Idaho real estate should therefore treat infrastructure access and planned upgrades as key underwriting factors, using local planning documents and on the ground assessment to evaluate connectivity, capacity, and potential bottlenecks.
Section 16Climate and Physical Risks
Idaho faces a range of climate and physical risks that affect real estate, including wildfire, drought, flooding along rivers, and in some cases seismic risk. The National Centers for Environmental Information Climate at a Glance statewide time series tool can, in principle, provide numerical trends in temperature and precipitation for Idaho, but in this environment the interface only presents selection fields for state, parameter, and time period and does not expose numeric series for extraction. Consequently, this review cannot present specific changes in average temperature or total precipitation for Idaho over time.
Qualitatively, Idaho’s climate risk profile includes increasing wildfire risk in forested and wildland urban interface areas. The Idaho Department of Insurance’s highlighting of a wildfire risk forum and a burn demonstration conducted by the Insurance Institute for Business and Home Safety illustrates the degree of concern over wildfire behavior and the importance of defensible space and fire ready construction. Properties near forests, canyons, and certain rural communities may face heightened exposure to wildfire, which in turn affects insurance availability and premiums.
Riverine flooding is another localized risk, particularly along major rivers such as the Snake and Boise Rivers. The Federal Emergency Management Agency’s flood mapping resources define high risk flood zones as areas with at least a one percent annual chance of flooding, corresponding to at least a one in four chance over a thirty year mortgage term. While this review does not retrieve parcel specific flood maps for Idaho, investors should assume that some communities near rivers and reservoirs are in mapped flood zones and should verify flood designations as part of due diligence.
Extreme weather events, including heavy snowfall, cold snaps, and occasional heat waves, can also affect building performance and operating costs. Without numeric climate projections here, investors must rely on external climate risk analytics and engineering assessments to evaluate site specific exposure and resilience needs.
Section 17Opportunities
Idaho presents several clear opportunity themes for real estate investors. Strong population growth, as evidenced by World Population Review’s increase from 1,849,328 residents in 2020 to 2,058,594 residents in 2026, combined with the Federal Reserve population series that shows state population rising from 1,849.328 thousand to 2,029.733 thousand over 2020 to 2025, underpins sustained demand for housing and services. This growth is concentrated in Ada, Canyon, and Kootenai counties, where reported growth rates since 2020 range from 7.6 percent to 16.4 percent, offering a large and expanding renter and homeowner base.
Income growth is another opportunity driver. Per capita personal income in Idaho increased from 49,726 dollars in 2020 to 64,846 dollars in 2025 according to the Federal Reserve, and median household income sits at 74,636 dollars in the World Population Review profile. Rising incomes improve tenants’ ability to pay and can support higher quality and higher rent housing products, particularly in metro areas with growing white collar employment.
The house price index and Redfin data also suggest opportunities for both capital appreciation and income strategies. The house price index increased from 511.41 in the first quarter of 2020 to 873.60 in the first quarter of 2026, while the median sale price reached 490,757 dollars in May 2026 with continued, albeit slower, year over year growth. Investors who can identify submarkets where prices and rents have room to grow relative to local incomes and supply pipelines may find opportunities, though past appreciation is not indicative of future results and no particular return is assured.
In the single family segment, investor interest in single family rentals can be supported by the combination of high ownership costs and population growth. In multifamily, continued in migration and limited public evidence of overbuilding, given that statewide permitting volumes, while substantial, are not extreme relative to population growth, suggest room for well located apartment projects. Finally, select commercial and industrial assets tied to growth in trade, transportation, education, health services, and manufacturing may benefit from ongoing sector expansion. The observations in this section are general and educational, are not projections, forecasts, or assurances of any particular return, yield, occupancy, rent level, or appreciation, and any specific investment must be evaluated on its own facts.
Section 18Risks
The same dynamics that create opportunity in Idaho also generate material risks. Rapid population and house price growth have strained housing affordability. With median sale prices near 491 thousand dollars and per capita personal incomes around 64,846 dollars in 2025, many households face challenges in purchasing homes, which can lead to political and regulatory responses that affect development and investment. While Idaho currently lacks broad rent control, localized measures or zoning changes could emerge in response to affordability concerns.
Construction and cyclicality risks are evident in the building permit data. The statewide permit series shows that monthly permits can swing widely, with June readings ranging from about 1,400 units to more than 2,100 units, and while this pipeline looks manageable at the statewide level, concentrated bursts of construction in specific submarkets could create localized oversupply, particularly if demand softens or interest rates remain elevated.
Data limitations are themselves a risk. The absence of public statewide statistics on rents, vacancy, and capitalization rates means that investors who rely only on free public data will have an incomplete picture of Idaho’s real estate markets. Underwriting errors can occur if assumptions about rent growth, lease up timing, or exit yields are not grounded in robust local data.
Climate and insurance risks are also significant. Increased wildfire activity and changing precipitation patterns may lead to higher insurance premiums, coverage limitations, or physical damage to properties in vulnerable areas. The wildfire risk forum content highlighted by the Idaho Department of Insurance underlines that insurers and regulators are focused on these issues, and investors ignoring climate resilience may face unexpected costs or loss of insurability.
Finally, while Idaho’s economy is growing, the statewide twelve month nonfarm employment growth of 0.8 percent as of June 2026 is relatively modest. A downturn in key sectors or a broader recession could quickly erode demand and expose overleveraged or marginal assets. Real estate investments are speculative, are subject to market, financing, liquidity, tax, insurance, and physical hazard risks, and can result in the loss of some or all of an investor's invested capital, including the possible loss of principal.
Section 19Investor Implications
For United States accredited investors, Idaho offers exposure to a growing, relatively business friendly state with strong demographic tailwinds. Population growth, rising incomes, and significant house price appreciation create a foundation for both income and appreciation strategies in residential real estate, particularly in Boise and other fast growing metros. However, the tightness of the housing market, as reflected in a median sale price of 490,757 dollars, shrinking inventory, and a notable share of homes selling above list price, also raises the bar for successful acquisition pricing and asset selection.
In multifamily and single family rentals, the lack of public rent and vacancy series underscores the need for private data and local partnerships. Investors should view statewide indicators such as the Federal Reserve population, income, house price, and building permit series as macro signposts and then conduct detailed neighborhood and asset level analysis using rent rolls, leases, and proprietary data. Conservative underwriting assumptions on rent growth and exit cap rates are prudent given the significant run up in prices since 2020.
Commercial and industrial investments require similar care. Without public vacancy or rent data, investors must lean on brokers, appraisers, and managers who specialize in Idaho markets, and must evaluate tenant credit quality, lease structures, and building resilience in light of climate and insurance trends.
Finally, investors should recognize that while Idaho’s regulatory environment is generally supportive of landlords and developers compared with many coastal states, it is not static. Affordability concerns, infrastructure strain, and climate challenges may drive changes over the life of an investment. A clear eyed view of both current conditions and potential policy shifts, combined with disciplined capital structures, will be critical. Nothing in this section is a recommendation to pursue any specific strategy or investment, and there is no assurance that any objective or outcome described will be achieved.
Section 20Conclusion
Idaho has evolved from a relatively small, slow growing state to a notable growth market in the Mountain West. Public data from the Federal Reserve, the Bureau of Labor Statistics, and World Population Review show strong gains in population, rising per capita and household incomes, and substantial house price appreciation since 2020. Redfin’s housing market metrics confirm that prices remain elevated, inventory has contracted, and a meaningful share of transactions still clear above list price.
At the same time, important aspects of the real estate investment picture, including statewide rent levels, vacancy rates, and capitalization rates, are not captured in publicly accessible numeric series in this environment. That limitation, combined with emerging climate and insurance risks and a maturing economic expansion, means that Idaho is not a simple momentum trade but a market that calls for careful, data driven, and locally informed investment strategies.
For accredited investors willing to do the work to obtain detailed local data, partner with experienced operators, and structure deals conservatively, Idaho can offer opportunities across multifamily, single family rental, and selected commercial sectors, though no particular outcome or return is assured. This review provides a macro and policy frame; the ultimate outcomes will depend on disciplined execution in specific assets and submarkets.
Sources
- Federal Reserve Bank of St. Louis, Resident Population in Idaho, series IDPOP, thousands of persons, annual, not seasonally adjusted, reporting 1,752.074 in 2018, 1,789.060 in 2019, 1,849.328 in 2020, 1,904.855 in 2021, 1,942.951 in 2022, 1,970.497 in 2023, 2,000.872 in 2024, and 2,029.733 in 2025, accessed August 7, 2026,, https://fred.stlouisfed.org/series/IDPOP
- Federal Reserve Bank of St. Louis, Per Capita Personal Income in Idaho, series IDPCPI, dollars, annual, not seasonally adjusted, reporting 49,726 in 2020, 55,603 in 2021, 57,074 in 2022, 59,220 in 2023, 62,346 in 2024, and 64,846 in 2025, accessed August 7, 2026,, https://fred.stlouisfed.org/series/IDPCPI
- Federal Reserve Bank of St. Louis, All Transactions House Price Index for Idaho, series IDSTHPI, index where the first quarter of 1980 equals 100, quarterly, not seasonally adjusted, reporting 511.41 in the first quarter of 2020, 763.97 in the first quarter of 2022, 821.94 in the first quarter of 2024, and 873.60 in the first quarter of 2026, accessed August 7, 2026,, https://fred.stlouisfed.org/series/IDSTHPI
- Federal Reserve Bank of St. Louis, New Private Housing Units Authorized by Building Permits for Idaho, series IDBPPRIV, units, monthly, not seasonally adjusted, reporting statewide counts of 2,145 units in June 2022, 1,687 units in June 2023, 1,414 units in June 2024, 1,718 units in June 2025, and 1,660 units in June 2026, accessed August 7, 2026,, https://fred.stlouisfed.org/series/IDBPPRIV
- United States Bureau of Labor Statistics, Idaho Economy at a Glance, seasonally adjusted labor force data and nonfarm wage and salary employment by sector for January through June 2026, including a civilian labor force of 1,009.8 thousand in January and a preliminary 1,000.4 thousand in June, employment of 972.7 thousand in January and a preliminary 963.6 thousand in June, unemployment of 37.1 thousand in January and a preliminary 36.8 thousand in June, an unemployment rate of 3.7 percent in January, February, May, and June and 3.6 percent in March and April, total nonfarm employment of 878.7 thousand in January and a preliminary 886.5 thousand in June with a twelve month change of 0.8 percent, and June 2026 sector employment of 4.5 thousand in mining and logging, 76.4 thousand in construction, 77.2 thousand in manufacturing, 168.3 thousand in trade, transportation, and utilities, 8.7 thousand in information, 42.5 thousand in financial activities, 112.2 thousand in professional and business services, 146.1 thousand in education and health services, 91.7 thousand in leisure and hospitality, 30.5 thousand in other services, and 128.4 thousand in government, data extracted August 6, 2026,, https://www.bls.gov/eag/eag.id.htm
- World Population Review, Idaho Population 2026, state profile reporting a total population of 2,058,594 residents in 2026, a population density of 25 residents per square mile, a population rank of 37, population by year of 1,849,328 in 2020, 1,904,855 in 2021, 1,942,951 in 2022, 1,970,497 in 2023, 2,000,872 in 2024, 2,029,733 in 2025, and 2,058,594 in 2026, an increase of 28,861 people and 1.42 percent between 2025 and 2026, a racial composition including 83.35 percent White with 1,578,023 people, 8.42 percent two or more races, and 4.87 percent other race, income and poverty statistics including an average per capita income of 45,294 dollars, a median household income of 74,636 dollars, and a poverty rate of 10.64 percent, and county notes indicating that Ada County has 536,000 residents and 7.6 percent growth since 2020, Canyon County has grown 16.4 percent, Kootenai County has grown 9.1 percent, Custer County has about 2 residents per square mile, and Clark County has 783 residents and a 1.1 percent decline, accessed August 7, 2026,, https://worldpopulationreview.com/states/idaho
- Redfin, Idaho Housing Market, state level page reporting that in May 2026 the median sale price for all home types in Idaho was 490,757 dollars, up 2.9 percent year over year, that there were 10,806 homes for sale, down 12.4 percent year over year, and that 14.5 percent of homes sold above list price, up 3.2 percentage points year over year, along with metro level sales price growth rankings, accessed August 7, 2026,, https://www.redfin.com/state/Idaho/housing-market
- United States Department of Housing and Urban Development, Fair Market Rents by State, County, and Metropolitan Area, portal describing Fair Market Rent history and methodology and providing Excel and comma separated value files for fiscal years 2024 through 2026, including county level data and small area Fair Market Rents, used qualitatively because the Idaho specific rent amounts are contained in large files that are not parseable here, accessed August 7, 2026,, https://www.huduser.gov/portal/datasets/fmr.html
- Idaho State Tax Commission, official website noting that 2026 income tax withholding tables have been updated and that the state child tax credit has sunset, used qualitatively to note changes in state tax policy without quoting rate tables, accessed August 7, 2026,, https://tax.idaho.gov
- Idaho Department of Insurance, official website describing department activities and highlighting a wildfire risk forum burn demonstration conducted with the Insurance Institute for Business and Home Safety, used qualitatively to illustrate the prominence of wildfire risk in Idaho’s insurance discussions, accessed August 7, 2026,, https://doi.idaho.gov
- Federal Emergency Management Agency, Flood Maps, overview explaining that areas with at least a one percent annual chance of flooding are considered high risk with at least a one in four chance of flooding during a thirty year mortgage and that the Flood Map Service Center is the official source for flood hazard mapping products, used qualitatively to frame flood risk considerations for Idaho real estate, accessed August 7, 2026,, https://www.fema.gov/flood-maps
- National Oceanic and Atmospheric Administration, National Centers for Environmental Information, Climate at a Glance Statewide Time Series, web tool that in this environment shows selection fields without exposing numeric Idaho climate series for extraction, documented to explain the absence of quantitative statewide temperature and precipitation trends, accessed August 7, 2026,, https://www.ncei.noaa.gov/access/monitoring/climate-at-a-glance/statewide/time-series