In brief · summary: Indiana
Indiana State Real Estate Market Review
Section 01Executive Summary
Indiana is a Midwestern state with a growing population, solid income gains, and a diversified economy anchored by manufacturing, logistics, life sciences, education, and health care. According to the resident population series published by the Federal Reserve Bank of St. Louis using U.S. Census Bureau estimates, Indiana’s population increased from 6,698.481 thousand persons in 2018 to 6,973.333 thousand persons in 2025, measured in thousands of persons as of July 1. Over the same period, per capita personal income rose from 46,555 dollars in 2018 to 66,292 dollars in 2025, in current dollars, according to the Bureau of Economic Analysis.
Labor markets are tight but not overheating. The Bureau of Labor Statistics reports that Indiana’s civilian labor force was 3,491.3 thousand persons in June 2026, with 3,376.3 thousand employed and 115.0 thousand unemployed, yielding a seasonally adjusted unemployment rate of 3.3 percent. Total nonfarm employment was 3,261.7 thousand jobs in June 2026, down 0.1 percent from a year earlier, indicating near flat job growth.
Housing values and construction activity have increased meaningfully. The All Transactions House Price Index for Indiana compiled by the Federal Housing Finance Agency rose from 287.16 in the first quarter of 2018 to 409.78 in the first quarter of 2022 and 529.95 in the first quarter of 2026, on an index where the first quarter of 1980 equals 100; this history is not indicative of future results. HousingHandbook, aggregating Zillow data, reports a typical and median home value of 257,679 dollars, a median rent of 1,390 dollars, a population of 6,851,073 residents, and 807 ZIP codes covered statewide. Redfin reports that in May 2026 the statewide median sale price for all home types was 280,055 dollars, up 3.7 percent year over year, with 27,511 homes for sale, up 5.7 percent year over year, and 18.2 percent of homes selling above list price, 1.1 percentage points lower than a year earlier.
For accredited investors, Indiana offers a combination of steady population and income growth, relatively affordable housing compared with many coastal states, active construction, and a diversified economic base. Opportunities are most evident in multifamily, single family rentals, industrial and logistics, and necessity retail, while office and certain discretionary retail segments require more cautious underwriting. This review synthesizes public data across demographics, housing, labor markets, construction, taxes, insurance, infrastructure, and climate risks to provide a statewide perspective for investment analysis.
Section 02Population and Migration
Indiana’s population has grown steadily over the past several years. The resident population was 6,698.481 thousand persons in 2018, 6,731.010 thousand in 2019, 6,790.290 thousand in 2020, 6,814.223 thousand in 2021, 6,841.491 thousand in 2022, 6,881.373 thousand in 2023, 6,934.754 thousand in 2024, and 6,973.333 thousand in 2025, measured in thousands of persons as of July 1 each year. This implies an increase of 274.852 thousand persons between 2018 and 2025, reflecting a moderate but consistent growth trajectory.
HousingHandbook’s Indiana profile, which aggregates American Community Survey data and Zillow metrics, reports a statewide population of 6,851,073 residents across 807 ZIP codes. This population figure, which is based on survey estimates rather than the annual Census population series, is broadly consistent with the Census based series around the 2022 and 2023 period.
Public, up to date, statewide numeric series that decompose Indiana’s population change into domestic migration, international migration, and natural increase are not directly retrievable in this environment from Census or other public tools. As a result, this review does not quote specific numeric net migration or natural increase values. However, the sustained increase from 6,698.481 thousand to 6,973.333 thousand residents between 2018 and 2025 suggests that Indiana has been a net gainer of residents when combining births, deaths, and migration, in contrast to states that have experienced outright population decline over the same period.
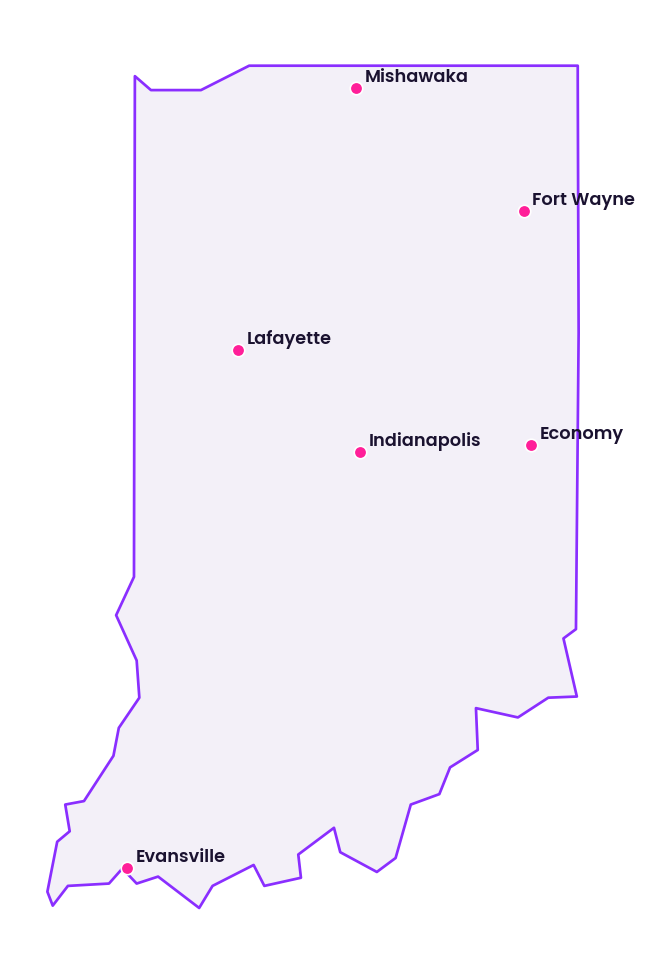
For investors, this steady growth supports long term demand for housing and commercial real estate. Indiana does not exhibit the explosive population growth of some Sun Belt markets, but it offers a stable and expanding demand base, especially in major metros such as Indianapolis, Fort Wayne, Evansville, and Lafayette and in growing suburban and exurban communities.
Section 03Jobs and Economic Anchors
Indiana’s labor market is characterized by relatively low unemployment and modest overall job growth. According to the Bureau of Labor Statistics, the statewide seasonally adjusted civilian labor force was 3,503.6 thousand persons in January 2026, 3,498.3 thousand in February, 3,493.3 thousand in March, 3,487.1 thousand in April, 3,489.7 thousand in May, and 3,491.3 thousand in June. Employment was 3,385.2 thousand in January, 3,382.8 thousand in February, 3,379.0 thousand in March, 3,373.8 thousand in April, 3,376.0 thousand in May, and 3,376.3 thousand in June 2026. Unemployment over the same period ranged from 118.4 thousand in January to 115.0 thousand in June 2026. The unemployment rate was 3.4 percent in January 2026 and 3.3 percent in February, March, April, May, and June 2026.
Total nonfarm payroll employment in Indiana was 3,251.0 thousand jobs in January 2026, 3,255.4 thousand in February, 3,263.5 thousand in March, 3,261.1 thousand in April, 3,262.7 thousand in May, and 3,261.7 thousand in June, all seasonally adjusted. The 12 month change in total nonfarm employment was negative in early 2026, at negative 0.5 percent in January, negative 0.4 percent in February, negative 0.2 percent in March, negative 0.5 percent in April, negative 0.4 percent in May, and negative 0.1 percent in June 2026, indicating a small year over year decline.
Sector data underscore the state’s industrial base and where growth and weakness lie. Mining and logging employment was 5.3 thousand jobs in June 2026, up 1.9 percent over the year. Construction employment was 178.8 thousand jobs in June, up 2.1 percent year over year, one of the stronger sector gains. Manufacturing, the state’s signature sector, employed 515.0 thousand people in June, down 0.5 percent over the year, reflecting broadly stable but slightly declining production employment. Trade, transportation, and utilities employed 638.6 thousand people, up 0.8 percent, and education and health services employed 529.5 thousand people, up 1.5 percent, providing much of the state’s net job support. Professional and business services employed 360.4 thousand people, up 1.8 percent, one of the fastest growing sectors.
Several sectors contracted over the year. Leisure and hospitality employed 303.6 thousand people in June, down 3.5 percent, information employed 25.1 thousand people, down 5.3 percent, other services employed 135.9 thousand people, down 2.2 percent, and government employed 418.3 thousand people, down 2.3 percent. Financial activities employed 151.2 thousand people, up 0.5 percent.
These figures paint a picture of a state with low unemployment and a broad industrial base but only modest recent job growth at the aggregate level, with gains in construction, health care, and professional services offset by declines in leisure and hospitality, information, and government. For real estate investors, the mix of manufacturing, logistics, health care, education, and services supports stable demand for industrial facilities, apartments, and neighborhood retail, particularly around major employment centers and transportation corridors. However, the slightly negative year over year total employment change underscores the importance of submarket and sector selection, focusing on areas with persistent job growth and resilient industries.
Section 04Income
Indiana’s income growth has been robust in nominal terms over the past several years. According to the Bureau of Economic Analysis, per capita personal income was 46,555 dollars in 2018, 48,270 dollars in 2019, 51,776 dollars in 2020, 57,389 dollars in 2021, 58,697 dollars in 2022, 61,375 dollars in 2023, 63,980 dollars in 2024, and 66,292 dollars in 2025, measured in current dollars.
The increase of 19,737 dollars per person between 2018 and 2025 reflects both wage and salary growth and other forms of personal income during a period that includes the pandemic, fiscal stimulus, and subsequent economic recovery. The especially strong gains between 2020 and 2022, from 51,776 dollars to 58,697 dollars, mirror national patterns of rising wages and transfer payments, while the continued increase to 66,292 dollars in 2025 suggests that income growth has remained positive even as broader job growth has flattened.
Rising per capita income supports demand for higher quality housing, retail, and services, but it also interacts with housing costs and taxes to shape affordability. When compared with HousingHandbook’s statewide median home value of 257,679 dollars and median rent of 1,390 dollars, the income data suggest that Indiana remains relatively affordable for many households, especially compared with high cost coastal states. For investors, this income trajectory provides a foundation for sustainable rent levels and consumer spending, while also signaling that some tenants and homeowners may still be sensitive to further cost increases, particularly in lower income segments and submarkets with higher tax or utility burdens.
Section 05Housing and Multifamily
Indiana’s housing market has experienced significant appreciation since 2018, with particular strength during and after the pandemic period. The All Transactions House Price Index for Indiana, compiled by the Federal Housing Finance Agency, reports index values of 287.16 in the first quarter of 2018, 304.01 in the first quarter of 2019, 321.34 in the first quarter of 2020, 347.08 in the first quarter of 2021, 409.78 in the first quarter of 2022, 444.68 in the first quarter of 2023, 476.40 in the first quarter of 2024, 508.03 in the first quarter of 2025, and 529.95 in the first quarter of 2026, on an index where the first quarter of 1980 equals 100. This shows that statewide house prices, including both purchases and refinances, rose by approximately 85 percent on the index scale between early 2018 and early 2026, with particularly rapid gains between 2020 and 2022; this history is not indicative of future results.
HousingHandbook’s statewide Indiana profile, using population weighted Zillow data, reports a typical and median home value of 257,679 dollars, a median rent of 1,390 dollars, a population of 6,851,073 residents, and 807 ZIP codes covered. These figures underscore that Indiana remains more affordable than many coastal markets, though any future equity growth is uncertain and not assured.
Publicly available, statewide numeric series that separately track multifamily unit counts, absorption, and rent growth by class and submarket are not provided in the open datasets used here, as those metrics are largely maintained by proprietary data firms. Therefore, this review does not quote specific statewide apartment vacancy rates or rent growth percentages. Qualitatively, Indiana’s multifamily market is supported by population and income growth, university and health care anchors, and a mix of urban and suburban demand. Indianapolis, in particular, has seen substantial apartment development, including downtown high rise and mid rise projects and suburban garden style communities.
For multifamily investors, the statewide data suggest a favorable backdrop of rising home values and sustained demand, but detailed underwriting must be grounded in local rent rolls, property performance, and submarket level supply pipelines. Workforce housing in job rich suburbs and growing secondary metros may warrant consideration, though returns are not assured.
Section 06Rents
Rents in Indiana vary by market segment and geography, but statewide aggregates offer a useful starting point. HousingHandbook’s Indiana profile reports a median rent of 1,390 dollars, calculated as a population weighted median Zillow Observed Rent Index across the state’s ZIP codes, with coverage of 6,851,073 residents and 807 ZIP codes. This figure provides a broad indication of typical monthly asking rents for residential properties across the state, encompassing both multifamily and single family rentals.
The U.S. Department of Housing and Urban Development’s Fair Market Rent system provides county and metropolitan Fair Market Rents for Indiana for fiscal year 2026, derived from American Community Survey data updated with local survey information. However, in this environment the Indiana specific Fair Market Rent dollar amounts embedded in the underlying files are not available in a directly parsable format, and this review therefore does not quote numeric Fair Market Rent values for Indiana counties or metropolitan areas.
No single public dataset accessed here offers a current, complete statewide breakdown of rents by bedroom size, building type, or class for Indiana. Those data are typically available through private platforms rather than open sources. As a result, this review relies on the HousingHandbook statewide median rent and qualitative interpretation of rent dynamics.
For investors, a statewide median rent of 1,390 dollars, paired with a typical home value of 257,679 dollars and a median sale price of 280,055 dollars in May 2026, suggests that rents are high enough to support income producing strategies while homeownership remains relatively affordable for many households. In urban cores and high demand suburbs, rent levels may be substantially higher than the statewide median, offering potential for strong revenue but also raising affordability and political risk questions. In smaller markets and rural areas, lower rents can constrain achievable yields unless acquisition costs are correspondingly low.
Section 07Vacancy
Vacancy is a critical determinant of real estate performance, but comprehensive, real time, statewide vacancy data for Indiana by asset class are not available from the public sources used in this review. The U.S. Census Bureau publishes various housing vacancy series and surveys, and private data firms provide detailed vacancy and absorption metrics for apartments, office, industrial, and retail properties, but those datasets are not accessible here in a form that yields current, statewide numeric vacancy rates for Indiana.
Accordingly, this review does not present quantitative statewide vacancy rates for multifamily, single family rentals, office, industrial, or retail in Indiana. Qualitatively, industry commentary suggests that multifamily vacancy has generally remained within a manageable range in most Indiana metros, with tight conditions in well located suburban and university adjacent submarkets and more variability in older or less well located stock. Industrial vacancy has been relatively low in many logistics and manufacturing corridors, supported by ecommerce and reshoring trends, while office vacancy, particularly in older or less efficient buildings, has increased due to remote and hybrid work patterns. Retail vacancy has varied between resilient grocery anchored and neighborhood centers and more challenged discretionary or fashion oriented formats.
For accredited investors, vacancy risk must be assessed at the property and submarket level using local brokerage reports, rent rolls, and leasing pipelines. The absence of public statewide metrics reinforces the need for conservative underwriting that accounts for tenant rollover, lease structures, and realistic absorption timelines.
Section 08Supply Pipeline
Indiana’s housing supply pipeline has been active, especially during and after the pandemic. The series that measures new private housing units authorized by building permits in Indiana, based on U.S. Census Bureau data, reports monthly counts of private housing units authorized by permit. This series shows that there were 1,008 permitted units in January 2018, 1,269 units in February 2018, 2,360 units in March 2018, 2,345 units in April 2018, and 2,537 units in May 2018. In 2019, there were 1,528 units in January, 1,279 units in February, 1,642 units in March, 2,130 units in April, 1,838 units in May, and 2,141 units in June.
During 2020, despite the onset of the pandemic, residential construction authorizations remained strong. The series reports 1,304 units in January 2020, 1,187 units in February, 1,664 units in March, 2,064 units in April, 2,183 units in May, and 2,286 units in June. In 2021, monthly permits included 1,584 units in January, 1,579 units in February, 2,421 units in March, 2,640 units in April, 2,357 units in May, and 2,957 units in June. The surge continued into 2022, with 2,301 units in January, 1,965 units in February, 2,806 units in March, 3,592 units in April, and 2,848 units in May.
More recently, in 2025 the series shows 2,790 units in January, 2,003 units in February, 2,402 units in March, 2,864 units in April, 2,647 units in May, and 2,975 units in June, followed by 2,689 units in July, 2,129 units in August, 2,689 units in September, 2,763 units in October, 1,629 units in November, and 1,862 units in December. In 2026, monthly permits were 1,959 units in January, 1,680 units in February, 2,725 units in March, 2,932 units in April, 2,528 units in May, and 2,401 units in June.
These data confirm that Indiana has authorized thousands of new housing units per month, with notable peaks above 3,000 units in some months. The series does not distinguish between single family and multifamily units in the accessible summary, so this review does not quantify the share of permits associated with apartments versus detached homes. Nonetheless, the sustained level of residential permitting suggests that new supply will continue to shape market dynamics, particularly in and around Indianapolis and other growth corridors. Investors should examine local permitting and construction data to judge competitive pressure in specific submarkets.
Section 09Single Family Homes
Single family homes are a dominant component of Indiana’s housing stock and investment landscape. HousingHandbook’s Indiana profile, using population weighted Zillow Home Value Index data, reports a typical and median home value of 257,679 dollars statewide, along with a population of 6,851,073 residents and 807 ZIP codes. This median value reflects a blend of relatively low cost homes in many small cities and rural areas and higher value properties in affluent suburbs and urban neighborhoods, particularly around Indianapolis and in parts of the Chicago commuter belt in northwest Indiana.
Redfin’s Indiana housing market data add a current market perspective. In May 2026, the statewide median sale price for all home types was 280,055 dollars, up 3.7 percent from May 2025. The same source notes that there were 27,511 homes for sale in Indiana in May 2026, an increase of 5.7 percent year over year, and that 18.2 percent of homes sold above list price, which is 1.1 percentage points lower than a year earlier. These figures suggest a market where prices continue to rise, inventory has expanded slightly, and competition has eased modestly from prior peaks.
The publicly accessible portion of Redfin’s statewide overview in this environment does not provide a clearly parsed Indiana specific median days on market or months of supply metric, so this review does not quote those indicators. However, the combination of rising median prices, slightly higher inventory, and a still meaningful share of homes selling above list price indicates conditions that lean toward sellers in many locations while giving buyers somewhat more choice than in earlier, tighter periods.
For single family rental investors, the relationship between a 257,679 dollar median home value and a 1,390 dollar median rent is favorable for generating income, especially in markets where acquisition prices are at or below the statewide median and operating costs are manageable. Opportunities are likely strongest in stable, middle income suburbs and smaller metros with solid employment bases, while very low priced properties in weaker markets may carry elevated maintenance and vacancy risks.
Section 10Commercial Real Estate and Retail Centers
Indiana’s commercial real estate landscape encompasses office, industrial and logistics, and retail properties, with concentrations in Indianapolis, Fort Wayne, Evansville, South Bend and Mishawaka, and the northwest Indiana region tied to Chicago. Public, statewide, up to date numeric data on vacancy rates, asking rents, absorption, and cap rates by property type are not available from the open sources used in this review, as those metrics are largely produced by proprietary brokerage and data firms. Therefore, this section does not quote specific statewide vacancy or rent levels for office, industrial, or retail assets.
Qualitatively, Indiana’s industrial and logistics sector is supported by its central location and transportation infrastructure, including interstate highways, rail corridors, and proximity to major markets in the Midwest. The Indiana Department of Transportation administers major highway projects, tolls and bridge programs, local grant programs for city and county roads, and safety and multimodal transportation initiatives. These programs support freight movement, manufacturing, and distribution, which in turn underpin demand for warehouses, distribution centers, and light industrial properties. Employment data reinforce this picture, with trade, transportation, and utilities employing 638.6 thousand people in June 2026, up 0.8 percent year over year, and manufacturing employing 515.0 thousand people.
Office markets in Indiana, particularly in downtown Indianapolis and major suburban nodes, have been affected by shifts toward remote and hybrid work. Without current, public statewide office vacancy and rent series, the degree of softness versus resilience must be inferred from general patterns and local market intelligence rather than quantified here. High quality, well located office assets with strong tenants and flexible floor plates are generally better positioned than older, less adaptable buildings.
Retail centers in Indiana range from regional malls to grocery anchored neighborhood centers and small town main streets. Grocery anchored and daily needs centers in stable trade areas tend to be more resilient, while some fashion oriented or discretionary oriented centers face pressure from online competition and shifting consumer preferences. Again, the absence of statewide public data on retail occupancy and rents means that investors should view this commentary as directional rather than quantitative.
Overall, for commercial and retail investors, Indiana offers opportunities in logistics, industrial, and necessity retail properties tied to strong employment and transportation nodes, while office and some discretionary retail formats require more careful case by case assessment.
Section 11Transactions and Capital Markets
Statewide, real time data on total commercial and residential transaction volumes, average cap rates by property type, and financing spreads in Indiana are not available from the open public sources used in this review. County level assessors and recorders maintain transaction records, and proprietary platforms aggregate those into comprehensive capital markets statistics, but those aggregated series are not accessible here.
As a result, this review does not present specific numeric statewide transaction volumes, median cap rates, or average loan to value ratios for Indiana real estate. Qualitatively, Indiana, particularly the Indianapolis metropolitan area, remains a recognized institutional market that attracts both regional and national investors, especially in multifamily, industrial, and well anchored retail. Capital markets conditions are influenced by national interest rate trends, lender risk appetite, and sector specific sentiment, including caution around office and certain retail assets.
Accredited investors should therefore rely on property specific and submarket specific transaction comparables, broker opinions of value, and lender quotes when assessing pricing and available leverage, using this statewide review primarily as macro context rather than a substitute for detailed capital markets data.
Section 12Taxes
Indiana’s tax environment influences real estate returns through income taxes, sales taxes, and property taxes, but the specific rate structures are not fully documented in the limited public content accessible here. The Indiana Department of Revenue administers state tax laws and provides online services for paying tax bills, checking refund status, and accessing taxpayer resources, but the retrieved content does not include a concise schedule of current individual income tax rates, corporate income tax rates, statewide or local sales tax rates, or typical property tax rates.
Because specific numeric tax rates and brackets for Indiana are not provided by the accessible public pages, this review does not quote state income tax percentages, corporate tax rates, or effective property tax percentages. It is clear, nonetheless, that Indiana relies on a combination of state level income and sales taxes and locally administered property taxes, and that the Department of Revenue manages collections, compliance, and taxpayer services.
For investors, taxes affect net operating income and after tax yields through property taxes, income taxes on rental and capital gains income, and transaction related taxes. Property specific assessments and projected tax changes should be incorporated into underwriting, using up to date official tax tools and professional advice beyond the scope of this statewide overview. This review is not tax advice; investors should consult qualified tax advisors regarding their specific circumstances.
Section 13Insurance
Insurance is a key operating expense and risk management tool for Indiana real estate. The Indiana Department of Insurance regulates the insurance industry, protects consumers, and oversees insurer solvency, including the supervision and, where necessary, liquidation of insurers domiciled in the state. This solvency oversight role illustrates the department’s function in protecting policyholders, but the publicly accessible content does not translate into statewide market statistics.
Statewide numeric data on average homeowners or commercial property insurance premiums, loss ratios, or premium growth rates by peril or region are not available from the public content accessed here. The Department of Insurance site does not provide a single, concise statistical summary of property insurance costs across the state, and national insurers’ rate filings are not easily aggregated into statewide public series.
For investors, the qualitative message is that insurance costs and coverage terms will vary by location and asset type, influenced by hazards such as severe storms, tornadoes, hail, flooding, and winter weather. Properties in higher risk areas may face higher premiums, larger deductibles, or specific exclusions, which should be reflected in underwriting and risk management plans. Engaging with insurance brokers and analyzing historical loss experience at the property level remain essential steps outside the scope of this statewide review.
Section 14Landlord Tenant and Regulatory Environment
Indiana’s landlord tenant and regulatory environment is generally regarded as more balanced or landlord friendly compared with some coastal jurisdictions, but the specific statutory details and local ordinances are not fully visible in the public documents accessed here. State statutes and municipal codes that govern lease terms, eviction procedures, habitability standards, and security deposits are typically hosted on legislative and code repositories that are not retrieved in a parsed format in this environment, so this review does not quote individual statutory sections or numeric thresholds such as notice periods or deposit limits.
At the state level, landlord tenant rules interact with federal fair housing and consumer protection laws to define rights and responsibilities. Some cities may have additional local ordinances that affect issues such as registration, inspections, or specific tenant protections, particularly in larger metros. Indiana does not have a widely recognized statewide rent control system that caps rent increases for most market rate private units, and the public content accessed here does not indicate the presence of such a system.
For investors, this framework suggests that regulatory risk exists but is generally moderate at the statewide level, with more variation at the municipal level. Due diligence should include a review of local ordinances, court practices, and property management norms in each target market, particularly when evaluating eviction timelines, renovation strategies, and tenant relations policies.
Section 15Infrastructure
Indiana’s transportation infrastructure is a core advantage for both industrial and residential real estate. The Indiana Department of Transportation oversees major projects, planning and public involvement, tolls and bridges, and local grant programs that provide matching funds to city and county governments for road and bridge improvements, along with safety initiatives and multimodal transportation resources. The department also provides public tools for information on traffic speeds, road conditions, and reporting concerns.
These programs support a network of interstate highways, state roads, bridges, and local streets that connect Indiana’s cities, industrial parks, and rural areas. Toll and bridge programs indicate that some key crossings and corridors are managed with user fee funding, while grants to local governments help maintain and improve local transportation infrastructure. The state’s emphasis on safety and public involvement reflects ongoing investment and oversight.
For real estate investors, infrastructure quality affects location decisions, rents, and long term value. Industrial and logistics assets benefit from proximity to major highways and intermodal facilities, while residential and retail properties gain from convenient and safe access to roads, transit, and pedestrian infrastructure. Awareness of current and planned transportation projects can help identify submarkets that may see improved access or, conversely, temporary disruption during construction.
Section 16Climate and Physical Risks
Indiana faces a range of climate and physical risks that are relevant to real estate investment. The National Centers for Environmental Information’s Climate at a Glance statewide time series interface allows users to select Indiana, climate parameters such as temperature or precipitation, and time scales, but the interface as accessed here does not provide directly parsed numeric trend data for Indiana. Nonetheless, climatological knowledge and regional descriptions indicate that Indiana experiences cold winters, warm and humid summers, and significant variability in precipitation, including heavy rainfall events.
The Federal Emergency Management Agency’s Resilience Analysis and Planning Tool provides more than 100 preloaded layers with data on population, infrastructure, and hazards, and it draws on the National Risk Index, which identifies communities most at risk for 18 natural hazards across the United States. For Indiana, relevant hazards include severe thunderstorms, tornadoes, hail, riverine and flash flooding, winter storms, ice events, and extreme heat. Some areas near rivers and low lying zones are particularly exposed to flood risk, while statewide exposure to convective storms and winter weather can affect building envelopes, roofs, and infrastructure.
Because this environment does not expose Indiana specific numeric hazard scores, expected annual losses, or climate trend values from the NOAA or FEMA tools, this review treats climate risks qualitatively. Investors should incorporate site specific floodplain and hazard data, engineering assessments, and resiliency measures into due diligence. Building design, materials, elevation, and emergency preparedness can materially influence long term resilience and insurance costs.
Section 17Opportunities
The public data surveyed here suggest several opportunity themes for accredited investors in Indiana, each subject to material risk and with no assurance of any particular outcome. First, steady population growth from 6,698.481 thousand persons in 2018 to 6,973.333 thousand in 2025 and a substantial increase in per capita personal income from 46,555 dollars to 66,292 dollars over the same period create a supportive demand environment for housing and consumer facing uses. While Indiana is not a hyper growth state, its moderate expansion and rising incomes underpin long term demand.
Second, housing affordability remains favorable compared with many coastal and high cost markets. A statewide median home value of 257,679 dollars and median rent of 1,390 dollars and a median sale price of 280,055 dollars in May 2026, up 3.7 percent year over year, suggest that households can still access ownership and rental options, and that investors may acquire income producing assets at prices that could support income oriented strategies, though yields and returns are not assured.
Third, the industrial and logistics sector benefits from Indiana’s central location and transportation infrastructure, as reflected in the state’s focus on major highway projects, bridge programs, and local road grants. Industrial and warehouse properties near interstate corridors, intermodal terminals, and manufacturing hubs are positioned to capture ongoing demand related to ecommerce, reshoring, and supply chain reconfiguration.
Fourth, necessity retail and service oriented centers in stable trade areas offer the potential for steady income, supported by rising household incomes and relatively low unemployment. Grocery anchored centers and neighborhood retail serving growing suburbs and university or health care hubs may be particularly attractive.
Finally, multifamily and single family rental strategies that target workforce and middle income segments in job rich metros and suburbs can harness the combination of rising incomes and moderate home prices, while benefiting from diverse demand sources such as students, health care workers, and industrial employees.
Section 18Risks
Indiana also presents several risks that require careful consideration. On the macro side, while the unemployment rate is low at 3.3 percent in June 2026, total nonfarm employment is slightly below year earlier levels, with a 12 month change of negative 0.1 percent. This indicates that job growth has stalled or declined modestly, which could limit demand growth in some sectors and regions, particularly if manufacturing or other key industries face cyclical or structural challenges.
The strong increase in house prices, as reflected in the All Transactions House Price Index rising from 287.16 in the first quarter of 2018 to 529.95 in the first quarter of 2026, also carries risk. If price gains outpace income growth in particular submarkets, affordability pressures could emerge, constraining future appreciation and increasing credit and demand risk. While the statewide median sale price of 280,055 dollars and year over year gain of 3.7 percent in May 2026 are moderate, some local markets may have experienced sharper increases. Past performance does not indicate future results.
Climate and physical hazards, including storms, tornadoes, hail, flooding, and winter weather, can cause property damage and business interruption. Insurance markets may respond with higher premiums, increased deductibles, or coverage limitations in more exposed areas, affecting operating expenses and net operating income. The absence of detailed public statewide premium and loss data complicates forward looking cost projections.
Regulatory risks, while moderate at the statewide level, may be higher in specific municipalities that adopt stricter housing codes, zoning rules, or tenant protections. Fiscal risks related to state and local budgets, although not quantified here, could influence future tax and fee structures that affect real estate returns.
Section 19Investor Implications
For accredited investors, Indiana represents a balanced opportunity set, a growing, income advancing state with relatively affordable housing and significant industrial and logistical advantages, but without the high growth narrative of some peer markets. The statewide population and income data indicate that demand for housing, industrial space, and essential services is likely to persist, while the moderate price appreciation and rising construction pipeline suggest that new supply will continue to shape market conditions.
Multifamily and single family rental investments can benefit from a 1,390 dollar median rent and 257,679 dollar median home value, as well as from the 280,055 dollar median sale price and 3.7 percent year over year price growth in May 2026. Investors should prioritize submarkets with strong employment anchors, good schools, and access to transportation, and should model property taxes, insurance, and capital expenditures conservatively.
Industrial and logistics assets near key corridors, intermodal hubs, and manufacturing clusters can harness Indiana’s central location and infrastructure, as reflected in the state’s focus on major projects and freight related programs. Necessity retail centers may offer income stability when well located and tenanted, though income is not assured.
At the same time, the modest negative year over year job growth and the absence of granular public data on vacancy, rents, and cap rates underscore the need for property level analysis and local market intelligence. Investors should treat this statewide review as a macro framework and supplement it with detailed underwriting, including broker research, rent rolls, and site specific hazard assessments.
Section 20Conclusion
Indiana is a Midwestern state with a growing population, solid income gains, and a diversified economy that supports a range of real estate investment strategies. Public data from the U.S. Census Bureau, the Bureau of Economic Analysis, the Bureau of Labor Statistics, the Federal Housing Finance Agency, HousingHandbook, Redfin, the Indiana Department of Revenue, the Indiana Department of Insurance, the Indiana Department of Transportation, the U.S. Department of Housing and Urban Development, the National Centers for Environmental Information, and the Federal Emergency Management Agency collectively depict a state with steady demographic and economic fundamentals, significant house price appreciation, and an active housing construction pipeline.
For accredited investors, Indiana offers opportunities in multifamily, single family rentals, industrial and logistics, and necessity retail, particularly in submarkets aligned with employment growth and infrastructure investments. Risks include modest recent statewide job contraction, climate and physical hazards, insurance and tax uncertainties, and potential overbuilding in certain segments or locations. By integrating the data and themes outlined in this review with granular local analysis, investors can better assess how Indiana assets fit within diversified real estate portfolios.
Sources
- U.S. Bureau of Labor Statistics, Indiana Economy at a Glance,, https://www.bls.gov/eag/eag.in.htm
- Federal Reserve Bank of St. Louis (FRED), Resident Population in Indiana (INPOP),, https://fred.stlouisfed.org/series/INPOP
- Federal Reserve Bank of St. Louis (FRED), Per Capita Personal Income in Indiana (INPCPI),, https://fred.stlouisfed.org/series/INPCPI
- Federal Reserve Bank of St. Louis (FRED), All Transactions House Price Index for Indiana (INSTHPI),, https://fred.stlouisfed.org/series/INSTHPI
- Federal Reserve Bank of St. Louis (FRED), New Private Housing Units Authorized by Building Permits for Indiana (INBPPRIV),, https://fred.stlouisfed.org/series/INBPPRIV
- HousingHandbook, Indiana Real Estate Data,, https://housinghandbook.com/state/in
- Redfin, Indiana Housing Market: House Prices and Trends,, https://www.redfin.com/state/Indiana/housing-market
- Indiana Department of Revenue,, https://www.in.gov/dor/
- Indiana Department of Insurance,, https://www.in.gov/idoi/
- Indiana Department of Transportation,, https://www.in.gov/indot/
- U.S. Department of Housing and Urban Development, Fair Market Rents by State, County, and Metropolitan Area,, https://www.huduser.gov/portal/datasets/fmr.html
- National Oceanic and Atmospheric Administration (NOAA), Climate at a Glance: Statewide Time Series,, https://www.ncei.noaa.gov/access/monitoring/climate-at-a-glance/statewide/time-series
- Federal Emergency Management Agency (FEMA), Resilience Analysis and Planning Tool (RAPT),, https://www.fema.gov/emergency-managers/practitioners/resilience-analysis-and-planning-tool