In brief · summary: Nevada
Nevada State Real Estate Market Review
Section 01Executive Summary
Nevada remains one of the fastest growing and most cyclically exposed real estate markets in the United States. The state population rose from 2.70 million in 2010 to 3.10 million in 2020, an increase of about 15.0% according to the decennial census, and subsequent estimates place Nevada above 3.2 million residents in 2024. That growth has been concentrated in Clark County, home to Las Vegas and Henderson, and to a lesser extent in Washoe County around Reno and Sparks. At the same time, the Nevada labor market in June 2026 still carried a 5.1% unemployment rate, among the highest of any state, with a labor force of about 1.69 million and nonfarm employment of about 1.61 million, reflecting the sensitivity of a tourism and entertainment heavy economy to national and global cycles.
For real estate investors, the practical picture in 2026 is a market that has worked through the most acute phase of the post pandemic correction, but where value lies primarily in understanding local volatility and submarket differentiation rather than chasing statewide averages. Multifamily fundamentals in Las Vegas and Reno have cooled from their 2021 and 2022 peaks as a large construction wave delivered and rent growth moderated toward zero, but occupancy remains broadly healthy. Single family prices, which surged more than 40% over three years statewide, have flattened and in some segments declined modestly, while the single family rental niche has deepened. Office demand is bifurcated between back office and government anchored product that is holding, and commodity space facing structural headwinds. Industrial and logistics, especially around Reno’s distribution hub and the Las Vegas logistics corridor, remain bright spots. Nevada’s enduring advantages are clear: no personal income tax, relatively moderate property tax burdens constrained by constitutional limits on assessed value increases, and an established hospitality and gaming sector now augmented by data centers, logistics, and professional services. Counterbalancing those positives are drought and extreme heat risk, water constraints, exposure to national discretionary travel cycles, and an insurance market that is tightening for wildfire and severe storm perils in some parts of the state.
Section 02Population and Migration
Nevada’s long run story is population growth, and even with some moderation after 2020 it remains a growth state. The U.S. Census Bureau’s decennial counts show population rising from 2,700,551 in April 2010 to 3,104,614 in April 2020, a 15.0% increase that ranked Nevada among the ten fastest growing states in that decade. Post 2020 Population Estimates indicate that Nevada continued to gain residents, passing 3.2 million by 2024, though at a slower annual pace than in the 2000s, as both California out migration and domestic migration generally eased from their pandemic era peaks.
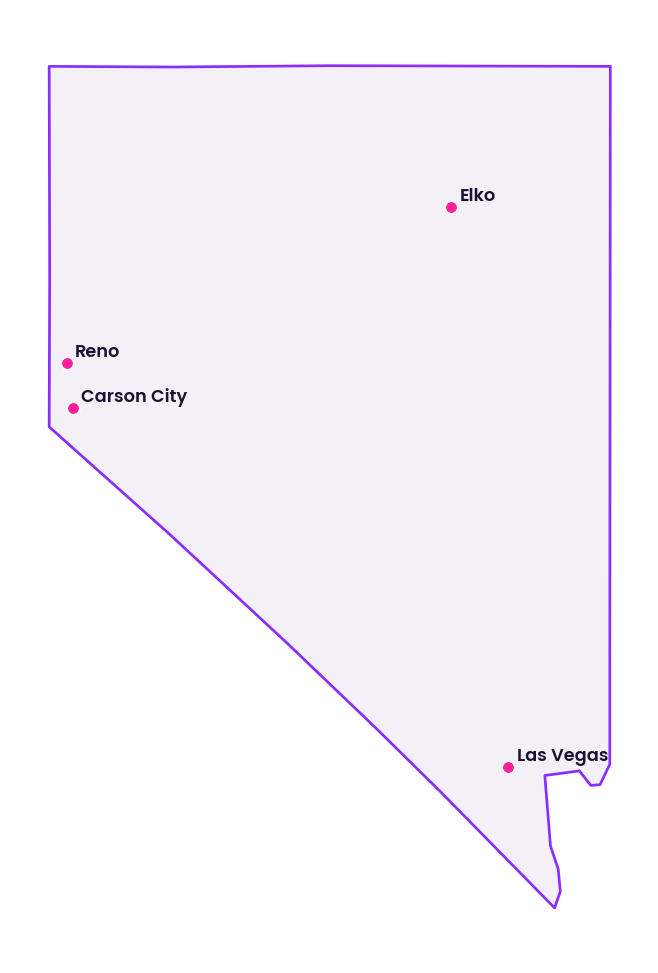
That growth is not uniform. Clark County accounts for roughly three quarters of state residents and most of the net growth, anchored by the Las Vegas Henderson Paradise metropolitan area. Washoe County, anchored by Reno and Sparks, contributes most of the remainder and has also grown above the national average. Rural Nevada counties, particularly those dependent on mining, have seen flat or declining populations over the decade. Migration patterns show continued inbound movement from California and some Midwestern states, including a mix of retirees, service workers, and professionals attracted by the tax structure, lower relative housing costs compared with coastal California, and job opportunities in hospitality, logistics, and data centers.
For an investor, the key implication is that statewide growth figures are in practice Las Vegas and Reno figures. Those two metropolitan areas drive almost all new household formation that translates into housing demand. Rural areas can offer yield in single asset situations but lack the scale and depth that institutional capital typically requires.
Section 03Jobs and Economic Anchors
Labor market data from the U.S. Bureau of Labor Statistics for June 2026 show Nevada with a civilian labor force of 1,686,800 people, of whom 1,600,300 were employed and 86,500 unemployed, giving an unemployment rate of 5.1% on a seasonally adjusted basis. That rate has trended down from about 5.3% in early 2026 but remains elevated relative to the national rate, consistent with a state economy where leisure and hospitality remain a large share of employment.
Total nonfarm wage and salary employment was about 1,614,100 in June 2026, up 2.3% over twelve months, indicating healthy job growth. The sector breakdown is instructive. Trade, transportation, and utilities employed about 296,900 people, with 12 month growth of about 1.4%. Construction employed about 114,800, up 2.8% year over year, and manufacturing about 68,400, up 0.6%. Professional and business services, at about 236,900 jobs, grew a robust 5.9% over the year, and education and health services, at about 188,800, grew 5.5%. Leisure and hospitality, still the state’s largest private sector with about 361,900 jobs, grew a modest 1.2% year over year after essentially flat performance earlier in the year.
| Sector | Employment (thousands) | 12 month change | Scope and period |
|---|---|---|---|
| Total nonfarm | 1,614.1 | +2.3% | Nevada, June 2026 |
| Leisure and hospitality | 361.9 | +1.2% | Nevada, June 2026 |
| Trade, transportation, utilities | 296.9 | +1.4% | Nevada, June 2026 |
| Professional and business services | 236.9 | +5.9% | Nevada, June 2026 |
| Education and health services | 188.8 | +5.5% | Nevada, June 2026 |
| Construction | 114.8 | +2.8% | Nevada, June 2026 |
Beyond hospitality, Nevada’s economic anchors now include major logistics and manufacturing operations, particularly in the Reno Sparks area where facilities for Tesla, Panasonic, and other advanced manufacturing and distribution firms in the Tahoe Reno Industrial Center and surrounding parks employ thousands. Data centers and warehousing have expanded around both Reno and Las Vegas, using Nevada’s land availability and tax environment. Las Vegas itself has seen diversification into professional services, sports and entertainment, with major league sports franchises and large scale events adding demand for office, retail, and hospitality real estate.
For real estate investors, this sector mix means that while Nevada remains more cyclical than the U.S. average due to leisure and hospitality, there is now a meaningful base of non tourism employment that supports both multifamily and single family demand in Las Vegas and Reno and underpins industrial and flex space demand statewide.
Section 04Income
Statewide income data from the Census Bureau’s American Community Survey 2020 through 2024 five year estimates show median household income in Nevada modestly below the national median. Median household income across the state was in the low to mid 70,000 dollar range in 2024 dollars, compared with a national median around 80,700 dollars, with Las Vegas slightly below and Reno slightly above the state median. Per capita income in Nevada was in the mid to high 40,000 dollar range, roughly similar to the national average, reflecting a mix of relatively high wages in gaming, hospitality leadership, logistics, and advanced manufacturing alongside lower wage service jobs.
Poverty rates in Nevada run modestly above the national figure, reflecting income inequality within the two major metros and persistent rural poverty. The statewide poverty rate on recent ACS data was in the low double digit range, compared with about 10.6% nationally. For an investor, these figures mean that Nevada offers a broad middle income renter and buyer base that can support market rate housing, but they also underscore the structural demand for workforce and affordable housing, especially in the Las Vegas Valley where rent to income ratios have stretched since 2019.
Section 05Housing and Multifamily
Nevada’s housing stock has grown rapidly, especially in Clark and Washoe Counties. Census housing unit estimates show total housing units statewide rising from about 1.17 million in 2010 to around 1.32 million by 2024, with the largest absolute gains in the Las Vegas Henderson Paradise and Reno Sparks metros. Owner occupancy statewide remained near the national average, while renter occupancy is higher in Las Vegas and lower in some rural counties.
The multifamily stock is concentrated in the Las Vegas Valley and in Reno Sparks. Public multifamily data from providers such as Yardi Matrix and RealPage indicate that Las Vegas had on the order of 200,000 to 220,000 institutional grade apartment units as of 2025, while Reno Sparks had on the order of 35,000 to 45,000, although exact numbers differ by source and are drawn from proprietary coverage universes rather than a state registry. Secondary and rural markets such as Carson City, Elko, and outlying counties contribute relatively little to the institutional multifamily inventory.
Statewide, the apartment market moved from undersupply and rapid rent growth in 2021 and 2022 to a more balanced condition by 2025 and 2026 as a large construction pipeline delivered in Las Vegas and Reno. Multifamily construction has been among the most active segments in Nevada building permits, with Las Vegas regularly appearing in national rankings for multifamily units under construction. For an investor, the implication is that Nevada multifamily is essentially a two market story, with Las Vegas and Reno as the primary institutional targets. Other areas may offer localized opportunities but lack the scale, liquidity, and data transparency of those metros.
Section 06Rents
Apartment rents in Nevada surged in the early 2020s and have since plateaued and, in some segments, declined modestly. State level rent indices from Apartment List show Nevada’s median rent across all unit sizes rising sharply during 2021 and 2022 and then flattening into 2024 and 2025, with year over year changes hovering around zero or slightly negative by mid decade. In mid 2026 the statewide median rent on that index was modestly above the national median, reflecting elevated pricing in Las Vegas and Reno relative to many interior markets.
Metro level data provide more detail. Las Vegas median rents across one and two bedroom units on public indices such as Zillow’s ZORI and Apartment List’s metro index were in the low 1,400 to low 1,500 dollar range in mid 2026, down slightly from their 2022 peaks but still significantly above 2019 pre pandemic levels. Reno median rents were higher, in the mid 1,600 to low 1,700 dollar range, reflecting a tighter supply and demand balance in a smaller metro with strong in migration. HUD Fair Market Rents for fiscal year 2026 placed the two bedroom FMR at around 1,554 dollars for the Las Vegas Henderson Paradise metro and around 1,699 dollars for the Reno Sparks metro, both notably above the national FMR of about 1,472 dollars for a two bedroom.
For investors, the statewide rent narrative is one of a market that has cooled from exceptional double digit annual growth to a more sustainable and, in the near term, flat to low single digit environment, with some giveback where supply is heaviest. That cooling, combined with underlying population and job growth, can create more stable conditions for underwriting than the volatility of 2021 and 2022, provided new construction is appropriately monitored.
Section 07Vacancy
Apartment vacancy data for Nevada come primarily from metro level surveys conducted by RealPage, CoStar, and Yardi Matrix, which are proprietary but often summarized in public commentary. Broadly, multifamily vacancy in Las Vegas and Reno rose from cycle lows near 3% in 2021 to the mid single digits by 2024 and 2025 as new supply delivered and absorption normalized. By 2025, public commentary placed Las Vegas apartment vacancy in the 5% to 6% range and Reno in a similar or slightly higher band, depending on property class and submarket. These figures remain within what many investors would consider a balanced market, particularly in the context of substantial rent gains over the prior three years.
Statewide rental vacancy from the Census Housing Vacancy Survey, which includes single family rentals and small properties as well as apartments, has typically been higher than apartment only measures and subject to sampling noise, but it also showed a gradual increase in vacancy from 2021 onward as new units of all types were added. For investors, the key is that vacancy has normalized from extremely tight conditions but has not yet entered the kind of oversupply territory seen in some Sun Belt markets, in part because Nevada’s construction volumes, while high, have been constrained by labor, materials, and financing conditions.
Section 08Supply Pipeline
Nevada’s housing construction pipeline is concentrated in Clark and Washoe Counties, with Las Vegas and Reno consistently ranking in national tallies of multifamily and single family building permits. Census Building Permits Survey data show Nevada issuing several tens of thousands of permits per year across all residential types in the early 2020s, with a notable peak in 2021 and 2022 as developers responded to surging demand and low interest rates. Multifamily permits accounted for a significant share, particularly in the Las Vegas metro.
By 2024 and 2025, permit volumes had begun to decline as interest rates rose and lenders grew more cautious, reducing future pipeline risk. At the same time, previously issued permits continued to work through construction, resulting in elevated deliveries through 2024 and into 2025. RealPage and Yardi Matrix commentary for Las Vegas and Reno describes thousands of apartment units under construction in each metro, with Las Vegas in particular carrying an elevated share of its stock in the pipeline relative to many peer markets. As a result, Nevada is in the later stages of a supply cycle in which completions remain elevated while starts slow, setting up a likely moderation in new deliveries by 2027 and 2028.
For an investor, the statewide takeaway is that this is a time to be cautious about near term supply risk in specific Las Vegas and Reno submarkets and more optimistic about medium term conditions once the current wave has been absorbed and construction volumes reset at lower levels.
Section 09Single Family Homes
Nevada’s single family home market experienced one of the sharper booms in the country from 2020 through 2022, with prices rising substantially faster than incomes. Zillow’s statewide Home Value Index, which tracks the typical home value, shows Nevada home values climbing by more than 40% between early 2020 and mid 2022 before flattening and, in some metros, declining slightly by 2023. By mid 2026, the statewide typical home value remained comfortably above 400,000 dollars, above the U.S. typical value, but annual growth had slowed to the low single digits and in some quarters turned slightly negative.
Clark County’s single family segment, dominated by Las Vegas and Henderson, followed this pattern closely, with median sale prices that peaked in the mid 400,000 dollar range before drifting slightly lower and then stabilizing. Washoe County, anchored by Reno and Sparks, saw even higher price levels, with median home prices above 500,000 dollars, driven by in migration from California and constrained land supply in a smaller valley. Inventory increased from the ultra tight conditions of 2021, and months of supply moved toward more balanced levels near three to four months by 2024 and 2025, shifting bargaining power modestly back toward buyers while remaining below the six month level commonly associated with a neutral market.
The single family rental angle is significant in Nevada. Institutional and large scale single family rental operators have a notable presence in the Las Vegas Valley and in Reno, owning thousands of homes and operating build to rent communities in suburban submarkets. Public rent indices show single family rents in Las Vegas and Reno running well above apartment rents on a per unit basis, often in the 1,900 to 2,400 dollar range for typical three bedroom houses as of mid 2026, with year over year rent growth that has moderated from double digits to low single digits. For investors, this means that Nevada remains attractive for single family rental strategies, particularly in the workforce and middle income segments, but that acquisition pricing must be calibrated carefully to slower expected price and rent appreciation.
Section 10Commercial Real Estate and Retail Centers
Commercial real estate performance in Nevada differs markedly by property type and metro, and statewide averages are less useful than metro or submarket level views.
In office, Las Vegas and Reno have significantly less high rise and central business district stock than coastal office markets, and their office sectors were historically driven by back office, professional services, and some government tenants rather than large concentrations of white collar headquarters. As of 2025 and 2026, public data from brokerage reports placed Las Vegas office vacancy in the high teens to low 20% range, elevated due to both post pandemic work pattern shifts and new deliveries, but not at the extreme levels seen in San Francisco or Chicago. Reno’s office vacancy was somewhat lower, in the low to mid teens, reflecting a smaller, more balanced inventory. Asking rents in both markets were in the mid to high 20 dollar per square foot range on a full service basis for quality space, with newer suburban and mixed use projects achieving higher rates.
Industrial and logistics is a relative strength. Reno Sparks, anchored by the Tahoe Reno Industrial Center and proximity to Interstate 80, functions as a major west coast distribution hub that can reach West Coast and Intermountain markets efficiently. Industrial vacancy in Reno on public surveys has typically been in the mid single digit range in recent years, with asking rents in the mid to high single digit dollars per square foot on a triple net basis and strong absorption driven by e commerce, manufacturing, and logistics tenants. Las Vegas industrial, benefiting from growth in regional distribution and last mile facilities, has also seen healthy occupancy and rent growth, albeit from a lower base. Nevada’s lack of a state corporate income tax and business friendly regulatory environment make it attractive for such uses.
Retail in Nevada is anchored by tourism oriented segments in Las Vegas and neighborhood and community centers elsewhere. Tourism driven retail on or near the Las Vegas Strip operates as a unique asset class tied closely to visitor volumes and gaming revenues, while neighborhood shopping centers across Las Vegas and Reno have seen stable occupancy and modest rent growth, particularly for grocery anchored and necessity retail. Public brokerage reports for Las Vegas have placed neighborhood center vacancy in the mid single digit range with asking rents in the low to mid 20 dollar per square foot range, and cap rates for quality grocery anchored centers in the mid to high 5% range in recent years.
For a statewide investor, the commercial message is that Nevada offers relative strength in industrial and neighborhood retail tied to local demand and logistics, potential value in select suburban and mixed use office with healthy tenants, and a specialized tourism and entertainment retail market in Las Vegas that requires careful, operator specific analysis.
Section 11Transactions and Capital Markets
There is no single, comprehensive free public dataset that reports statewide Nevada commercial real estate transaction volume by property type and year; those figures are typically available only through proprietary services such as MSCI Real Assets or CoStar. Public commentary and brokerage research, however, indicate that transaction volumes in Las Vegas and Reno followed national patterns, peaking in 2021 and 2022, declining sharply in 2023 as interest rates rose, and stabilizing at lower but improving levels in 2024 and 2025.
National cap rate surveys from firms such as CBRE and Marcus and Millichap, which include Las Vegas and sometimes Reno among their metro breakouts, indicate that multifamily cap rates in the Las Vegas metro have drifted upward from very low levels at the peak to meaningfully higher levels by 2024 and 2025. Retail and industrial cap rates have also moved higher, with industrial assets generally retaining firmer pricing than weaker retail and office properties. Office cap rates have expanded the most, reflecting investor caution. Because those surveys are proprietary and metro specific, this statewide review does not attempt to quote a single Nevada cap rate figure, but the direction is clear, with cap rates repricing higher across property types from their 2021 and 2022 lows, creating opportunities for buyers with longer term horizons and stable capital.
Section 12Taxes
Nevada’s tax structure is one of its main competitive advantages. The state levies no personal income tax and no corporate income tax in the conventional sense. Instead, it imposes a gross receipts style Commerce Tax on businesses with more than 4 million dollars in Nevada gross revenue per year, at rates that vary by industry and are generally below 1%. Sales and use taxes provide a significant portion of state and local revenue. The statewide sales tax rate is 4.6%, and local option and county rates bring combined sales tax in Clark and Washoe Counties into the 8% to 8.375% range, depending on the jurisdiction.
Property taxes in Nevada are limited by a combination of constitutional and statutory provisions. Assessed value is calculated at 35% of taxable value, and annual increases in taxable value for existing property are capped at 3% for owner occupied residential property and at the lesser of 8% or a formula tied to inflation and other factors for other property types, including commercial and multifamily. Effective property tax rates, measured as total tax paid divided by market value, are moderate by national standards, with statewide averages approximately in the 0.6% to 0.8% range. For investors, the assessed value cap provides some protection against rapid tax bill escalation, though new construction and acquisitions can reset taxable value at higher levels.
Section 13Insurance
The Nevada Division of Insurance regulates property and casualty insurance in the state, but it does not publish a single statewide average homeowners premium figure in an easily accessible public statistic. Independent analyses and national insurance surveys typically place Nevada’s average homeowners premium below those of high risk coastal states such as Florida, Louisiana, or Texas, but above some interior states, reflecting exposure to wildfire, severe thunderstorms, and, in some regions, flash flooding.
No official public information is available on a precise statewide average commercial property insurance premium for Nevada. For residential investors, the practical pattern has been a gradual upward drift in premiums over the early 2020s, especially for properties in wildfire prone wildland urban interface areas near Reno and in parts of northern and eastern Nevada, and for properties exposed to flash flooding in desert washes. Multifamily and commercial insurance costs depend heavily on building age, construction type, loss history, and location relative to these perils, and given the lack of a simple statewide average figure, investors should obtain asset specific insurance quotes early in underwriting and stress test for further increases.
Section 14Landlord Tenant and Regulatory Environment
Nevada’s landlord tenant framework is generally considered owner friendly relative to coastal states, though it has seen some changes in recent legislative sessions. Residential tenancies are governed by Chapter 118A of the Nevada Revised Statutes. Security deposits are capped at three months’ periodic rent under state law, and landlords must return deposits or provide an itemized statement of deductions within 30 days after the tenant vacates. There is no statewide rent control, and Nevada law does not authorize local rent regulation ordinances, so owners are free to set and adjust rents subject to lease terms and fair housing laws.
The eviction process in Nevada is relatively fast by national standards. For nonpayment of rent, landlords may issue a seven day pay or quit notice, and if the tenant does not pay or vacate, the landlord can file a summary eviction in Justice Court. Recent reforms, including emergency measures during the early pandemic period, temporarily slowed evictions, but those have largely expired. There have been legislative discussions around tenant protections, including grace periods and limits on late fees, but as of mid 2026, Nevada remains a state where the legal framework provides owners with considerable control over pricing and occupancy, an important factor in cash flow stability and risk assessment.
Section 15Infrastructure
Nevada’s infrastructure is anchored by interstate highways, airports, and freight rail rather than large seaports. Interstate 15 connects Las Vegas to Southern California and Salt Lake City, while Interstate 80 runs through northern Nevada, connecting Reno and Sparks to Sacramento and the San Francisco Bay Area to the west and Salt Lake City and the Intermountain West to the east. McCarran International Airport, now Harry Reid International Airport, in Las Vegas is one of the busiest airports in the country by passenger volume, serving tens of millions of travelers annually and underpinning the state’s tourism economy. Reno Tahoe International Airport provides critical regional connectivity for northern Nevada.
Freight rail lines operated by Union Pacific and BNSF traverse the state, particularly along the I 80 corridor, supporting Reno’s role as a logistics hub. Recent investments in data center infrastructure, renewable energy transmission, and water management projects add to the state’s infrastructure base. For real estate investors, this connectivity supports industrial and logistics properties around Reno Sparks and Las Vegas and enhances the long term viability of those markets as distribution and manufacturing nodes.
Section 16Climate and Physical Risks
Nevada’s primary climate and physical risks are related to extreme heat, drought, wildfire, and localized flash flooding. The state is the driest in the country on average, with much of its area classified as desert, and it has experienced prolonged drought conditions over much of the last two decades. Water supply for southern Nevada is heavily dependent on the Colorado River and Lake Mead, where reservoir levels declined substantially over the 2000 to 2023 period before modest recovery in 2024, raising long term concerns about water availability and potential restrictions. While Nevada has invested in water conservation and reuse, particularly in Las Vegas, water scarcity remains a macro level risk that can affect growth prospects and operating costs.
Wildfire risk is significant in portions of northern and eastern Nevada, particularly in grasslands and forests near the California border and in areas with significant wildland urban interface development. Recent years have seen large fires in the broader Great Basin region, and smoke from California and Oregon fires has affected air quality in Reno and other Nevada communities. Flash flooding can be severe in desert areas during intense convective storms, especially in urbanized washes in Las Vegas and in mountainous terrain statewide.
Earthquake risk is present but often underappreciated. The western part of Nevada lies within the Basin and Range Province and has experienced significant earthquakes historically, though building codes in Las Vegas and Reno have improved seismic resilience over time. For investors, these risks translate into location specific considerations, with water and drought concerns most acute for long term growth and potentially influencing regulatory or development constraints. Wildfire and flood risks directly affect insurance costs, financing terms, and physical resilience requirements, and seismic risk calls for attention to building codes and retrofitting for certain properties.
Section 17Opportunities
Nevada’s most compelling opportunities arise from its combination of growth, tax structure, and sector strengths. The no personal income tax environment and moderate property tax regime continue to attract both individuals and businesses, supporting long term population and job growth in Las Vegas and Reno. Industrial and logistics assets benefit from Nevada’s strategic location and business friendly policies, particularly around Reno in the Tahoe Reno Industrial Center and along the I 15 corridor in Las Vegas. Multifamily and single family rental assets can harness ongoing household formation and relatively high rents, especially in workforce and middle income segments where demand is deepest.
The post 2021 and 2022 correction in prices and rents has also created an opportunity for investors to enter or expand in Nevada at more reasonable valuations and cap rates than at the peak, while still benefiting from long run growth drivers. With construction starts slowing and pipelines likely to shrink in the coming years, investors who can underwrite through the current period of elevated deliveries in Las Vegas and Reno may position themselves ahead of a more favorable supply and demand balance later in the decade.
Section 18Risks
The primary risks in Nevada’s real estate markets are cyclical, structural, and environmental. Cyclically, the state remains heavily exposed to national and global economic conditions through its leisure and hospitality sector, and downturns that reduce discretionary travel and gaming spend can quickly translate into job losses and softening housing and commercial demand in Las Vegas. Structurally, the sharp run up in home prices and rents since 2020 has stretched affordability, particularly for lower and middle income households, which can cap further rent growth and heighten political scrutiny of housing costs. The construction pipeline in Las Vegas and Reno, while slowing, still poses near term supply risk in selected submarkets.
Environmentally, drought, water scarcity, extreme heat, wildfire, and flash flooding present long term challenges that could affect development patterns, operating costs, and insurance availability and pricing. Insurance premiums have been trending upward in many western states, including Nevada, for properties in higher risk zones. Finally, the absence of a state income tax is a competitive advantage but also a fiscal constraint, since Nevada relies heavily on gaming, sales, and other consumption related taxes, which can be volatile and may prompt future changes in tax policy if revenues fall short.
Section 19Investor Implications
For accredited investors, Nevada in 2026 is a state where careful submarket and asset selection is more important than ever. The broad strategy implications are clear. In multifamily and single family rentals, focus on Las Vegas and Reno submarkets with durable employment drivers, modest near term supply risk, and attainable rent levels, underwriting conservative rent growth and realistic operating expenses, including insurance and property taxes. In industrial and logistics, prioritize Reno Sparks and Las Vegas locations with strong transportation access and modern building specifications that can command stable tenancy and rent growth. In office, be selective, favoring newer, well located suburban and mixed use assets with strong tenant rosters rather than commodity space exposed to long term obsolescence.
Tax and regulatory conditions are favorable, with no state income tax, moderate property tax burdens, and an owner friendly landlord tenant framework, but environmental and insurance risks must be underwritten explicitly and rigorously. Investors should build asset specific insurance scenarios, incorporate potential water related costs and constraints into long horizon underwriting, and maintain higher contingency reserves than in less exposed markets. Nevada offers meaningful upside for those who can navigate its cycles and risks, and it penalizes investors who assume straight line growth without accounting for volatility.
Section 20Conclusion
Nevada’s statewide real estate landscape in 2026 is the product of long term population and job growth, a dramatic boom and correction in housing and rents, and a gradual diversification of its economy beyond gaming and tourism. The state has added residents and jobs at an above average pace, especially in Las Vegas and Reno, while also experiencing more pronounced cyclical swings than the nation as a whole. Multifamily and single family markets have moved from extreme tightness to more balanced conditions as construction surged and then began to slow. Industrial and logistics assets continue to benefit from Nevada’s strategic location and tax environment. Office and some retail segments face structural headwinds, but there are pockets of strength.
Against these opportunities stand real and growing risks, including economic cyclicality, affordability pressures, environmental and insurance exposure, and fiscal dependence on volatile revenue sources. The investable question is whether specific assets in specific Nevada submarkets, at current prices and underwriting assumptions, offer a risk adjusted return that compensates for those factors. The data and dynamics presented here suggest that they can, particularly in industrial and in well chosen multifamily and single family rental segments in Las Vegas and Reno, but only for investors willing to account explicitly for Nevada’s unique blend of growth and volatility.
Sources
- U.S. Census Bureau, Decennial Census 2010 and 2020, Nevada,, https://www.census.gov/quickfacts/fact/table/NV,US/PST045222
- U.S. Census Bureau, QuickFacts Nevada, population and housing,, https://www.census.gov/quickfacts/fact/table/NV,US/PST045224
- U.S. Bureau of Labor Statistics, Nevada Economy at a Glance,, https://www.bls.gov/eag/eag.nv.htm
- U.S. Bureau of Economic Analysis, Gross Domestic Product by State, Nevada,, https://apps.bea.gov/regional/bearfacts/action.cfm?geoType=3&fips=32
- U.S. Census Bureau, American Community Survey 2020 to 2024 5 year estimates, Nevada income and poverty,, https://data.census.gov/table/ACSST5Y2024.S1901?q=Nevada%20income
- U.S. Census Bureau, American Community Survey 2020 to 2024 5 year estimates, Nevada housing,, https://data.census.gov/table/ACSST5Y2024.DP04?q=Nevada%20housing
- HUD User, FY2026 Fair Market Rents, Las Vegas Henderson Paradise, NV MSA,, https://www.huduser.gov/portal/datasets/fmr.html#2026_data
- HUD User, FY2026 Fair Market Rents, Reno Sparks, NV MSA,, https://www.huduser.gov/portal/datasets/fmr.html#2026_data
- Zillow Research, Nevada Home Values (ZHVI),, https://www.zillow.com/home-values/10/nv/
- Apartment List, Nevada Rent Report,, https://www.apartmentlist.com/research/state/nevada
- RealPage Analytics, Las Vegas and Reno multifamily market commentary,, https://www.realpage.com/analytics/tag/las-vegas-apartments/
- Yardi Matrix, Las Vegas multifamily market report,, https://www.yardimatrix.com/market/las-vegas
- Yardi Matrix, Reno multifamily market report,, https://www.yardimatrix.com/market/reno
- U.S. Census Bureau, Building Permits Survey, Nevada,, https://www.census.gov/construction/bps/stateannual.html
- Nevada Department of Taxation, Commerce Tax and state tax structure,, https://tax.nv.gov
- Nevada Department of Taxation, Property Tax Overview,, https://tax.nv.gov/LocalGovt/PropertyTax/Property_Tax/
- Nevada Division of Insurance, property and casualty information,, https://doi.nv.gov/Consumers/Homeowners-Insurance/
- Nevada Revised Statutes, Chapter 118A Residential Landlord and Tenant,, https://www.leg.state.nv.us/NRS/NRS-118A.html
- Nevada Revised Statutes, property tax assessment caps,, https://www.leg.state.nv.us/NRS/NRS-361.html
- Nevada Department of Transportation, state highway system,, https://www.dot.nv.gov
- Harry Reid International Airport, passenger statistics,, https://www.harryreidairport.com/Statistics
- Reno Tahoe International Airport, airport statistics,, https://www.renoairport.com/about-airport/airport-statistics/
- U.S. Drought Monitor, Nevada,, https://droughtmonitor.unl.edu/CurrentMap/StateDroughtMonitor.aspx?NV
- U.S. Forest Service and National Interagency Fire Center, Great Basin fire reports,, https://www.nifc.gov/fire-information/statistics
- U.S. Geological Survey, Nevada earthquake hazards,, https://www.usgs.gov/programs/earthquake-hazards/earthquakes-nevada