
Section 01Executive Summary
New Jersey is a densely populated, high income Northeastern state that sits between the New York City and Philadelphia metropolitan areas, giving it exposure to two of the largest economies in the country. Its housing market is defined less by new supply than by scarcity. As of mid 2026, New Jersey remains one of the most supply constrained markets in the United States, a structural condition rooted in older housing stock, limited developable land, and restrictive local land use. Where New Jersey specific numeric series such as median rents, vacancy, or cap rates cannot be reliably obtained from public interfaces, that is stated explicitly rather than estimated.
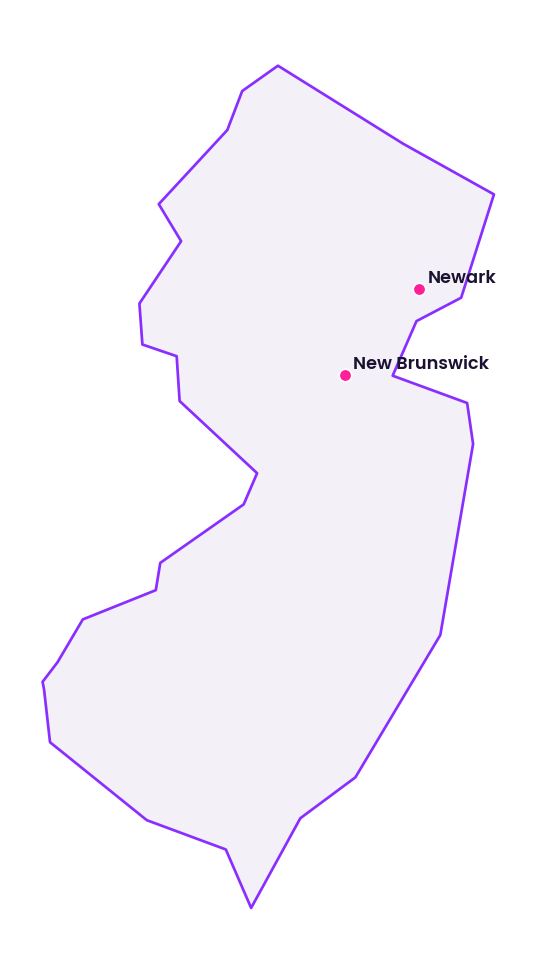
The supply picture is the defining feature. Realtor.com reported that in July 2026 the Northeast region carried about 117,778 active listings, up 8.3 percent year over year but still roughly 47 percent below the typical 2017 to 2019 level, the deepest deficit of any region in the country. Within that tight backdrop, Redfin identified Newark, New Brunswick, and neighboring New Jersey markets among the small group of major United States seller's markets in June 2026, meaning buyers still outnumber sellers. These figures are third party, dated, and were reviewed on August 8, 2026.
For investors, the implication is that New Jersey is a scarcity market. Well located, well priced homes continue to sell quickly, and the constrained pipeline tends to support rents and occupancy. That durability comes at a cost. New Jersey carries some of the highest effective property tax burdens in the nation, and entry pricing is high relative to lower cost regions. The state rewards income oriented strategies and disciplined underwriting rather than a bet on rapid price appreciation.
Section 02Population and Migration
Population trends drive housing demand and shape labor supply. Current official population counts and migration flows for New Jersey and its metropolitan areas are published by the United States Census Bureau through the Decennial Census, the Population and Housing Unit Estimates program, and the American Community Survey.
Structurally, New Jersey is one of the most densely populated states in the country, anchored by the northern counties within the New York City orbit and the southern counties tied to Philadelphia. Population growth has been slow and driven more by international migration and household formation than by domestic inflows, with some domestic out migration to lower cost and lower tax states in recent years. For investors, the takeaway is durable underlying demand paired with limited new household growth, which keeps pressure on an already tight housing stock rather than producing rapid expansion.
Section 03Jobs and Economic Anchors
New Jersey's economy rests on pharmaceuticals and life sciences, financial services, logistics and port activity, health care, education, and professional and business services. The state hosts major pharmaceutical and life science employers, one of the busiest port and logistics complexes on the East Coast around the Port of New York and New Jersey, and extensive back office and financial operations tied to the New York City economy. Statewide and metropolitan labor statistics are published by the Bureau of Labor Statistics through its Economy at a Glance, Local Area Unemployment Statistics, and Current Employment Statistics programs.
Proximity to Manhattan sustains a large commuter workforce whose housing demand concentrates along rail corridors.
Section 04Income
Income levels shape affordability, achievable rents, and tenant credit quality. New Jersey consistently ranks among the highest income states in the country, with elevated median household incomes in the northern commuter counties in particular.
For investors, high area incomes support strong rent levels and resilient occupancy in well located submarkets, while also underpinning high home prices. Underwriting should validate rent to income ratios with current local data, since affordability is stretched in the highest cost counties even for high earning households.
Section 05Housing and Multifamily
New Jersey housing stock is older and dense, with a mix of single family homes, two to four family properties, garden apartments, and mid and high rise multifamily concentrated near transit and employment. Supply is the defining constraint. Realtor.com reported that Northeast active listings in July 2026, at about 117,778, remained roughly 47 percent below the 2017 to 2019 norm despite an 8.3 percent year over year increase, the largest such deficit of any region. New construction is limited by developable land and local land use rules, so the pipeline rarely keeps pace with demand.
Redfin classified Newark and New Brunswick among the few major United States seller's markets in June 2026, where buyers still outnumber sellers, in contrast to the buyer's markets that have emerged across much of the Sun Belt. This review does not restate New Jersey specific numeric median home prices, inventory counts, or months of supply, because the public dashboards that would supply those figures require interactive access that cannot be parsed here. The structural signal, however, is clear: this is a tight, low supply market where well priced product moves quickly.
Section 06Rents
Rents drive cash flow and investment performance. Benchmark gross rents by bedroom count and metro are published by the United States Department of Housing and Urban Development Fair Market Rents, and asking and effective rents are tracked by proprietary providers.
Limited new supply and high ownership costs keep many households renting longer, which supports demand. Investors should underwrite from current property level rent rolls and competitive set surveys rather than national averages.
Section 07Vacancy
Vacancy influences income stability and pricing power. Rental and homeowner vacancy rates are published by the Census Bureau Housing Vacancy Survey and American Community Survey, and commercial vacancy is compiled by proprietary providers.
Structurally, a supply constrained, high demand market like New Jersey tends toward lower residential vacancy in well located submarkets, particularly near transit and major employers. Older assets in weaker locations can carry higher vacancy. Investors should weight actual historical occupancy for a specific asset, current leasing velocity, and the local pipeline over any statewide average.
Section 08Supply Pipeline
The supply pipeline determines future competition. Residential units authorized by permits are published by the Census Bureau Building Permits Survey, and local permitting offices track construction through issued permits and approvals.
Because the pipeline is limited relative to demand, new supply is less likely to overwhelm submarkets than in high construction Sun Belt states, which is part of why the market stays tight.
Section 09Single Family Homes
Single family homes are a core part of New Jersey housing, appealing to owner occupants and forming the basis for single family and small multifamily rental strategies.
Structurally, tight inventory and strong commuter demand support single family values across much of the state, with the strongest pricing in the northern counties and desirable school districts. Investors pursuing single family or two to four family rentals should expect a higher acquisition basis and a more competitive buying process than in lower cost regions, offset by durable demand and limited new supply.
Section 10Commercial Real Estate and Retail Centers
New Jersey commercial real estate spans a large industrial and logistics base tied to the Port of New York and New Jersey and interstate corridors, office in northern and central submarkets, and grocery anchored and neighborhood retail serving dense residential areas.
Office demand is more mixed and subject to hybrid work pressures, with well located, higher quality assets outperforming older commodity space. Grocery anchored and necessity retail in dense trade areas tends to be resilient. Income oriented industrial and necessity retail are the segments most consistent with the state fundamentals.
Section 11Transactions and Capital Markets
Higher interest rates in the current cycle have widened bid ask spreads and rewarded lower leverage buyers, as elsewhere. Current pricing and financing conditions should be assessed with up to date data obtained outside this environment.
Section 12Taxes
Taxes materially affect net returns in New Jersey. The state levies a graduated individual income tax and a corporation business tax, a statewide sales and use tax, and among the highest effective property tax burdens in the country, assessed and collected at the municipal level. Current numeric rate schedules are published by the New Jersey Division of Taxation and local assessors, and are delivered through interactive documents that are not easily parsed here, so specific rates are not restated.
For investors, the key point is that property tax is a large and variable operating cost in New Jersey, often materially higher than in many other states, and it can differ sharply by municipality and school district. Underwriting must model current assessments, likely reassessment after acquisition or improvement, and lease structures with respect to tax pass throughs. The full tax stack, not any single element, should drive comparisons with other states.
Section 13Insurance
Insurance is a significant operating expense and risk tool. The New Jersey Department of Banking and Insurance regulates property and casualty coverage in the state.
New Jersey risk profile includes coastal and riverine flood exposure, particularly along the Jersey Shore and in low lying and tidal areas, as well as Nor'easters, occasional hurricane remnants, and winter storms. Properties in special flood hazard areas may require flood insurance, especially when financed by regulated lenders. Investors should obtain current quotes, review deductibles and exclusions, and assess flood and wind exposure directly rather than relying on state averages.
Section 14Landlord Tenant and Regulatory Environment
New Jersey is generally regarded as a tenant protective state. Residential landlord tenant law is governed by state statute with significant additional protections, and many municipalities, including a number of the state largest cities, maintain local rent control ordinances. The Anti Eviction Act limits the grounds on which residential tenants can be removed, and eviction procedures involve notice requirements and court process.
For investors, this regulatory environment is a central underwriting input. Local rent control can cap rent growth in specific municipalities, and eviction timelines can be longer than in landlord friendly states. Legal counsel familiar with the specific municipality is essential when structuring leases and enforcement, and when evaluating any rent regulated asset.
Section 15Infrastructure
Infrastructure is a genuine competitive advantage for New Jersey real estate. The state hosts the Port of New York and New Jersey, one of the busiest container ports in the country, an extensive interstate highway network, major freight and passenger rail including direct commuter rail into Manhattan and Philadelphia, and major airports. This connectivity underpins the state industrial and logistics strength and supports transit oriented residential demand along rail corridors.
Detailed numeric traffic, freight tonnage, and ridership series are published by transportation agencies but are not reliably parsable here. Structurally, proximity to port, rail, and highway infrastructure enhances property desirability, especially for industrial and last mile logistics and for multifamily near transit. Utility networks are well established in the dense urban and suburban core.
Section 16Climate and Physical Risks
New Jersey experiences a temperate, four season climate with meaningful physical risk concentrated in flooding. Coastal flooding and storm surge affect the Jersey Shore and tidal areas, riverine flooding occurs along major rivers, and the state is exposed to Nor'easters, hurricane remnants, and winter storms. Federal Emergency Management Agency flood insurance rate maps identify special flood hazard areas along the coast and rivers, and the National Risk Index provides county level hazard indicators.
For investors, physical risk assessment should focus on elevation, proximity to the coast and floodplains, storm surge exposure, drainage, and building envelope condition. Coastal and tidal assets can carry material flood and wind risk and higher insurance costs. Investment in resilient design and elevation, along with careful site selection, can reduce long term risk and support insurance availability.
Section 17Opportunities
New Jersey offers income oriented opportunities for investors comfortable with a high cost, supply constrained, tenant protective market. Transit oriented multifamily near rail lines into Manhattan and Philadelphia benefits from durable commuter demand and limited new supply. Industrial and last mile logistics near the port and along interstate corridors is a national strength with deep investor demand. Grocery anchored and necessity retail in dense trade areas provides resilient income. Workforce and middle income multifamily in supply constrained submarkets can sustain occupancy and rents.
Section 18Risks
Investors also face real risks. High property taxes and high entry pricing compress yields and demand careful underwriting. Local rent control in certain municipalities can limit rent growth, and the tenant protective legal framework can lengthen eviction timelines and raise operational complexity. Coastal and riverine flood exposure raises insurance costs and physical risk in specific locations. Because this document does not provide current numeric New Jersey rent, vacancy, transaction, or cap rate series, there is information risk, and underwriting must rely on up to date data from other sources. Some domestic out migration to lower cost states is a longer term demand consideration.
Section 19Investor Implications
For accredited investors, New Jersey is a scarcity market that rewards income and durability over rapid appreciation. The defining facts are structural: a Northeast inventory deficit near 47 percent below 2017 to 2019 norms per Realtor.com, and Newark and New Brunswick among the few major seller's markets per Redfin in June 2026. That scarcity supports rents and occupancy in well located, transit connected submarkets, which is where cash flow is most durable.
Success depends on submarket selection and disciplined underwriting rather than broad statewide trends. Investors should model the full tax stack, especially property taxes, verify any local rent control, stress insurance for flood and wind exposed assets, and validate rents and vacancy with current local data. Industrial and logistics near the port, transit oriented multifamily, and necessity retail are the segments most aligned with the state fundamentals.
Section 20Conclusion
New Jersey is a dense, high income, supply constrained Northeastern market anchored by two major metropolitan economies, a national logistics complex, and a diversified employment base in life sciences, health care, financial services, and professional services. The most reliable current signal is scarcity: the Northeast carried the deepest inventory deficit of any region in July 2026 at roughly 47 percent below 2017 to 2019 norms, and New Jersey markets such as Newark and New Brunswick remained seller's markets in June 2026 while much of the Sun Belt tilted toward buyers.
For accredited investors willing to engage with a high cost, tenant protective, low supply market, New Jersey offers durable, income oriented opportunities, especially in logistics, transit oriented multifamily, and necessity retail, provided the analysis rests on disciplined underwriting, current local data, and a clear view of taxes, regulation, and flood risk.
Sources
- Realtor.com Research, July 2026 Monthly Housing Report,, https://www.realtor.com/research/july-2026-data/
- Redfin, Buyers versus sellers, June 2026,, https://www.redfin.com/news/buyers-vs-sellers-june-2026/
- Redfin, United States Housing Market and Prices,, https://www.redfin.com/us-housing-market
- U.S. Bureau of Labor Statistics, New Jersey Economy at a Glance,, https://www.bls.gov/eag/eag.nj.htm
- U.S. Census Bureau, Population and Housing Unit Estimates,, https://www.census.gov/programs-surveys/popest.html
- U.S. Census Bureau, American Community Survey (ACS),, https://www.census.gov/programs-surveys/acs
- U.S. Census Bureau, Building Permits Survey,, https://www.census.gov/construction/bps
- U.S. Department of Housing and Urban Development, Fair Market Rents,, https://www.huduser.gov/portal/datasets/fmr.html
- New Jersey Division of Taxation,, https://www.nj.gov/treasury/taxation/
- New Jersey Department of Banking and Insurance,, https://www.nj.gov/dobi/
- Federal Emergency Management Agency, Flood Map Service Center,, https://msc.fema.gov
- Federal Emergency Management Agency, National Risk Index,, https://hazards.fema.gov/nri