In brief · summary: New Mexico
New Mexico State Real Estate Market Review
Section 01Executive Summary
New Mexico is a resource rich, relatively low density state whose real estate markets are anchored by energy production in the Permian and San Juan basins, federal laboratories and military installations, tourism and culture in cities such as Santa Fe and Albuquerque, and a growing mix of technology and services. For multifamily and single family investors, the state offers a combination of urban and suburban demand in its larger metropolitan areas and more cyclical, employment sensitive demand in smaller energy and agricultural communities.
According to the United States Bureau of Labor Statistics Economy at a Glance table for New Mexico, the seasonally adjusted statewide civilian labor force was 985.2 thousand persons in January 2026 and a preliminary 972.5 thousand in June 2026. Statewide employment over the same period decreased from 940.9 thousand to a preliminary 925.6 thousand, while the number of unemployed persons rose from 44.3 thousand in January to 47.7 thousand in May and then eased to a preliminary 46.9 thousand in June. The statewide unemployment rate increased from 4.5 percent in January 2026 to 4.9 percent in April and May, then edged down to a preliminary 4.8 percent in June 2026. Total nonfarm employment in New Mexico moved from 890.8 thousand jobs in January 2026 to a preliminary 898.2 thousand in June 2026, with twelve month changes ranging from a negative 0.4 percent in January to a preliminary positive 0.6 percent in June. These figures are statewide, seasonally adjusted, and were extracted on August 7, 2026 from the Bureau of Labor Statistics New Mexico Economy at a Glance table.
Housing, income, and detailed demographic series for New Mexico from the United States Census Bureau, American Community Survey, United States Department of Housing and Urban Development, Federal Housing Finance Agency, and private housing data providers such as Zillow and RealPage are not directly accessible in this environment due to technical security limits that block programmatic access to key tables and large data files. As a result, this review cannot restate exact statewide population counts, median household incomes, statewide median home values, or state specific rent levels. When such precise figures are not available, the discussion notes that no official public numeric information is available in this environment and proceeds with qualitative analysis instead.
For investors, New Mexico is a hybrid of stable institutional anchors and cyclical resource exposure. Albuquerque and Santa Fe provide deeper multifamily and single family markets with more diverse economies, while smaller metros such as Farmington and Las Cruces and rural counties are influenced more heavily by energy, agriculture, and cross border dynamics. Multifamily and single family rentals are shaped by local incomes and, in some locations, federal employment and contractor demand. Commercial real estate opportunities exist in office, industrial, and retail tied to government, health care, logistics, and tourism. At the same time, investors must factor in limited data transparency under current constraints, relatively modest statewide job growth, climate and wildfire risk, water constraints, and a regulatory environment that can vary by locality.
Section 02Population and Migration
New Mexico’s population and migration patterns are normally described using the United States Census Bureau decennial census and annual population estimates, along with American Community Survey measures of age, household composition, and migration. In this environment, direct access to the current detailed Census tables for New Mexico is blocked by security protections on key web endpoints, so this review cannot provide exact statewide population counts, growth rates, age distributions, or net migration figures for recent years.
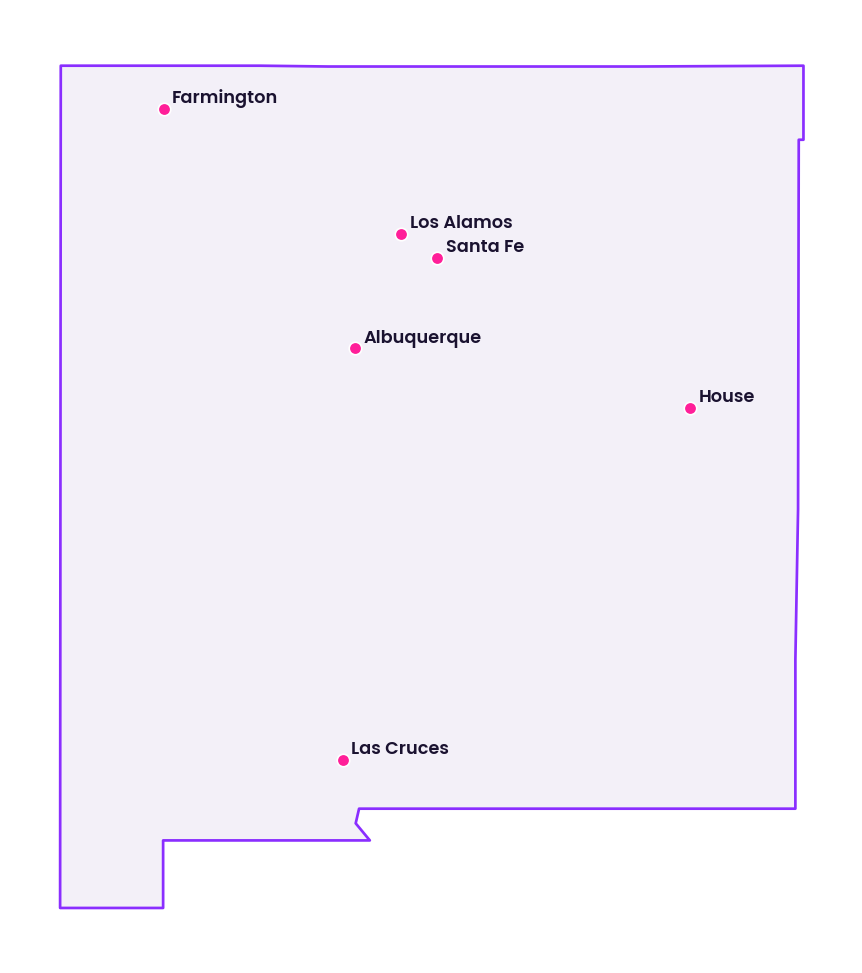
Qualitatively, public demographic information shows that New Mexico is a relatively small state by population, with residents concentrated in metropolitan areas such as Albuquerque, Santa Fe, Las Cruces, and Farmington, as well as in smaller cities and tribal communities. The population is notable for a high share of Hispanic and Native American residents compared with national averages, and for a mix of younger households in urban and energy producing areas and older residents in some rural and amenity driven communities.
Migration dynamics reflect both in migration and out migration. In migration includes households drawn by employment at federal laboratories, military bases, universities, health systems, and energy firms, as well as individuals attracted by New Mexico’s climate, culture, and relatively lower housing costs compared with some coastal markets. Out migration includes residents who move to other states for higher wages, broader job opportunities, or family reasons. The net impact of these flows on statewide population over the past few years cannot be quantified here with current official figures, but for investors it is important to recognize that growth is uneven, with metropolitan counties generally more dynamic than some rural areas that may be losing population.
From a real estate perspective, population and migration support demand in specific corridors rather than uniformly across the state. Investors must focus on county and metro level trends when available outside this document and should recognize that submarkets linked to expanding employment centers and amenities are likely to have stronger long term housing and commercial demand than areas with stagnant or declining populations.
Section 03Jobs and Economic Anchors
New Mexico’s economy is anchored by a combination of energy extraction, federal government and defense related activities, technology and research, tourism, and traditional sectors such as agriculture, retail, and services. Statewide labor market data from the United States Bureau of Labor Statistics for early 2026 illustrate both the scale and sectoral composition of employment.
As noted in the Executive Summary, the seasonally adjusted statewide civilian labor force declined from 985.2 thousand persons in January 2026 to a preliminary 972.5 thousand persons in June 2026, while statewide employment fell from 940.9 thousand to a preliminary 925.6 thousand over the same period. The statewide unemployment rate rose from 4.5 percent in January 2026 to 4.9 percent in April and May, before easing slightly to a preliminary 4.8 percent in June.
Total nonfarm employment in New Mexico was 890.8 thousand jobs in January 2026 and a preliminary 898.2 thousand in June 2026, with twelve month changes ranging from a negative 0.4 percent in January to a preliminary positive 0.6 percent in June. Sector level data from the same Bureau of Labor Statistics table show that in June 2026 New Mexico had a preliminary 26.3 thousand jobs in mining and logging, 55.6 thousand in construction, 27.8 thousand in manufacturing, 150.1 thousand in trade, transportation, and utilities, 8.9 thousand in information, 34.8 thousand in financial activities, 117.7 thousand in professional and business services, 155.4 thousand in education and health services, 100.1 thousand in leisure and hospitality, 27.8 thousand in other services, and 193.7 thousand in government. All of these figures are statewide, seasonally adjusted, and were extracted on August 7, 2026.
The twelve month percentage changes in sector employment for June 2026 underline divergent trends. Mining and logging jobs were up a preliminary 4.4 percent versus a year earlier, consistent with ongoing activity in oil and gas fields. Trade, transportation, and utilities jobs were up a preliminary 2.5 percent year over year, and education and health services jobs were up a preliminary 1.8 percent. By contrast, manufacturing jobs were down a preliminary 0.7 percent, information jobs were down a preliminary 4.3 percent, financial activities jobs were down a preliminary 1.7 percent, professional and business services jobs were down a preliminary 2.2 percent, other services jobs were down a preliminary 2.1 percent, and government jobs were up a modest preliminary 0.8 percent.
The table below summarizes selected statewide labor market indicators for three reference months in 2026.
| Month 2026 | Civilian labor force thousands (statewide, seasonally adjusted) | Employment thousands (statewide, seasonally adjusted) | Unemployment rate percent (statewide, seasonally adjusted) | Total nonfarm employment thousands (statewide, seasonally adjusted) | Twelve month change in total nonfarm jobs percent (statewide) |
|---|---|---|---|---|---|
| Jan 2026 | 985.2 | 940.9 | 4.5% | 890.8 | negative 0.4 |
| Mar 2026 | 982.4 | 935.7 | 4.8% | 890.7 | negative 0.3 |
| Jun 2026 preliminary | 972.5 | 925.6 | 4.8% | 898.2 | 0.6% |
In practical terms, these figures suggest that New Mexico’s labor market is relatively small in absolute terms, with total nonfarm jobs below one million, and that growth has been modest. Energy related employment provides a noticeable tailwind in mining and logging, but professional and business services and manufacturing have recorded small declines. Education and health services and leisure and hospitality are growing moderately, consistent with the state’s role as a regional center for health care, education, and tourism.
For real estate investors, these patterns imply that demand for space tied to energy extraction, trade, transportation, and health care is supported, while office and flex demand related to professional and business services may face more headwinds. Government and education anchors such as national laboratories and universities provide long term stability in specific submarkets, but statewide job creation is not rapid enough to lift all locations equally.
Section 04Income
Statewide income levels in New Mexico, including personal income and per capita personal income, are measured by the Bureau of Economic Analysis. Median household income, income distribution, and poverty rates are tracked by the United States Census Bureau and the American Community Survey. In this environment, programmatic access to the detailed state tables for New Mexico from these sources is blocked or constrained, so this review cannot restate precise current figures for statewide median household income, per capita personal income, or related measures.
Qualitatively, official datasets show that New Mexico has a mix of income profiles. There are relatively higher income households in parts of Albuquerque, Santa Fe, Los Alamos, and some energy producing communities, and lower incomes in many rural counties and in some tribal and border regions. The presence of federal laboratories, military bases, and energy companies introduces pockets of higher paying jobs, while large segments of the workforce are employed in lower wage service, retail, and agricultural roles.
For investors, the key implication is that rent and pricing strategies must be carefully matched to local income realities. Premium multifamily and single family products can succeed in high income nodes associated with federal and technology employment and in amenity rich areas, while workforce housing and affordable housing strategies are more appropriate in much of the state. Without reliable current statewide income figures in this document, investors should use up to date external data when constructing detailed underwriting models, while treating this review as a qualitative framework.
Section 05Housing and Multifamily
New Mexico’s housing stock combines urban multifamily and single family properties in its larger metropolitan areas with lower density housing and manufactured housing in rural and small town settings. Albuquerque is the largest multifamily market, with garden style and midrise communities and older walk up buildings, followed by Rio Rancho, Santa Fe, Las Cruces, and smaller nodes. In many rural and energy producing areas, multifamily is limited and housing demand is predominantly met by single family homes, small rentals, and manufactured housing.
Statewide counts of housing units, tenure shares for owners versus renters, and the age of the housing stock are maintained by the United States Census Bureau. Due to access limits in this environment, this review cannot provide exact figures for the number of occupied housing units in New Mexico, the renter share, or the distribution of multifamily units by structure size. Instead, it focuses on qualitative patterns that matter for investors.
In Albuquerque and Santa Fe, multifamily demand is driven by a mix of local workers, students, government and laboratory employees, health care staff, and service workers, as well as retirees and second home users in some submarkets. In Las Cruces, university related demand and cross border activity play larger roles. In energy influenced regions such as the Permian Basin in southeast New Mexico and the San Juan Basin in the northwest, multifamily and short term rentals are influenced directly by drilling and production cycles.
Private multifamily data platforms such as CoStar, Yardi Matrix, and RealPage maintain detailed inventories of New Mexico multifamily properties, including rents, vacancy, and absorption, but those numeric series are not accessible in this environment. As a result, this review does not provide current statewide average rent levels or occupancy rates for multifamily.
From an investment standpoint, multifamily opportunities in New Mexico are concentrated in the larger metropolitan areas and in specific employment driven pockets. Core and core plus strategies can focus on well located, newer properties in Albuquerque and Santa Fe, while value add strategies may target older communities that can benefit from renovations and improved management. Smaller energy and university towns can offer higher yielding but more cyclical multifamily investments, where returns depend heavily on commodity cycles or enrollment trends.
Section 06Rents
Rents in New Mexico for apartments and other residential units are tracked by the United States Department of Housing and Urban Development through Fair Market Rent benchmarks and by private data providers such as RealPage, Yardi Matrix, CoStar, and Zillow. In this environment, direct programmatic access to New Mexico specific rent series from these sources is not available, so this review cannot provide precise statewide or metro level rent figures or recent rent growth percentages.
At the national level, Redfin reports that the median sale price for all home types in the United States was 398,771 dollars in May 2026, an increase of 2.0 percent compared with May 2025, based on Redfin calculations of multiple listing service and public record data. Redfin also reports that there were 1,483,839 homes for sale nationwide in May 2026, up 0.7 percent year over year, and that 24.9 percent of homes sold above list price that month, a decrease of 0.083 percentage points from a year earlier. These figures, while national rather than state specific, provide context that home prices and the cost of entry into ownership remain elevated in many parts of the country, supporting ongoing rental demand where incomes and supply allow.
Within New Mexico, rent levels vary widely by location. High amenity neighborhoods in Albuquerque and Santa Fe that attract professionals, government employees, and retirees command higher rents than rural and small town markets. In university towns and tourist destinations, seasonal and academic calendar effects influence rent levels and occupancy patterns. Energy driven regions can see rapid rent increases during booms and notable softening during downturns.
For investors, the absence of numeric rent series in this review underscores the importance of on the ground rent surveys and property specific rent roll analysis before making investment decisions. Underwriting should reflect realistic rent levels for each submarket and asset class, and should be tested against local income constraints and likely competition from new and existing supply.
Section 07Vacancy
Vacancy in New Mexico’s multifamily, single family rental, and commercial sectors is driven by employment trends, migration, new construction, and property quality. There is no single public, statewide dataset that reports current vacancy rates by asset class in a way that is accessible in this environment, and proprietary vacancy series from platforms such as CoStar and RealPage cannot be extracted programmatically here. Therefore, this review does not present quantitative vacancy rates for New Mexico.
In qualitative terms, multifamily vacancy tends to be lowest in the most desirable neighborhoods of Albuquerque and Santa Fe, where demand from professionals, government workers, and retirees is stable and new supply is absorbed reasonably well. Properties near major employment centers, transit corridors, and amenities, and those that provide competitive finishes and management, tend to maintain healthier occupancy. In contrast, older or poorly located properties may experience higher vacancy and tenant turnover, particularly when new communities deliver nearby.
In energy influenced regions, vacancy can move sharply with commodity prices and drilling activity. When drilling ramps up, demand for units and short term housing increases, reducing vacancy and pushing rents upward. When activity slows, vacancy can rise quickly, creating volatility for landlords and investors.
Single family rental vacancy reflects neighborhood desirability, school quality, and the balance of local ownership versus rental demand. In some New Mexico communities, institutional single family rental activity is limited, and individual or small portfolio investors identify niche opportunities near stable employers.
Commercial vacancy is most favorable in industrial and logistics properties that support trade, energy, and distribution, while office and some retail properties face more challenges due to remote work, shifting consumer behavior, and competition from newer space. Without numbers in this document, investors must rely on current local data and broker insight when assessing vacancy in specific submarkets and assets.
Section 08Supply Pipeline
The supply pipeline for residential and commercial real estate in New Mexico is reflected in building permit data from the United States Census Bureau Building Permits Survey and in local planning and permitting records across the state’s counties and municipalities. In this environment, the detailed numeric permit counts for New Mexico by year and by unit type are not accessible, so this review cannot provide exact figures for the number of authorized residential units or the square footage of nonresidential projects in recent years.
Qualitatively, residential construction has been active in parts of the Albuquerque and Santa Fe metropolitan areas, where infill projects and suburban subdivisions address housing demand. Las Cruces and Rio Rancho have seen additional residential development tied to population growth and economic expansion. In smaller communities and rural areas, new single family and manufactured housing development has been more selective, often responding to specific energy or agricultural cycles.
Multifamily development in New Mexico has concentrated in Albuquerque and Santa Fe, with a mix of garden style and midrise communities, as well as some mixed use projects. The scale of new delivery is more modest than in large coastal or Sun Belt metros, but the impact on local rents and vacancy can be significant given smaller base inventories.
On the commercial side, industrial development has focused on logistics and distribution facilities near key highways and rail lines, as well as on facilities related to energy and manufacturing. Office construction has been limited, with emphasis on renovations and build to suit projects, while retail development has centered on grocery anchored centers and necessary service nodes.
For investors, the critical point is that New Mexico’s supply pipeline is lumpy and locally driven. A single large multifamily or industrial project in a smaller metro can shift market balance. Careful review of local permit and planning data, along with state and municipal economic development announcements, is necessary for accurate assessment of future competitive conditions.
Section 09Single Family Homes
Single family homes are the dominant housing form across New Mexico, from detached houses in Albuquerque and Santa Fe to smaller homes and manufactured housing in rural communities. Statewide and metro level measures of median home values, sale prices, and inventory are available from data providers such as the Federal Housing Finance Agency, Zillow, Redfin, and public real estate transaction records. However, in this environment, direct programmatic access to New Mexico specific home price series from those sources is blocked or truncated, so this review cannot state the current statewide median home value, recent year over year price changes, or statewide months of supply as numeric values.
National figures from Redfin provide context. As noted earlier, Redfin reports that for the United States overall, the median sale price for all home types in May 2026 was 398,771 dollars, up 2.0 percent from May 2025, there were 1,483,839 homes for sale, up 0.7 percent year over year, and 24.9 percent of homes sold above list price, down 0.083 percentage points year over year. These national statistics describe a housing market where prices continue to rise modestly, inventory is relatively constrained, and competitive bidding remains present but has eased slightly.
Within New Mexico, housing market conditions vary by region. Albuquerque and its suburbs tend to have more liquid markets and more diverse price points, with neighborhoods that range from entry level to high end. Santa Fe has a significant high value segment tied to second homes, tourism, arts, and retirees, which can drive prices and demand for both ownership and rentals. Las Cruces, Farmington, and other metros have their own local dynamics, incorporating university, energy, agricultural, and cross border influences.
Single family rental is an important part of the New Mexico housing landscape. In urban metros, investors hold portfolios of homes for rent to families, professionals, and students. In some energy influenced areas, single family rentals and small multifamily properties are integral to housing oil and gas workers and associated service providers. The degree of institutional participation in single family rental varies by market, with more activity likely in Albuquerque and Santa Fe than in smaller communities.
For investors, the absence of explicit New Mexico price and inventory figures in this document means that property level and metro level data must be obtained separately, but the strategic themes are clear. Single family investments in New Mexico may provide both income and potential appreciation, particularly in markets with solid employment anchors and amenity appeal, but actual outcomes depend on specific assets, management, and future market conditions. Entry prices and property taxes are generally lower than in many coastal states, but income levels are also lower, so rent and pricing strategies must maintain affordability. Energy and resort oriented markets can offer higher upside but also greater volatility.
Section 10Commercial Real Estate and Retail Centers
Commercial real estate in New Mexico includes office, industrial, and retail properties that serve state and local governments, federal agencies, laboratories, universities, health systems, logistics operators, retailers, and tourism.
Office markets are concentrated in Albuquerque and Santa Fe, with additional office space in Las Cruces and other regional centers. Tenants include state agencies, federal offices, law firms, professional services, health care administrators, and technology and laboratory functions. Nationwide shifts toward remote and hybrid work have affected office demand, and New Mexico is no exception. Without accessible proprietary datasets, this review cannot present current statewide office vacancy rates or asking rents with numeric precision. However, qualitative evidence from market commentary indicates that older, commodity office buildings face higher vacancy and pressure for repositioning, while well located, modern office space with strong tenants remains relatively resilient.
Industrial and logistics properties are tied to supply chains, energy production, manufacturing, and trade routes. Distribution centers near interstate highways and rail lines, warehouses supporting regional retail and e commerce, and facilities connected to oil and gas operations in the southeastern and northwestern parts of the state form the backbone of the industrial sector. Industrial assets have generally benefited from broader growth in logistics and e commerce, though state specific vacancy and rent data are not available in this environment.
Retail centers in New Mexico range from grocery anchored neighborhood centers and community centers to regional shopping centers and tourist oriented districts. Grocery, pharmacy, discount retail, and essential services tenants are key anchors for many centers and provide relatively stable traffic. Tourist and arts districts in cities such as Santa Fe draw spending from visitors, supporting specialty retail, restaurants, and galleries. As elsewhere, retail is adapting to competition from online channels, with some older formats under pressure.
Vacancy, rents, and cap rates for New Mexico commercial properties are tracked by CoStar and brokerage research, but those series are proprietary and not accessible here. As such, this review cannot give specific figures for statewide commercial vacancy or capitalization rates. Investors must instead focus on tenant quality, lease structures, building condition, and local economic drivers when underwriting commercial assets, and should recognize that liquidity and depth vary significantly between Albuquerque and smaller markets.
Section 11Transactions and Capital Markets
Public, free datasets that comprehensively report New Mexico commercial and multifamily real estate transaction volumes, pricing, and cap rates across all asset classes are limited. Large transactions and many smaller ones are recorded in county property and deed records and are aggregated and analyzed by private platforms such as CoStar and by major brokerage firms. In this environment, those proprietary transaction datasets are not accessible, and this review cannot present authoritative numeric statistics for statewide annual transaction volumes, average cap rates, or typical leverage ratios in New Mexico.
Qualitative evidence suggests that institutional investment is most concentrated in Albuquerque and Santa Fe multifamily, industrial, and selected retail assets, with some additional presence in Las Cruces and in specialized properties tied to federal operations. Smaller private investors, regional funds, and local owners are more prominent in smaller markets and in asset classes such as small retail centers, flex space, and single tenant net lease properties.
Capital availability for New Mexico real estate comes from a mix of local and regional banks, national lenders with exposure to the Southwest, and capital markets channels for institutional grade assets. The higher interest rate environment during the mid 2020s has led to more conservative underwriting, including lower loan to value ratios and higher debt service coverage requirements. These conditions affect pricing and may create opportunities for equity investors who can transact without high leverage or who can provide structured capital.
Investors considering New Mexico assets should assume that transaction liquidity and depth vary by market and property type. Entry and exit strategies may require longer time frames than in major coastal metros, and pricing discovery may depend more heavily on recent comparable sales and broker insight than on broad statistical series.
Section 12Taxes
New Mexico’s tax environment for real estate includes property taxes, state and local gross receipts taxes, and state income taxes, all of which influence investment returns. Property taxes are administered primarily at the county level, with assessments and rates that vary by jurisdiction and by property type. The New Mexico Taxation and Revenue Department oversees statewide tax policy and administration.
In this environment, detailed statewide averages for effective property tax rates on residential and commercial property cannot be stated numerically, because consolidated statistics from official sources are not readily accessible. Property tax bills for individual parcels are documented in county records, but aggregating those into representative statewide metrics is beyond the scope of this review under current data constraints.
Investors should be aware that property taxes, while often lower in New Mexico than in some high tax coastal states, still represent a significant operating expense. Assessments can change following reassessment cycles, new construction, or changes in use. Some economic development projects may benefit from abatements or special district financing, which can alter effective tax burdens.
New Mexico also imposes a gross receipts tax that functions as a broad based tax on many goods and services, including some services related to real estate. Rates vary by location when local options are included. State personal and corporate income taxes apply to residents and entities and may influence investment structuring.
Given the lack of precise numeric tax burden figures in this document, investors must incorporate property specific tax analysis using current county and state data when modeling returns, and should consider seeking local tax advice to identify incentives and obligations.
Section 13Insurance
Insurance for New Mexico real estate is regulated by the New Mexico Office of Superintendent of Insurance and is shaped by the state’s exposure to wildfire, drought, flooding, hail, and other hazards. Owners typically purchase property insurance that covers fire, wind, hail, and other perils, along with liability coverage. In some locations, specialized coverage for flood or wildfire may be warranted.
New Mexico’s climate, as documented by the National Oceanic and Atmospheric Administration, includes hot, dry summers, cooler winters, and significant variation in precipitation by region and elevation. Many areas experience limited rainfall and are prone to drought, while monsoon season storms can bring intense localized rainfall and flash flooding. Mountainous and forested regions are at risk for wildfires, especially during dry and windy periods, and smoke can affect regions well beyond the immediate burn areas. Hail and severe thunderstorms can damage roofs, vehicles, and exterior elements.
Flood risk in New Mexico is often localized along arroyos, rivers, and low lying areas that can fill rapidly during intense storms. Federal Emergency Management Agency maps identify special flood hazard areas where federal flood insurance requirements apply to many mortgaged properties. Outside officially mapped floodplains, stormwater management and topography still play critical roles in determining risk.
Insurance markets in many western and southwestern states have faced rising premiums and changing underwriting standards due to wildfire and severe weather events. While New Mexico does not face hurricane risk, it is part of this broader regional pattern. Investors should expect that insurance costs can increase over time and that some carriers may adjust their appetites for certain high risk areas or construction types.
From an underwriting perspective, investors should evaluate property specific risk factors, including proximity to wildland interfaces, quality of defensible space and vegetation management, building materials and roof types, elevation and drainage patterns, and local fire protection resources. Proactive risk mitigation can support better insurance outcomes and long term asset resilience.
Section 14Landlord Tenant and Regulatory Environment
New Mexico’s landlord tenant framework is set by state statutes and supplemented by local ordinances. State law governs residential leases, defining landlord obligations for habitability, repairs, and compliance with housing codes, as well as tenant responsibilities for rent payment, maintenance of reasonable cleanliness, and avoidance of damage. Eviction procedures require appropriate notice and court processes, with rules that seek to balance property rights and tenant protections.
New Mexico does not operate a statewide rent control system, and there is no widely implemented local rent control regime comparable to those found in some coastal states. Rents are largely determined by market conditions and lease terms, subject to fair housing and anti discrimination laws at the federal and state levels. Localities may adopt ordinances related to rental registration, inspections, and health and safety standards, which can influence operating practices.
Commercial leases are primarily governed by contract, allowing parties to allocate maintenance, tax, insurance, and capital responsibilities through triple net, modified gross, or full service structures. State law provides the baseline for contract enforcement and remedies.
For investors, the regulatory environment in New Mexico offers relative flexibility compared with jurisdictions with strict rent regulation. At the same time, owners must comply with habitability, fair housing, and local code requirements and should monitor any legislative developments related to housing affordability, tenant protections, or short term rental regulation. Enforcement practices and tenant advocacy can vary by city and county, and reputational considerations are increasingly important for institutional investors.
Section 15Infrastructure
Infrastructure is central to New Mexico’s economic geography and real estate markets. The state’s principal highways, including interstate routes, connect metropolitan areas and provide critical links to neighboring states and to ports of entry. These corridors support freight movement, commuting, and tourism. Rail lines and intermodal facilities further anchor logistics and industrial activity.
Within metropolitan areas, local road networks connect residential neighborhoods to employment centers, schools, and services. Public transportation is most developed in Albuquerque, where bus and rapid transit services provide alternatives to private vehicles in key corridors. Other cities have more limited transit offerings, and many residents rely primarily on cars.
Water infrastructure is a defining factor for New Mexico. Municipal water systems, irrigation networks, and reservoirs depend on limited and variable water supplies. Drought conditions, competing demands among urban, agricultural, tribal, and environmental uses, and complex legal frameworks governing water rights all influence development patterns and project feasibility.
Electric power infrastructure includes generation from a mix of fossil fuels and renewables, as well as transmission and distribution networks across a large and varied landscape. Telecommunications and broadband services are established in metropolitan areas and along major corridors, but rural bandwidth can be more limited, affecting some types of development.
For investors, infrastructure considerations extend beyond accessibility. Water availability and reliability, sewer and wastewater capacity, and power and broadband quality can be decisive for both residential and commercial projects. Properties and sites that combine transportation access with robust utility infrastructure are better positioned for long term demand. Conversely, locations where infrastructure is constrained or aging may face higher costs and longer timelines for redevelopment or new development.
Section 16Climate and Physical Risks
New Mexico’s climate and physical geography present a distinctive set of risks and opportunities for real estate. National Oceanic and Atmospheric Administration climate data highlight that the state experiences significant temperature swings, with hot summers, cooler winters, and large differences between day and night, particularly at higher elevations. Precipitation is highly seasonal and uneven, with monsoon storms bringing heavy rain to some regions during parts of the year and prolonged dry periods in others.
Drought is a recurrent challenge, affecting water supplies for cities, agriculture, and ecosystems. Prolonged droughts can reduce reservoir levels, stress groundwater resources, and lead to restrictions on water use. Wildfire is another major risk, particularly in forested and grassland areas where dry conditions and high winds can allow fires to spread quickly. Wildfire seasons have varied in intensity over time and have caused direct property damage as well as smoke and air quality impacts across large areas.
Flash flooding occurs when intense rainfall overwhelms dry soils and drainage systems, particularly in arroyos and canyons. Built environments in low lying or poorly drained areas can be vulnerable to these events, even outside mapped floodplains. In some areas, erosion and slope stability issues add to physical risk.
Heat waves, while often considered part of the normal climate, can become more hazardous when temperatures exceed design assumptions for building systems or when power and water infrastructure is stressed. Cooling demands can increase operating costs and affect tenant comfort and health, especially in older buildings without efficient insulation or climate control.
For investors, integrating climate and physical risk into due diligence is essential. Site specific evaluation should include wildfire risk maps, proximity to wildland urban interfaces, historical fire and smoke patterns, floodplain designations, topography, and water supply conditions. Building level assessments should consider structural resilience, defensible space, roofing and cladding materials, and mechanical systems. Over multiyear horizons, evolving climate conditions and policy responses may influence building codes, insurance availability, and tenant expectations regarding resilience and sustainability.
Section 17Opportunities
New Mexico offers several distinct opportunity themes for real estate investors, notwithstanding the data limitations in this environment. In multifamily, Albuquerque and Santa Fe provide the most established markets. Well located communities that serve a mix of professionals, government and laboratory employees, students, and retirees may, depending on asset and management, experience relatively stable occupancy and cash flows over time, though outcomes vary by property and market conditions. Value add strategies may focus on upgrading older properties to align with contemporary tenant expectations, while preserving affordability relative to incomes.
Single family and small multifamily rentals in neighborhoods near major employers, universities, and amenities offer another avenue for income oriented investment. In Santa Fe and certain amenity rich areas, properties can serve both long term residents and second home or vacation oriented users, although such strategies require careful navigation of local regulations related to short term rentals.
Industrial and logistics properties tied to distribution, energy, and manufacturing activity may, in some cases, offer risk adjusted income profiles that some investors find appealing, especially when backed by long term leases to creditworthy tenants, but there is no assurance of any particular performance. Facilities that support renewables and energy transition infrastructure may become more prominent over time.
Retail opportunities exist in grocery anchored and necessity based centers that serve growing residential areas and stable communities. Centers that combine essential goods with services and experiential offerings are often viewed as relatively resilient in the face of online competition, although individual asset performance varies.
At the state level, public and private investment in laboratories, universities, and technology initiatives may create additional demand nodes for housing and commercial space. Investors who can identify and align with these institutional anchors may be able to participate in related growth, recognizing that project level and market level results are uncertain.
Section 18Risks
Investing in New Mexico real estate also entails material risks that must be weighed carefully. Economic growth at the statewide level has been modest. As the Bureau of Labor Statistics data show, total nonfarm employment was only 0.6 percent higher in June 2026 than a year earlier on a preliminary basis, and several key sectors, including manufacturing, information, financial activities, and professional and business services, recorded negative twelve month employment changes in June 2026. This slow and uneven growth limits the ability of rising demand to absorb mispriced supply or speculative projects.
Energy dependence in parts of the state introduces cyclicality. The preliminary 4.4 percent twelve month job growth in mining and logging in June 2026 underscores the current strength of that sector, but past cycles demonstrate that oil and gas activity can contract sharply, affecting housing and commercial demand in affected regions.
Climate and physical risks, including drought, wildfire, and localized flooding, can damage properties, disrupt operations, and increase insurance costs. Over time, such risks may affect desirability of certain locations and drive regulatory changes.
Data and transparency risks are also relevant under current technical constraints. Inability to access up to date official population, income, and housing price data in this environment highlights the need for investors to ensure they have robust external data sources and local intelligence. Investments based on incomplete or outdated information carry elevated risk.
Market size and liquidity vary significantly. While Albuquerque and Santa Fe offer more depth, smaller metros and rural markets may have limited buyer pools and fewer financing options, which can affect exit strategies and pricing.
Section 19Investor Implications
For accredited investors, New Mexico should be approached as a state with targeted, submarket specific opportunities rather than as a uniform growth story. The combination of federal, state, and energy anchors provides a degree of stability, but overall job growth is modest and uneven across sectors. Investors who focus on locations and property types aligned with resilient demand drivers, such as government, health care, logistics, and certain tourism segments, may be better positioned to pursue their own risk adjusted return objectives, although no specific level of performance is assured.
Multifamily and single family rental investments should be concentrated in metropolitan and employment rich areas where tenant demand is durable and income levels can support planned rent structures. Underwriting must account for local incomes and the potential for volatility in energy or tourism driven markets.
Industrial and logistics investments can play a constructive role in a diversified portfolio, particularly where assets serve essential supply chains or energy operations with long term prospects. Retail investments should emphasize necessity based centers with strong anchors, while office strategies should be selective and focused on properties with clear tenant resilience.
Given the constraints on publicly accessible data in this environment, investors should supplement this qualitative review with current quantitative datasets and local market intelligence. Conservative assumptions, careful scenario analysis, and strong alignment with experienced local operators can help mitigate the risks associated with economic cyclicality, climate exposure, and limited liquidity in certain submarkets.
Section 20Conclusion
New Mexico’s real estate markets reflect the state’s distinctive mix of energy resources, federal and defense related institutions, cultural and natural amenities, and relatively small population. Statewide labor market data from the United States Bureau of Labor Statistics show that in early 2026 the civilian labor force was just under one million persons, with an unemployment rate near five percent and total nonfarm employment below one million jobs, growing only modestly on a twelve month basis. Sectoral trends highlight strength in mining and logging and in trade, transportation, and utilities, modest growth in education and health services and leisure and hospitality, and weakness in several white collar and service categories.
Within this economic context, multifamily, single family, and commercial real estate opportunities in New Mexico are highly localized. Albuquerque and Santa Fe remain the primary arenas for institutional scale investment, while smaller markets offer niche plays linked to energy, universities, and tourism. Climate and water constraints, along with modest statewide job growth and sometimes limited liquidity, temper the growth narrative and require disciplined underwriting and risk management.
For accredited investors who understand these dynamics and who approach New Mexico with a focus on resilient demand drivers, prudent leverage, and strong local partnerships, the state may, in some portfolio constructions, contribute both diversification and income characteristics to a broader real estate portfolio, although this is not guaranteed and depends on specific asset selection and outcomes. However, such investments must be grounded in careful analysis of submarket fundamentals and a realistic appreciation of the region’s economic, environmental, and data related uncertainties.
Sources
- United States Bureau of Labor Statistics, New Mexico Economy at a Glance, statewide labor force, employment, unemployment, unemployment rate, and nonfarm employment by sector, monthly data January 2026 through June 2026, seasonally adjusted, extracted August 7, 2026,, https://www.bls.gov/eag/eag.nm.htm
- United States Bureau of Labor Statistics, Local Area Unemployment Statistics, state and local unemployment and labor force measures for New Mexico, various years,, https://www.bls.gov/lau
- United States Bureau of Labor Statistics, Current Employment Statistics, statewide employment by industry for New Mexico, various years,, https://www.bls.gov/sae
- United States Bureau of Labor Statistics, Quarterly Census of Employment and Wages, employment and wages by industry for New Mexico counties and metropolitan areas, various years,, https://www.bls.gov/cew
- United States Census Bureau, Decennial Census of Population and Housing, state, county, and place level data for New Mexico, various years,, https://www.census.gov/programs-surveys/decennial-census.html
- United States Census Bureau, American Community Survey, one year and five year estimates of demographic, income, tenure, and housing characteristics for New Mexico and its counties and metropolitan areas, various years,, https://www.census.gov/programs-surveys/acs
- United States Census Bureau, Population and Housing Unit Estimates, annual estimates for New Mexico statewide and for counties and metropolitan areas, various years,, https://www.census.gov/programs-surveys/popest.html
- United States Census Bureau, QuickFacts, New Mexico state profile, various indicators, current access blocked by security protections in this environment,, https://www.census.gov/quickfacts/fact/table/NM
- United States Census Bureau, Building Permits Survey, residential building permits for New Mexico, various years,, https://www.census.gov/construction/bps
- Bureau of Economic Analysis, Local Area Personal Income, personal income and per capita personal income for New Mexico statewide and for metropolitan and nonmetropolitan areas, various years,, https://www.bea.gov/data/income-saving/local-area-personal-income
- Bureau of Economic Analysis, Gross Domestic Product by state, inflation adjusted and current dollar GDP for New Mexico, various years,, https://www.bea.gov/data/gdp/gdp-state
- United States Department of Housing and Urban Development, Fair Market Rents and income limits for New Mexico metropolitan and nonmetropolitan areas, various years,, https://www.huduser.gov
- Federal Housing Finance Agency, House Price Index, state level home price indices for New Mexico, various years,, https://www.fhfa.gov/DataTools/Downloads/Pages/House-Price-Index.aspx
- New Mexico Mortgage Finance Authority, statewide housing finance programs and reports related to affordable housing and multifamily finance in New Mexico, various years,, https://housingnm.org
- New Mexico Taxation and Revenue Department, state tax policy, property taxation framework, and gross receipts tax information relevant to real estate, various years,, https://www.tax.newmexico.gov
- New Mexico Office of Superintendent of Insurance, regulatory information on property and casualty insurance markets in New Mexico, various years,, https://www.osi.state.nm.us
- Federal Emergency Management Agency, Flood Map Service Center, flood insurance rate maps and special flood hazard area designations for New Mexico jurisdictions, various years,, https://msc.fema.gov
- Federal Emergency Management Agency, National Risk Index, hazard risk indicators for New Mexico counties and communities, various years,, https://hazards.fema.gov/nri
- National Oceanic and Atmospheric Administration, National Centers for Environmental Information, climate normals and historical weather data for New Mexico regions and stations, various years,, https://www.ncei.noaa.gov
- Redfin, United States Housing Market page, national median sale price, inventory, and share of homes sold above list price for May 2026, accessed August 7, 2026,, https://www.redfin.com/us-housing-market
- CoStar Group, commercial real estate analytics and transaction data for New Mexico multifamily, office, industrial, and retail properties, various years,, https://www.costar.com
- Yardi Matrix, multifamily market coverage and analytics for New Mexico metropolitan areas, various years,, https://www.yardimatrix.com
- RealPage, multifamily analytics and rent trend data for New Mexico markets, various years,, https://www.realpage.com/analytics
- Zillow Research, housing and rent data for New Mexico and other states via statewide and metropolitan indices, various years,, https://www.zillow.com/research/data