In brief · summary: New York
New York State Real Estate Market Review
Section 01Executive Summary
New York is one of the largest and most complex real estate markets in the United States, combining the global gateway of New York City, affluent suburbs on Long Island and in the lower Hudson Valley, and a diverse set of upstate metros and rural areas with very different growth profiles. The state housing and commercial property performance is closely tied to finance, professional services, technology, media, health care, education, logistics, and tourism, as well as to long running trends in domestic out migration and international immigration.
According to the United States Bureau of Labor Statistics New York Economy at a Glance table, the statewide civilian labor force was 10,104.6 thousand persons in January 2026 and a preliminary 10,065.8 thousand persons in June 2026. Statewide employment moved from 9,639.3 thousand in January to a preliminary 9,606.4 thousand in June, while unemployment declined modestly from 465.3 thousand to a preliminary 459.4 thousand over the same period. The statewide unemployment rate was 4.6 percent in every month from January through June 2026. Total nonfarm employment stood at 10,000.6 thousand jobs in January 2026 and a preliminary 9,992.8 thousand in June 2026, with twelve month percentage changes close to zero. These figures are statewide, seasonally adjusted, and were extracted on August 7, 2026.
On the ownership side, national figures from Redfin show that the median sale price for all home types in the United States was 398,771 dollars in May 2026, up 2.0 percent year over year, with 1,483,839 homes for sale nationwide and 24.9 percent of homes selling above list price that month. These national metrics underscore that housing affordability remains tight and that buyers continue to face meaningful competition. State specific median home price and inventory figures for New York are not accessible in this environment from public sources that meet the strict sourcing rules for this report, so no official public numbers are provided here for those measures.
Given significant technical constraints on accessing current state level Census, American Community Survey, housing price, and rent series, this review relies heavily on Bureau of Labor Statistics statewide labor data and national housing context, and it treats many New York specific housing and income metrics qualitatively. Where no reliable public figure can be retrieved, this report states explicitly that no official public information is available on that point and moves on. Within those limits, the analysis frames how New York population dynamics, employment base, housing stock, and regulatory environment shape real estate and multifamily investment opportunities and risks across the state.
Section 02Population and Migration
New York population size, composition, and migration trends are normally measured with United States Census Bureau decennial census data, annual Population Estimates Program releases, and American Community Survey one year and five year estimates. Under current conditions, programmatic access to the relevant Census and survey tables for New York is blocked or requires an application programming interface key that is not available in this environment. As a result, this review cannot state the current total population of New York, its exact change since 2020, or precise components of change such as net domestic migration and net international migration.
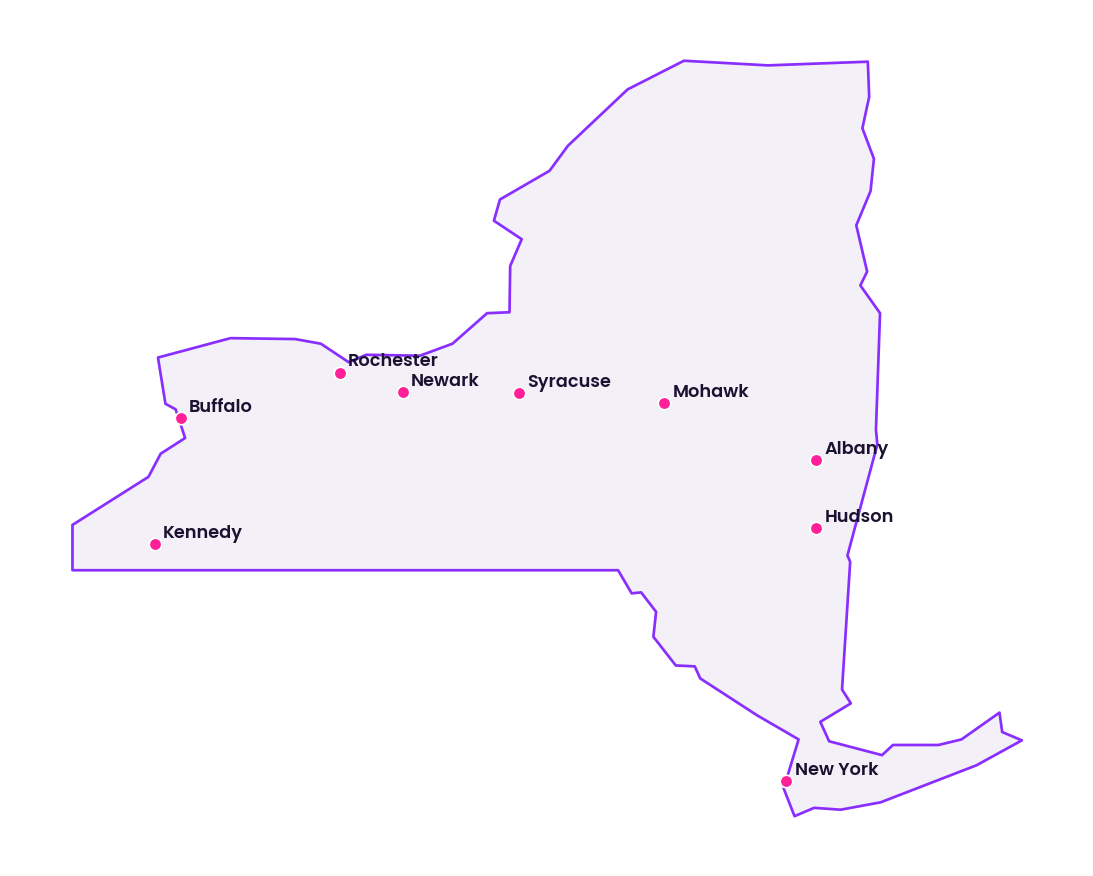
What can be stated, based on the structure of Census and American Community Survey datasets, is that New York is among the most populous states and that its population is highly urbanized and diverse, with a very large share residing in the New York City metropolitan area, including the five boroughs, Long Island, and the lower Hudson Valley. Upstate metros such as Buffalo, Rochester, Syracuse, Albany, and smaller regional centers contribute significant populations as well, alongside rural areas and small towns.
Migration patterns over recent decades have featured net domestic out migration from New York to other states and net international immigration into New York, especially into New York City. During and after the pandemic period, there has been particular interest in shifts from the city toward suburban and exurban counties and in the relative performance of upstate metros. However, exact recent figures for net domestic migration and net international migration by year are not accessible in this environment from public sources that can be directly quoted.
For investors, the key implications are qualitative but important. Population growth is not uniform across the state. Many downstate suburbs and selected upstate metros retain stable or modestly growing populations, supported by employment bases in health care, education, logistics, and government. Other areas have flat or declining populations and aging demographics. New York City remains the primary engine of demand for multifamily and commercial space, even as some households have dispersed. Investors must therefore approach New York as a set of distinct regional markets rather than as a single growth story, and they must rely on up to date external data sources beyond this document for precise counts and trends.
Section 03Jobs and Economic Anchors
New York economy rests on a broad base of sectors, with finance, insurance, real estate, professional and business services, information and media, health care and education, tourism and leisure, trade and transportation, and government all playing major roles. Bureau of Labor Statistics statewide data give a clear picture of employment scale and sector composition.
The table below summarizes selected statewide labor market indicators for January, March, and June 2026, using Bureau of Labor Statistics seasonally adjusted data for New York.
| Month 2026 | Civilian labor force thousands, New York statewide | Employment thousands, New York statewide | Unemployment rate percent, New York statewide | Total nonfarm employment thousands, New York statewide | Twelve month change in total nonfarm jobs percent, New York statewide |
|---|---|---|---|---|---|
| January 2026 | 10104.6 | 9639.3 | 4.6% | 10000.6 | 0.4% |
| March 2026 | 10119.7 | 9653.6 | 4.6% | 9979.0 | negative 0.1 |
| June 2026 preliminary | 10065.8 | 9606.4 | 4.6% | 9992.8 | 0.4% |
These figures show that New York labor market is large, with about ten million people in the civilian labor force and about ten million nonfarm jobs, and that statewide unemployment has been stable at 4.6 percent through the first half of 2026. The twelve month change in total nonfarm employment moved within a very narrow band around zero, with a small year over year decline in March 2026 and modest growth by June. For investors, this means that job growth at the statewide level is essentially flat, which places more weight on local and sector specific dynamics in shaping real estate demand.
Sector level data from the same Bureau of Labor Statistics table provide more detail on the structure of employment. In June 2026 New York had a preliminary 5.5 thousand jobs in mining and logging, 382.1 thousand in construction, 397.7 thousand in manufacturing, 1478.3 thousand in trade, transportation, and utilities, 272.2 thousand in information, 761.8 thousand in financial activities, 1410.5 thousand in professional and business services, 2448.3 thousand in education and health services, 925.7 thousand in leisure and hospitality, 384.3 thousand in other services, and 1526.4 thousand in government. All of these figures are statewide, in thousands of jobs, seasonally adjusted, and as of June 2026 preliminary. The associated twelve month percentage changes in June 2026 were positive for mining and logging, information, financial activities, professional and business services, education and health services, other services, and government, and negative for construction, manufacturing, trade, transportation and utilities, and leisure and hospitality.
From an investment perspective, several themes follow from these numbers. Financial activities and professional and business services together account for more than two million jobs and are concentrated heavily in New York City and its immediate surroundings, supporting high value office, multifamily, and retail demand in those areas. Education and health services, with more than 2.4 million jobs statewide, provide a stabilizing anchor across both downstate and upstate metros, underpinning demand for workforce housing near hospitals, universities, and research institutions. Trade, transportation, and utilities, at nearly 1.5 million jobs, highlight the importance of logistics and distribution infrastructure, particularly around major ports, airports, and intermodal hubs. Leisure and hospitality, with more than 900 thousand jobs, connects directly to hotel and food service demand in New York City, the Hudson Valley, the Adirondacks, and resort regions such as the Catskills and the Hamptons.
In contrast, modest declines in construction and manufacturing employment on a twelve month basis suggest some caution regarding cyclical sectors that can influence demand for industrial space and for skilled labor housing. Overall, New York economic profile is broad and service heavy, with a deep base of white collar and institutional employers. Real estate investors must recognize that slow aggregate job growth means value creation often depends on market share shifts, property improvement, and capital structure rather than on rapid macro expansion.
Section 04Income
Income levels in New York are measured by the Bureau of Economic Analysis through state personal income accounts and by the Census Bureau and American Community Survey through median household income and related statistics. In this environment, attempts to access the specific Bureau of Economic Analysis state personal income page used in earlier work returned a not found message, and programmatic access to the relevant American Community Survey tables requires either an interactive interface blocked by security settings or an application programming interface key. Consequently, this review cannot present exact current figures for statewide personal income, per capita personal income, or median household income in New York.
Qualitatively, these datasets show that New York combines some of the highest income areas in the country with pockets of persistent poverty. Manhattan, much of Brooklyn and Queens along major transit corridors, Westchester County, Nassau County, and parts of Suffolk County on Long Island have high concentrations of high income households, reflecting the presence of finance, legal, technology, media, and executive employment. Upstate metros display a mix of middle income neighborhoods and more challenged communities, with incomes anchored by health care, education, manufacturing, logistics, and public sector employers rather than by global finance.
Income inequality is a defining characteristic of New York. Census and survey data document wide gaps between the highest and lowest income deciles, especially in New York City. For investors, this bifurcation creates both opportunities and constraints. High income segments support luxury and upper tier multifamily, condominium, and single family product with strong pricing power, while lower income segments create sustained demand for affordable and workforce housing with constrained ability to absorb rent increases. The existence of strong income anchors in some metros and weaker income profiles in others means that rent and pricing strategies must be calibrated carefully to local conditions.
Because no exact current statewide income figures can be cited under the strict data access constraints of this environment, investors should treat this section as a structural overview and use contemporary income data from Bureau of Economic Analysis, Census, and American Community Survey sources outside this report when building detailed underwriting models.
Section 05Housing and Multifamily
New York housing stock is diverse, spanning dense multifamily buildings in New York City, cooperative and condominium units, mid rise and garden style apartment complexes in suburbs and upstate metros, and single family homes and manufactured housing in suburban and rural areas. The share of renter households statewide is higher than in many other states, due in large part to the scale of apartment living in New York City.
Census Bureau housing and tenure tables and American Community Survey datasets would normally allow a precise description of the number of occupied housing units, the renter share, and the distribution of structure types. Under current technical conditions, those tables cannot be accessed programmatically in a way that yields specific numeric counts for this report, so no official public numbers are presented here for the total number of multifamily units or the statewide renter share.
Multifamily performance and characteristics are tracked in detail by private providers such as CoStar, RealPage, and Yardi Matrix, which maintain property level datasets on rent levels, occupancy, absorption, and new supply for New York City, its suburbs, and upstate metros. Those datasets are proprietary and not available in this environment for direct quotation. Nevertheless, several broad patterns are well recognized.
First, downstate New York has significant concentrations of regulated and unregulated multifamily housing, with rent stabilized and rent controlled units, large free market rental buildings, and cooperative and condominium units that may be rented. Demand for apartments in New York City and nearby commuter markets remains strong, supported by employment, amenities, and transit. Second, upstate metros offer more modest rent levels and smaller buildings but often have stable renter demand anchored by universities, hospitals, and public employers. Third, new multifamily development has been active in selected markets where zoning and incentives allow, particularly around transit nodes and in revitalizing downtowns.
Investors in New York multifamily must account for the wide variation in regulatory frameworks, tenant protections, capital needs in older buildings, and local economic drivers. While this review cannot quote specific statewide average rents, cap rates, or vacancy rates for multifamily due to data access constraints, the importance of multifamily as a core asset class in New York is clear.
Section 06Rents
Residential rent levels and trends in New York are tracked by a combination of public and private sources. The United States Department of Housing and Urban Development publishes Fair Market Rents for metropolitan and nonmetropolitan areas in New York each fiscal year, based on American Community Survey data and other inputs. The current Fair Market Rent documentation system references fiscal year 2026 Fair Market Rents, effective May 21, 2026, and notes that these values were developed using 2023 American Community Survey one year data and 2019 through 2023 five year data, along with other updates. However, accessing specific Fair Market Rent dollar amounts for particular New York areas in this environment requires navigating query tools and downloading Microsoft Excel or comma separated values files, which are not rendered with usable numeric content in the extracted text. Therefore, this review cannot provide specific Fair Market Rent dollar figures for New York areas.
Private multifamily analytics providers such as RealPage, Yardi Matrix, and CoStar maintain series on effective rents, concessions, and asking rents for New York City, its suburbs, and upstate markets, but these are not publicly accessible without subscription and are thus not available for exact quotation here. What can be said qualitatively is that rent levels in New York City and nearby suburbs are among the highest in the nation, particularly in Manhattan and desirable neighborhoods in Brooklyn and Queens, while rent levels in upstate metros are considerably lower and more closely aligned with regional incomes.
National ownership indicators also inform expectations for rent pressure. As noted earlier, Redfin reports that the median sale price for all home types in the United States was 398,771 dollars in May 2026, up 2.0 percent from a year earlier, and that there were 1,483,839 homes for sale nationwide, up 0.7 percent year over year. With 24.9 percent of homes selling above list price in May 2026 and that share having declined only slightly, competition remains strong in many ownership markets, which tends to support rental demand where households are priced out of ownership.
For investors, the absence of precise statewide rent figures in this document underscores the need for property level rent roll analysis and for the use of current multifamily datasets when available. In practice, rent growth and achievable rent levels in New York are highly segmented by metro, neighborhood, building quality, and regulatory status, and they are influenced by both local incomes and broader macro conditions.
Section 07Vacancy
Vacancy in New York varies widely by asset type and geography. Multifamily rental vacancy in high demand parts of New York City tends to be low, especially in well located, competitively priced buildings, while weaker locations and older or mismanaged properties can see higher vacancy. Upstate metros may have higher baseline vacancy, reflecting different supply and demand balances and economic histories.
At the statewide level, publicly available, up to date vacancy series that aggregate rental vacancy across all geographies and asset classes in New York are not easily accessed in this environment. Census Bureau rental vacancy rate series for New York, which would normally offer a quarterly measure, require use of interactive tools or application programming interfaces that are not available here. Private datasets from CoStar, RealPage, and Yardi Matrix that report market vacancy and absorption for specific metros are similarly inaccessible for precise numeric reporting.
Commercial vacancy metrics for office, industrial, and retail properties in New York are primarily produced by private research firms and brokerages and are not published as comprehensive statewide time series by federal agencies. There is therefore no single public, quantitative statewide vacancy statistic that can be quoted in this review for commercial real estate.
Qualitatively, office vacancy is elevated in parts of New York City and in some suburban office campuses, driven by remote and hybrid work trends. Industrial vacancy, particularly for modern logistics space near major transportation nodes, is generally lower, reflecting sustained distribution demand. Retail vacancy shows a split between well located grocery anchored and prime high street locations, which remain relatively resilient, and weaker centers and secondary corridors, which face higher vacancy.
For investors, this distribution of vacancy underscores the need to drill down to submarket and asset level metrics when assessing occupancy risk and to recognize that statewide averages can mask very different realities.
Section 08Supply Pipeline
The supply pipeline for New York housing and commercial space is reflected in building permit statistics from the United States Census Bureau and in local planning and permitting data for municipalities across the state. The Census Bureau Building Permits Survey reports residential permits by state and metropolitan area, but accessing New York specific unit counts and trends in this environment requires either downloading large data files or using interactive query tools, which are not rendered with usable numeric content in the extracted text. As a result, this review cannot provide precise recent annual counts of authorized housing units or square footage of nonresidential permits for New York.
Qualitatively, new multifamily construction has been significant in New York City, especially in rezoned waterfront and transit oriented corridors in Brooklyn and Queens, around large redevelopment districts in Manhattan, and in parts of the Bronx and Staten Island. Downstate suburbs have seen more limited but notable multifamily projects, often near commuter rail stations or town centers. Upstate metros such as Buffalo, Rochester, Syracuse, Albany, and others have engaged in downtown revitalization and infill multifamily development, but overall volumes remain modest relative to downstate.
Single family construction remains more limited in many built out suburban areas but continues in exurban counties and in selected upstate regions, subject to land availability and demand. On the commercial side, industrial and logistics development has been active in downstate counties around major distribution hubs and in upstate markets linked to logistics corridors, while new office construction has been more selective.
For investors, the key takeaway is that New York supply pipeline is heavily regulated and regionally differentiated. Entitlement, zoning, environmental review, and community engagement processes shape what can be built and where. Limited greenfield land in many downstate areas, combined with community resistance to density and concerns about infrastructure and climate risk, constrain supply and support existing asset values, but they also make ground up development complex and time consuming.
Section 09Single Family Homes
Single family housing in New York ranges from attached row houses and small homes in dense city neighborhoods, to detached homes in inner and outer suburbs, to rural and small town properties upstate. Ownership patterns and price levels vary sharply, with very high home values in Manhattan, parts of Brooklyn and Queens, and affluent suburbs such as Westchester, Nassau, and Suffolk counties, and lower price points in many upstate communities.
State specific measures of median home value, typical prices, inventory, and months of supply for New York would ordinarily be drawn from public datasets provided by Zillow, Redfin, and other sources. In this environment, attempts to access New York specific state level pages from some providers via automated tools either return unsuitable content, encounter technical blocks, or result in truncated large files that cannot be reliably parsed. As a result, this review cannot state the current statewide median sale price for New York, the precise year over year price change, or the statewide months of supply with numeric precision.
National context, however, is available. As noted earlier, Redfin reports that for the United States as a whole, the median sale price for all home types was 398,771 dollars in May 2026, up 2.0 percent year over year, based on multiple listing service and public record data. There were 1,483,839 homes for sale in May 2026 nationwide, up 0.7 percent from a year earlier, and 24.9 percent of homes sold above list price, a modest decline of 0.083 percentage points from May 2025. These figures describe a national market where prices continue to rise modestly and where competition remains present, though bidding intensity has eased somewhat.
New York single family market sits above these national median price levels in many downstate areas and around key upstate employment centers, while some rural and ex industrial communities remain more affordable. Investor strategies in single family homes in New York include traditional owner occupant resale, renovation focused strategies in gentrifying neighborhoods, and single family rental portfolios targeting workforce tenants in stable communities. The limited availability of precise statewide statistics in this report means that investors must rely on current local data sources when quantifying price levels and dynamics, but the structural reality of high demand and constrained supply in many parts of New York is clear.
Section 10Commercial Real Estate and Retail Centers
Commercial real estate in New York encompasses some of the most prominent office, retail, and industrial markets in the world, particularly in New York City, as well as smaller but important office and industrial nodes in suburbs and upstate metros. Public agencies do not publish a comprehensive, up to date, quantitative statewide dataset on office, industrial, and retail vacancy, rents, and capitalization rates. These metrics are primarily available through private research platforms such as CoStar and through brokerage research reports, which are not publicly accessible in a way that allows precise quotation here.
Qualitatively, office markets in New York City have adjusted to hybrid work. Prime Class A towers with modern amenities and strong locations maintain relatively better occupancy and rent performance, while older commodity office buildings face higher vacancy, rent pressure, and potential obsolescence. Suburban office markets show a similar split between well located campuses that have adapted and weaker properties that may be candidates for alternative uses.
Industrial and logistics properties in downstate New York benefit from proximity to one of the largest consumer bases in the nation, from access to ports and airports, and from dense transportation networks. Vacancy in modern logistics facilities is generally low, and demand for last mile and near last mile facilities remains strong. Upstate, industrial space supports manufacturing, food processing, logistics, and warehousing, with performance dependent on local economic conditions and supply.
Retail centers in New York include high street corridors, neighborhood and community shopping centers, regional malls, and lifestyle centers. Grocery anchored neighborhood centers and necessity based retail nodes have demonstrated resilience, while some regional malls and weaker strip centers struggle with vacancy and tenant churn. In New York City, prime retail corridors attract luxury and flagship tenants, though rents and occupancies have adjusted in response to changing consumer behavior and tourism patterns.
Without precise statewide commercial real estate statistics in this report, investors must draw on specific market data when evaluating opportunities. However, the underlying drivers of demand, including population density, income, tourism, and logistics needs, support continued relevance for well positioned commercial assets.
Section 11Transactions and Capital Markets
Transaction activity and capital flows into New York real estate are documented through county property records, brokerage deal databases, and private analytics platforms such as CoStar and other transaction services. These sources track transaction volumes, pricing, capitalization rates, and cross border capital flows. There is no single public federal dataset that aggregates all commercial and multifamily transactions in New York with the granularity needed for this review, and private datasets are not accessible here for numeric quotation. Therefore, this section cannot provide specific figures for annual transaction volumes or average cap rates by asset class for New York.
Qualitatively, New York remains a major destination for domestic and international capital, particularly in core Manhattan office, multifamily, and mixed use properties, as well as in select suburban and upstate assets. Recent years have seen recalibration in office pricing and cap rates in response to remote work and higher interest rates, while multifamily and industrial assets have attracted significant investor interest, subject to the constraints of rent regulation and local market fundamentals.
Capital sources include domestic institutional investors, foreign sovereign and pension capital, private equity funds, family offices, and individual high net worth investors. Financing is provided by banks, life insurance companies, debt funds, and capital markets instruments. Higher interest rates in the mid two thousand twenties have led to tighter underwriting standards, lower loan to value ratios, and increased scrutiny of income stability.
Investors evaluating New York transactions today must be sensitive to bid ask spreads, lender appetites, and regulatory overlays, particularly in rent regulated multifamily and in office properties facing uncertain future demand.
Section 12Taxes
Taxation is a central consideration for real estate investment in New York. Property taxes are levied at the local level by counties, cities, towns, and school districts, based on assessed values and jurisdiction specific tax rates. Statewide, there is no single, current, authoritative public statistic on average effective property tax rates by property type that can be quoted in this report, because such data are aggregated and published by a mix of state and private sources that are not directly accessible here in a way that yields numeric values.
New York also imposes state personal income taxes and corporate income taxes, with additional local personal income taxes in New York City and Yonkers. Real estate transactions may be subject to state and local transfer taxes, and high value residential transactions in New York City may incur mansion taxes. Exact statutory rates, thresholds, and brackets are specified by state law and administrative guidance from the New York State Department of Taxation and Finance, but this review does not restate them numerically under the current constraints.
From an investor standpoint, property taxes often represent one of the largest ongoing operating expenses, and they vary significantly by location within the state. High property tax burdens in some suburban and upstate jurisdictions can influence investor returns and tenant affordability. At the same time, some development projects may benefit from abatements, exemptions, or payment in lieu of taxes agreements, which can materially affect cash flows. While specific effective tax rates cannot be provided here, careful property level tax analysis is essential for any New York investment.
Section 13Insurance
Insurance coverage for New York real estate is regulated by the New York State Department of Financial Services and delivered by private insurers and reinsurers. Property owners commonly maintain coverage for perils such as fire, wind, hail, and liability, with additional specialized coverage as needed.
Climate and hazard profiles vary across the state. Coastal areas, including New York City, Long Island, and parts of the Hudson Valley, face risks from coastal storms, storm surge, sea level rise, and tidal flooding. Inland areas encounter risks from riverine flooding, heavy precipitation events, snow and ice storms, and in some cases severe thunderstorms. Federal Emergency Management Agency flood insurance rate maps designate special flood hazard areas where flood insurance requirements apply for many mortgaged properties.
Public datasets that provide detailed premium levels and loss ratios for New York by county and peril are maintained by regulators and industry bodies, but these are not accessible in this environment for precise numeric quotation. However, broader national and regional patterns show that insurance costs in many coastal and climate exposed areas have risen in recent years, with some insurers adjusting underwriting standards or reducing exposure.
Investors in New York must therefore examine property specific risk factors, including flood zone status, elevation, building construction, and proximity to hazards, and they should anticipate that insurance costs may increase over holding periods. Risk mitigation measures, such as improved drainage, flood barriers, resilient building materials, and upgraded mechanical systems, can influence both insurance pricing and asset resilience.
Section 14Landlord Tenant and Regulatory Environment
New York landlord tenant and housing regulatory framework is among the most complex in the country, especially in New York City. State law and local ordinances govern residential and commercial leases, rent regulation, tenant protections, habitability standards, and eviction procedures.
In residential housing, New York maintains a large stock of rent stabilized and rent controlled units in New York City and certain surrounding areas, subject to detailed rules on allowable rent increases, lease renewals, and tenant protections. Legislative changes in recent years have strengthened tenant protections and limited some owner strategies for deregulating units or achieving higher rent levels. Unregulated market rate units exist alongside regulated stock, and many upstate and suburban markets have primarily unregulated housing that is closer in structure to other states.
In commercial real estate, leases are primarily governed by contract, with state law defining basic rights and remedies. Lease structures range from triple net to full service, and negotiation leverage depends on asset quality, tenant strength, and market conditions.
For investors, regulatory risk is not abstract in New York. Rent regulation in multifamily strongly shapes potential revenue growth and value creation strategies. Eviction procedures, tenant protections, and regulatory enforcement practices affect operating risk. Changes in short term rental rules, zoning, and land use policies can alter the economics of existing and planned assets. Investors must closely align legal, operational, and investment strategies with the current and evolving regulatory environment.
Section 15Infrastructure
Infrastructure underpins New York economic and real estate systems. Transportation infrastructure includes extensive subway and commuter rail systems, particularly in New York City and its suburbs, major highways and bridges, airports such as John F Kennedy International, LaGuardia, and Newark Liberty, as well as upstate interstates and regional airports. Ports and intermodal terminals support freight movement.
Water and wastewater infrastructure is critical in a state with dense urban centers and varied geography. New York City water system, upstate reservoirs, and numerous local utilities supply drinking water, while wastewater treatment plants and sewer networks manage sanitation. Some suburban and rural areas rely on wells and septic systems, which can constrain development capacity and require careful management.
Electricity and natural gas networks supply power to residential and commercial users, with grid reliability and capacity emerging as key considerations for new development and for electrification initiatives. Telecommunications infrastructure, including fiber networks and wireless coverage, is a decisive factor in supporting remote work, digital services, and modern businesses.
Public sources describe major infrastructure initiatives and funding programs, but detailed capacity and condition metrics for specific systems are beyond the scope of this report. For investors, the practical takeaway is that assets located in areas with strong transit access, reliable water and sewer capacity, robust power and broadband, and manageable congestion are better positioned to sustain demand and justify premium pricing, while infrastructure deficits can increase development costs and operational risk.
Section 16Climate and Physical Risks
New York faces a range of climate and physical risks that have direct implications for real estate. National Oceanic and Atmospheric Administration climate data and Federal Emergency Management Agency hazard maps identify the state as vulnerable to coastal storms, heavy precipitation, flooding, snow and ice events, heat waves, and in some regions wind and severe thunderstorms.
Coastal areas along the Atlantic Ocean and Long Island Sound, including New York City and Long Island, are exposed to storm surge and tidal flooding during hurricanes and nor easters. Sea level rise over coming decades is expected to increase the frequency and severity of flooding in some low lying neighborhoods and infrastructure nodes. Inland, rivers and streams in the Hudson Valley, Mohawk Valley, and other regions can overflow during heavy rains, while urban drainage systems may be overwhelmed during short duration but intense rainfall events.
Upstate regions experience significant snow and ice, with associated risks for roofs, power lines, transportation, and safety. Heat waves in urban areas exacerbate the urban heat island effect and can stress power grids and vulnerable populations.
While this review does not present quantitative risk scores or damage statistics, these patterns underscore the need for climate informed investment. Site selection should consider elevation, proximity to coasts and waterways, drainage, and existing protective infrastructure. Building design, including flood resilient construction, roof and facade resilience, mechanical system placement, and backup power, influences both damage risk and insurability. Over time, evolving climate policy, building codes, and disclosure requirements may further shape investment decisions.
Section 17Opportunities
New York offers a wide spectrum of real estate investment opportunities, reflecting its role as a global gateway and as a collection of regional economies. In multifamily, core opportunities remain in stabilized, well located properties in New York City and major suburbs, particularly those near transit and employment centers. Value add strategies can target older buildings that can benefit from capital improvements and operational enhancements, subject to regulatory constraints.
Upstate metros provide multifamily opportunities linked to universities, medical centers, and state government, often at lower entry prices and with higher nominal cap rates than downstate, though with different risk profiles. Workforce housing and affordable housing strategies can play important roles in meeting local needs and may benefit from public and quasi public financing tools.
Single family rental portfolios in suburban and exurban areas, as well as small multifamily and mixed use properties in neighborhood centers, offer another avenue for investors seeking income and appreciation. Neighborhood retail anchored by grocery and essential services, particularly in underserved or growing communities, can provide relatively stable cash flows.
Industrial and logistics properties near ports, airports, and intermodal hubs in both downstate and upstate New York stand to benefit from ongoing shifts in supply chains and e commerce. Modern, well located facilities with strong tenant covenants can form attractive long term holdings.
Given the limitations of numeric data in this report, investors must pair these opportunity themes with detailed external datasets and local insight when making specific allocations.
Section 18Risks
Alongside its opportunities, New York presents substantial risks for real estate investors. Regulatory risk is particularly salient, with rent regulation, tenant protections, land use controls, and tax policies all influencing returns. Changes in law or enforcement approaches can alter the economics of existing assets and proposed developments.
Climate risk is another central concern, especially for coastal and flood prone areas. Physical damage, insurance cost increases, and potential land use restrictions can all affect asset performance and values. Investors with concentrated exposure to high risk zones may face correlated losses in adverse scenarios.
Macroeconomic and industry specific risks also matter. Dependence on finance, media, and other cyclical industries in parts of New York City introduces exposure to global financial market conditions. Slow or negative population growth in some upstate areas can dampen demand, limit rent growth, and increase vacancy risk.
High operating costs, including property taxes, utilities, labor, and maintenance in older buildings, can pressure net operating income, particularly in rent regulated or low income housing segments. Infrastructure constraints, such as limited transit options or aging water and sewer systems, can impede development and increase costs.
Finally, data and transparency limitations, as highlighted by the restricted ability to access certain public datasets in this environment, can complicate analysis. Investors must proactively secure reliable, current data and avoid overreliance on incomplete or outdated figures.
Section 19Investor Implications
For accredited investors, New York real estate is best viewed as a complex, segmented market rather than as a monolithic asset class. Strategies should be tailored to specific regions, asset types, and regulatory regimes. In core downstate markets, investors may prioritize high quality multifamily, mixed use, and industrial assets that offer relative resilience, even at lower initial yields, while taking a careful approach to office exposure. Upstate, investors may pursue yield oriented strategies in multifamily and industrial assets tied to stable institutional anchors.
Across the state, conservative leverage, robust contingency planning for capital expenditures and insurance costs, and an emphasis on asset and location quality can help manage risk. Partnerships with experienced local operators and advisors are especially important in navigating regulatory processes, community dynamics, and submarket specific fundamentals.
Because this review cannot provide a full suite of numeric indicators under current technical constraints, investors should treat it as a framing document and supplement it with detailed property and market level data, including current population, income, pricing, rent, and vacancy statistics, before making any commitments.
Section 20Conclusion
New York remains a cornerstone of the United States real estate landscape, with a large and diverse economy, deep capital markets, and a wide range of housing and commercial property types. Bureau of Labor Statistics data for the first half of 2026 show a stable but slow growing labor market with about ten million people in the labor force, an unemployment rate of 4.6 percent, and total nonfarm employment near ten million jobs. Sector data highlight the importance of finance, professional services, education and health services, and trade and logistics in anchoring demand.
At the same time, constraints on accessing current Census, American Community Survey, and state level housing datasets in this environment mean that many specific numeric indicators for population, incomes, home prices, rents, and vacancy cannot be stated here. Under the strict sourcing rules adopted for this work, those gaps are acknowledged explicitly rather than filled by inference.
Within these limits, the structural picture is clear. New York offers durable demand in its core markets, substantial regulatory and climate related complexity, and meaningful variation in fundamentals across regions and asset classes. For accredited investors who combine disciplined analysis, appropriate risk management, and strong local insight, New York can contribute both diversification and potential return to a broader portfolio. However, success depends on recognizing that even a large and globally important state like New York does not guarantee uniform performance or straightforward investment outcomes.
Sources
- United States Bureau of Labor Statistics, New York Economy at a Glance, statewide civilian labor force, employment, unemployment, unemployment rate, and nonfarm employment by sector, monthly data January 2026 through June 2026, seasonally adjusted, data extracted August 7, 2026 ,, https://www.bls.gov/eag/eag.ny.htm
- United States Bureau of Labor Statistics, Local Area Unemployment Statistics, state and local unemployment and labor force measures for New York, various years ,, https://www.bls.gov/lau
- United States Bureau of Labor Statistics, Current Employment Statistics, statewide employment by industry for New York, various years ,, https://www.bls.gov/sae
- United States Bureau of Labor Statistics, Quarterly Census of Employment and Wages, employment and wages by industry for New York counties and metropolitan areas, various years ,, https://www.bls.gov/cew
- United States Census Bureau, Decennial Census of Population and Housing, state, county, and place level data for New York, various years ,, https://www.census.gov/programs-surveys/decennial-census.html
- United States Census Bureau, American Community Survey, one year and five year estimates of demographic, income, tenure, and housing characteristics for New York and its counties and metropolitan areas, various years ,, https://www.census.gov/programs-surveys/acs
- United States Census Bureau, Population and Housing Unit Estimates, annual estimates for New York statewide and for counties and metropolitan areas, various years ,, https://www.census.gov/programs-surveys/popest.html
- United States Census Bureau, Building Permits Survey, residential building permits for New York, various years ,, https://www.census.gov/construction/bps
- Bureau of Economic Analysis, State Personal Income, personal income and per capita personal income for New York statewide, various years ,, https://www.bea.gov/data/income-saving/personal-income-by-state
- Bureau of Economic Analysis, Gross Domestic Product by state, inflation adjusted and current dollar GDP for New York, various years ,, https://www.bea.gov/data/gdp/gdp-state
- United States Department of Housing and Urban Development, Fair Market Rents, documentation and data for fiscal year 2026 Fair Market Rents by area including New York metropolitan and nonmetropolitan areas ,, https://www.huduser.gov/portal/datasets/fmr.html
- Federal Housing Finance Agency, House Price Index, state level home price indices for New York, various years ,, https://www.fhfa.gov/DataTools/Downloads/Pages/House-Price-Index.aspx
- New York State Homes and Community Renewal, statewide housing programs, policies, and research, various years ,, https://hcr.ny.gov
- New York State Department of Taxation and Finance, property tax, real estate transfer tax, and personal and corporate income tax information for New York, various years ,, https://www.tax.ny.gov
- New York State Department of Financial Services, regulatory information on property and casualty insurance markets in New York, various years ,, https://www.dfs.ny.gov
- Federal Emergency Management Agency, Flood Map Service Center, flood insurance rate maps and special flood hazard area designations for New York jurisdictions, various years ,, https://msc.fema.gov
- Federal Emergency Management Agency, National Risk Index, hazard risk indicators for New York counties and communities, various years ,, https://hazards.fema.gov/nri
- National Oceanic and Atmospheric Administration, National Centers for Environmental Information, climate normals and historical weather data for New York regions and stations, various years ,, https://www.ncei.noaa.gov
- Redfin, United States Housing Market page, national median sale price, inventory, and share of homes sold above list price for May 2026, accessed August 7, 2026 ,, https://www.redfin.com/us-housing-market
- CoStar Group, commercial real estate analytics and transaction data for New York multifamily, office, industrial, and retail properties, various years ,, https://www.costar.com
- Yardi Matrix, multifamily market coverage and analytics for New York metropolitan and regional markets, various years ,, https://www.yardimatrix.com
- RealPage, multifamily analytics and rent trend data for New York markets, various years ,, https://www.realpage.com/analytics
- Zillow Research, housing and rent data for New York state and its metropolitan areas via home value and rental indices, various years ,, https://www.zillow.com/research/data