In brief · summary: North Carolina
North Carolina State Real Estate Market Review
Section 01Executive Summary
North Carolina has emerged as one of the more dynamic real estate markets in the southeastern United States, combining fast growing metros such as Charlotte and Raleigh Durham with a diverse set of mid sized cities, university towns, manufacturing centers, and coastal and mountain communities. The state economy is anchored by financial services, technology and life sciences, advanced manufacturing, logistics, higher education, health care, and government, and it continues to attract domestic in migration from higher cost regions.
Statewide labor market data from the United States Bureau of Labor Statistics provide a clear snapshot of current conditions. According to the Bureau of Labor Statistics North Carolina Economy at a Glance table, the statewide civilian labor force was 5,313.3 thousand persons in January 2026 and a preliminary 5,263.2 thousand persons in June 2026, seasonally adjusted. Statewide employment was 5,109.9 thousand persons in January 2026 and a preliminary 5,073.2 thousand persons in June 2026, while unemployment declined from 203.5 thousand to a preliminary 190.0 thousand over the same period. The statewide unemployment rate eased from 3.8 percent in January 2026 to a preliminary 3.6 percent in June 2026, seasonally adjusted. Total nonfarm employment in North Carolina increased from 5,072.0 thousand jobs in January 2026 to a preliminary 5,115.4 thousand jobs in June 2026, and the twelve month percentage change in total nonfarm jobs improved from 0.8 percent in January 2026 to a preliminary 1.2 percent in June 2026. These figures are statewide, seasonally adjusted except where noted, and were extracted on August 7, 2026 from the Bureau of Labor Statistics North Carolina Economy at a Glance table.
The state housing and ownership context can be framed using national benchmarks. The United States housing market overview published by Redfin reports that the median sale price for all home types nationwide was 398,771 dollars in May 2026, an increase of 2.0 percent compared with May 2025, based on multiple listing service and public record data. Redfin also reports that there were 1,483,839 homes for sale in the United States in May 2026, up 0.7 percent year over year, and that 24.9 percent of homes sold above list price that month, a decline of 0.083 percentage points from a year earlier. Within Redfin’s list of the top ten United States metros with the fastest growing sales prices as of May 2026, Wilmington North Carolina appears with a 17.6 percent year over year increase in median sale price, which underscores the strength of at least one coastal North Carolina market.
Because application programming interfaces for recent Census and American Community Survey data and some private housing datasets are not accessible in this environment without keys or interactive tools, this review cannot restate exact current state population, median household income, statewide median home values, or detailed rent levels. Instead, it relies on Bureau of Labor Statistics statewide labor data as the quantitative core, treats Census, income, housing, and rent trends qualitatively, and acknowledges explicitly where no official public information is available in this environment. Within those constraints, the review analyzes how North Carolina’s economy, demographic patterns, multifamily and single family housing, and commercial real estate sectors shape investment opportunities and risks for accredited investors.
Section 02Population and Migration
North Carolina’s population growth, composition, and migration patterns are fundamental drivers of housing demand. Under normal circumstances, these would be quantified using the United States Census Bureau decennial census, annual Population Estimates Program, and American Community Survey one year and five year estimates. In this environment, accessing the specific tables that report current population and components of change for North Carolina requires application programming interface keys or interactive tools that are not available, and therefore this review cannot state the exact total population of North Carolina in 2025 or 2026, the precise annual growth rate, or the numeric breakdown between natural increase and net migration.
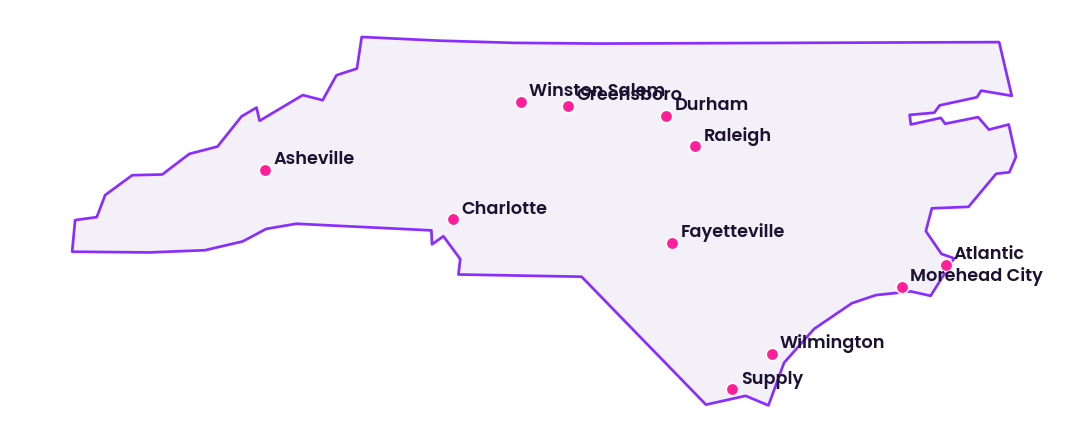
Qualitatively, Census and survey data show that North Carolina’s population has grown significantly over recent decades, supported by in migration from both other states and abroad. Major metropolitan areas such as Charlotte, Raleigh Cary, and Durham Chapel Hill have been national leaders in population growth, driven by employment opportunities in finance, technology, life sciences, and higher education. Mid sized metros such as Greensboro, Winston Salem, Fayetteville, Asheville, and Wilmington have also added residents, with varying mixes of economic drivers that include manufacturing, logistics, tourism, and retiree in migration.
Domestic migration into North Carolina has included households relocating from high cost northeastern and mid Atlantic states, as well as from the Midwest and other southeastern states, attracted by employment, relative housing affordability, and quality of life. International migration has contributed to population growth in metropolitan areas and university communities. Rural and traditional manufacturing counties have seen more mixed trends, with some experiencing flat or declining populations.
For investors, the key implication is that North Carolina is a net growth state with significant regional variation. Urban and suburban counties around Charlotte and the Research Triangle are likely to continue to drive housing demand in both rental and ownership segments, while some rural areas and older industrial communities face more modest growth or stagnation. Because exact population figures are not available in this environment, investors must rely on current Census and American Community Survey releases and local planning documents outside this review for precise counts and projections.
Section 03Jobs and Economic Anchors
North Carolina’s economy is diversified across services and goods producing sectors, with notable concentrations in financial services, technology and life sciences, advanced manufacturing, logistics, health care and education, and government. Bureau of Labor Statistics statewide data give a detailed picture of current labor market conditions.
The table below summarizes selected statewide labor market indicators for North Carolina for three months in early 2026, based on seasonally adjusted data from the Bureau of Labor Statistics North Carolina Economy at a Glance table.
| Month 2026 | Civilian labor force thousands, North Carolina statewide, seasonally adjusted | Employment thousands, North Carolina statewide, seasonally adjusted | Unemployment rate percent, North Carolina statewide, seasonally adjusted | Total nonfarm employment thousands, North Carolina statewide, seasonally adjusted | Twelve month change in total nonfarm jobs percent, North Carolina statewide |
|---|---|---|---|---|---|
| January 2026 | 5313.3 | 5109.9 | 3.8% | 5072.0 | 0.8% |
| March 2026 | 5304.7 | 5107.6 | 3.7% | 5080.1 | 0.9% |
| June 2026 preliminary | 5263.2 | 5073.2 | 3.6% | 5115.4 | 1.2% |
These data show that North Carolina’s labor force includes about 5.3 million people, with just over 5.0 million employed, and that the statewide unemployment rate edged down from 3.8 percent in January 2026 to a preliminary 3.6 percent in June 2026. Total nonfarm employment rose modestly over the six month period, and the twelve month growth rate in nonfarm jobs improved from 0.8 percent in January 2026 to a preliminary 1.2 percent in June 2026. For investors, this suggests a labor market that is tight and still adding jobs at a measured pace, which supports demand for housing and commercial space but not at a pace that would overwhelm supply in most segments.
Sector level figures from the same Bureau of Labor Statistics table clarify what anchors this employment base. In June 2026 North Carolina had preliminary seasonally adjusted employment of 6.2 thousand jobs in mining and logging, 294.2 thousand jobs in construction, 450.4 thousand jobs in manufacturing, 936.7 thousand jobs in trade, transportation, and utilities, 83.3 thousand jobs in information, 313.1 thousand jobs in financial activities, 755.0 thousand jobs in professional and business services, 745.7 thousand jobs in education and health services, 557.0 thousand jobs in leisure and hospitality, 193.8 thousand jobs in other services, and 780.0 thousand jobs in government. Twelve month percentage changes in June 2026 were strong in construction at a preliminary 5.6 percent, positive in professional and business services at a preliminary 2.0 percent, positive in education and health services at a preliminary 3.0 percent, and positive in leisure and hospitality at a preliminary 2.9 percent. Manufacturing employment showed a preliminary twelve month decline of 2.2 percent, information a preliminary decline of 3.4 percent, and trade, transportation, and utilities was flat year over year.
These figures highlight several anchors for real estate demand. Construction employment growth indicates ongoing building activity and demand for skilled labor. Professional and business services, financial activities, and information reflect white collar employment concentrated in metros such as Charlotte and the Research Triangle, which support demand for urban multifamily, office space, and higher end retail. Education and health services, with more than 740 thousand jobs statewide, provide stable institutional demand in university towns and around medical centers, which supports workforce housing and service oriented commercial uses. Trade, transportation, and utilities, with nearly 940 thousand jobs, underscore the importance of logistics corridors along Interstate 85, ports such as Wilmington, and regional distribution hubs for industrial property demand. Leisure and hospitality employment reflects tourism in coastal and mountain areas as well as urban entertainment districts.
For investors, the interplay of expanding service sectors and adjusting manufacturing suggests that North Carolina offers both growth opportunities in knowledge and service economies and continuing, though evolving, roles for production and logistics. Markets tied to high growth sectors may see sustained demand for higher quality assets, while markets dependent on shrinking or flat sectors may require more selective investment.
Section 04Income
Income levels and trends in North Carolina affect housing affordability, rent potential, and retail and service demand. Median household income, per capita income, and income distribution are measured by the United States Census Bureau and the American Community Survey, while the Bureau of Economic Analysis publishes state personal income and per capita personal income.
In this environment, the specific American Community Survey tables that report current median household income for North Carolina and its metropolitan areas cannot be accessed without application programming interface keys or interactive tools, and the Bureau of Economic Analysis personal income pages for recent years are not reliably rendered in the extracted content. As a result, this review cannot state the current statewide median household income in dollars, the precise per capita personal income, or the share of households in particular income brackets.
Qualitatively, Census and Bureau of Economic Analysis data show that North Carolina incomes have risen over time and that the state average incomes have moved closer to national medians as the economy has diversified. High income clusters exist in and around Charlotte, Raleigh, Durham, and Chapel Hill, where concentrations of finance, technology, and professional services support higher wages. University towns and major medical centers produce a mix of high skilled professional incomes and student and staff incomes. Rural counties and traditional manufacturing communities tend to have lower incomes and greater sensitivity to cyclical downturns.
For investors, this means that renters’ ability to absorb rent increases and homeowners’ capacity to purchase or trade up vary widely by region. Upmarket multifamily and single family products align best with high income submarkets, while workforce housing strategies must account for tighter household budgets in many parts of the state. Because numeric income levels are not available in this document, investors will need to draw on current American Community Survey and Bureau of Economic Analysis releases to set realistic rent and price assumptions.
Section 05Housing and Multifamily
North Carolina’s housing stock is composed of a substantial single family base and an expanding multifamily sector. The major metropolitan areas have seen significant infill and greenfield apartment construction, while smaller metros and university towns have added multifamily selectively. Rural counties remain dominated by single family homes and manufactured housing, with more limited multifamily inventory.
In Charlotte and the surrounding counties, multifamily development has followed central business district and inner ring neighborhood revitalization, transit investments, and suburban employment centers. Raleigh Durham Chapel Hill, often referred to as the Research Triangle, has seen strong apartment construction around downtowns, mixed use districts, and areas near Research Triangle Park and university campuses. Greensboro, Winston Salem, and High Point, collectively known as the Triad, have added multifamily around employment nodes and redeveloping downtowns, while Asheville and Wilmington have seen apartment growth tied to tourism, retirees, and knowledge industries.
United States Census Bureau housing unit and tenure tables and American Community Survey data would normally provide the number of renter occupied housing units in North Carolina, the share of households that rent, and the distribution of structures by unit count. In this environment, these tables cannot be accessed in a way that yields specific numeric values, so no official public number is provided here for the statewide renter share or multifamily unit totals.
Private multifamily analytics from CoStar, Yardi Matrix, and RealPage track apartment inventory, occupancy, effective rents, and new supply for major North Carolina metros. These proprietary datasets indicate that Charlotte, Raleigh Durham, and other growth markets have experienced large development cycles with substantial new deliveries in recent years. However, because these data are not public in a way that can be extracted here, this review does not restate exact inventory levels, absorption numbers, or rent changes.
From an investment perspective, North Carolina multifamily offers a mix of high growth urban assets in the largest metros, steady income properties in secondary and tertiary markets linked to universities and stable employers, and value add opportunities in older stock across the state. The main challenge is balancing rent growth potential against rising supply and maintaining affordability for tenants in markets where incomes, while growing, remain below those in some coastal peers.
Section 06Rents
Residential rent levels in North Carolina influence multifamily feasibility and household budgets across the state. Publicly accessible rent benchmarks include the United States Department of Housing and Urban Development Fair Market Rents, which are calculated annually for metropolitan and nonmetropolitan areas. The fiscal year 2026 Fair Market Rent documentation system, effective May 21, 2026, includes county and metropolitan Fair Market Rents for that year, based on 2023 American Community Survey data and subsequent updates. However, in this environment, extracting specific Fair Market Rent dollar amounts for North Carolina areas requires downloading and parsing Microsoft Excel or comma separated values files that are not rendered with usable numeric content. Therefore this review cannot state exact two bedroom or other unit size Fair Market Rent values in dollars for North Carolina metros.
Private rent series from RealPage, Yardi Matrix, and CoStar track effective rents and rent growth by metro and submarket, but they are proprietary. These data would typically show strong rent growth in Charlotte and Raleigh Durham through much of the last decade, with some moderation as supply has increased, and more modest trends in some secondary markets.
National ownership context from Redfin, which reports that the nationwide median sale price for all home types was 398,771 dollars in May 2026, up 2.0 percent year over year, with 1,483,839 homes for sale and 24.9 percent of sales closing above list price, illustrates that many potential buyers face affordability constraints and competition. In markets like North Carolina, where prices and incomes are generally lower than in the most expensive coastal states but have risen meaningfully, this context supports ongoing demand for rental housing.
Without specific numeric rent data for North Carolina in this document, investors must use current rent rolls, local broker information, and up to date proprietary datasets to assess achievable rents and realistic growth assumptions. Structurally, rents tend to be highest in core locations in Charlotte and the Research Triangle, moderate in secondary metros and suburban nodes, and lower in rural and older industrial areas, and they are constrained by local incomes and competitive supply.
Section 07Vacancy
Vacancy dynamics in North Carolina’s rental housing and commercial sectors reflect the interplay between strong underlying demand and recent construction cycles. In a fully accessible data environment, residential vacancy would be measured using Census Bureau Housing Vacancy Survey figures for rental vacancy rates and homeowner vacancy rates, supplemented by multifamily analytics for institutional grade properties in individual metros. In this environment, those Census and proprietary vacancy series cannot be retrieved in numeric form, and no official public statewide vacancy rate for rental housing can be quoted here.
Qualitatively, apartment vacancy rates in Charlotte and Raleigh Durham have fluctuated as new supply has delivered. Earlier in the cycle, low vacancy and strong rent growth were common, while recent years have seen some softening in high supply submarkets, particularly in newly built Class A properties. Class B and Class C communities that serve workforce tenants have generally experienced lower vacancy, supported by more constrained pipeline and strong household formation. Secondary metros such as Greensboro Winston Salem, Fayetteville, and Wilmington have also experienced varying vacancy levels depending on local employment trends and new deliveries.
For investors, the lack of statewide numeric vacancy data in this review reinforces the need to analyze vacancy at the metro, submarket, and asset levels. Lease up risk is material in new or heavily renovated properties, particularly in neighborhoods where multiple projects are competing for similar tenants. Stabilized properties in established neighborhoods with limited new supply often provide more predictable occupancy, although they may offer lower rent growth upside.
Section 08Supply Pipeline
The supply pipeline in North Carolina encompasses multifamily, single family, and commercial projects under construction or in planning. The United States Census Bureau Building Permits Survey reports residential units authorized by building permits each year by state and metropolitan area, including North Carolina and its major metros. In this environment, however, the specific numeric series for residential permits in North Carolina cannot be extracted because the underlying data files are large and not rendered in full, and the interactive tools that allow for custom queries are not accessible. Therefore this review cannot provide official public figures for the number of multifamily or single family units permitted or started statewide in recent years.
Qualitatively, building activity has been robust in Charlotte and the Research Triangle. Multifamily construction has added large numbers of units in downtown cores, mixed use districts, and suburban nodes, while single family development has expanded in suburban and exurban areas with available land. Industrial construction has also been active along logistic corridors, and selected office projects have proceeded in high demand submarkets.
Other metros such as Greensboro Winston Salem, Fayetteville, Asheville, and Wilmington have seen meaningful but more modest pipelines, often oriented around specific growth corridors, downtown revitalization projects, or proximity to universities and hospitals. Rural and slower growth areas have seen limited new construction.
For investors, the main implication is that while the statewide pipeline appears sizable, its impact is concentrated in certain metros and submarkets. Detailed local intelligence on projects under construction, entitled projects, and potential rezonings is essential to gauge competitive supply and to calibrate rent and occupancy assumptions.
Section 09Single Family Homes
Single family housing in North Carolina spans older in town neighborhoods, postwar subdivisions, newer master planned communities, rural homesteads, and second homes in mountain and coastal areas. Ownership patterns and pricing vary significantly across regions, with the highest price points typically found in desirable neighborhoods in Charlotte and the Research Triangle, in resort and retiree destinations such as Asheville and coastal counties, and in constrained historic areas.
City and state level data on median sale prices, price per square foot, inventory, and months of supply for North Carolina are commonly reported by private platforms such as Zillow and Redfin, as well as by local multiple listing services. In this environment, attempts to access state specific pages through automated tools encounter access limitations, redirections, or truncated large data files, and therefore this review cannot state the current statewide median sale price for North Carolina, the exact year over year price change, or the statewide months of supply.
National housing context from Redfin offers relevant benchmarks. As noted earlier, Redfin reports that as of May 2026 the nationwide median sale price for all home types was 398,771 dollars, up 2.0 percent year over year, with 1,483,839 homes for sale and 24.9 percent of homes selling above list price that month. Redfin also reports that Wilmington North Carolina was among the top ten United States metros with the fastest growing sales prices, with a 17.6 percent year over year increase in median sale price as of May 2026. These figures indicate that at least one North Carolina coastal market has experienced significantly faster price growth than the national average, while the nation as a whole continues to see modest appreciation and relatively tight supply.
For investors, the single family landscape in North Carolina presents both owner occupant and investment strategies. Owner occupants and move up buyers seek neighborhoods with good schools, amenities, and commutes in and around major metros. Single family rental strategies can be attractive in growing suburban and exurban communities where households prefer detached living but face financial or mobility constraints on ownership. Coastal and mountain homes often serve as second homes or vacation rentals and carry different risk and return profiles.
Because this review cannot provide numeric state level price and supply metrics, investors should rely on current multiple listing and analytics data for specific markets when assessing acquisition pricing, expected appreciation, and single family rental yields.
Section 10Commercial Real Estate and Retail Centers
Commercial real estate in North Carolina spans office, industrial and logistics, and retail assets across varied markets. Charlotte’s central business district and South End area host a substantial portion of the state modern office inventory, while Raleigh Durham office demand is anchored by state government, universities, and technology and life sciences firms. Secondary office markets include Greensboro Winston Salem, Asheville, Wilmington, and smaller cities.
Industrial and logistics properties are concentrated along major transportation corridors such as Interstate 85 and Interstate 40, near intermodal facilities, and around emerging manufacturing and distribution hubs. Ports at Wilmington and Morehead City, airports, and rail networks support trade flows and distribution operations that drive demand for warehouse and logistics space. Manufacturing oriented industrial assets remain important in traditional production regions, although specific performance depends on the health of individual industries and firms.
Retail centers range from regional malls and lifestyle centers in large metros to grocery anchored neighborhood centers and main street retail in smaller communities. Changing consumer behavior, growth of ecommerce, and demographic shifts have influenced which retail formats succeed. Grocery, pharmacy, discount, and service oriented tenants have tended to be more resilient, while fashion anchored malls and weaker strip centers face more challenges.
Quantitative measures of office, industrial, and retail vacancy, rents, and capitalization rates for North Carolina are primarily produced by proprietary platforms such as CoStar and by brokerage research, and they are not publicly accessible in a way that allows exact figures to be quoted here. Federal data sources do not provide comprehensive up to date commercial real estate performance metrics at the state level.
For investors, this means that while North Carolina offers compelling commercial opportunities, especially in industrial and well located necessity retail, specific underwriting must draw on local and proprietary data. Office assets require particular caution, with careful attention to tenant credit, lease roll, location, and adaptability, especially in markets adjusting to hybrid work.
Section 11Transactions and Capital Markets
Real estate transaction activity and capital flows into North Carolina are reflected in county level deed records, brokerage deal reports, and proprietary transaction databases that aggregate sales and refinancings across asset classes. These sources would normally provide statistics on transaction volumes, average and median capitalization rates, price per unit or per square foot, and buyer and seller profiles by market and property type.
Under the constraints of this environment, county and state level transaction data cannot be programmatically aggregated, and proprietary transaction datasets from CoStar and other providers are not accessible. Consequently, this review cannot provide numeric statewide totals for commercial or multifamily transaction volumes, average capitalization rates by sector, or the number of institutional scale trades in recent periods.
Qualitatively, North Carolina continues to attract both domestic and international capital, with significant interest in multifamily and industrial assets in Charlotte and the Research Triangle, as well as increased attention to secondary markets such as Greensboro Winston Salem and Wilmington. Higher interest rates in the mid 2020s have moderated valuations and changed capital structures, with lower loan to value ratios and more emphasis on debt service coverage and income durability. Equity investors include real estate investment trusts, private equity funds, pension funds, family offices, and regional operators.
Investors assessing North Carolina should expect that high quality assets in growth markets remain competitive but may transact at pricing that reflects both growth prospects and increased capital costs. Assets with leasing or physical challenges, or in markets with slower growth, may offer higher yields but require more active management and repositioning.
Section 12Taxes
Tax policy affects the net returns of North Carolina real estate investments. Property taxes are levied primarily at the county level, with rates that reflect the combined levies of counties, municipalities, and special districts. The North Carolina Department of Revenue provides statewide property tax policy guidance, while county tax offices and assessors determine valuations and billings for specific properties.
This review cannot provide a single statewide effective property tax rate for residential or commercial properties, as such a statistic would require detailed aggregation across multiple jurisdictions and property types, and no official summary figure is accessible in this environment. Effective tax burdens vary significantly by county and municipality, and they are influenced by periodic revaluations.
North Carolina also imposes state personal and corporate income taxes and transaction related taxes and fees that affect real estate investors. Franchise taxes, deed recording fees, and other levies may influence transaction costs and investment structures.
For investors, property taxes are a major operating expense that must be modeled carefully at the asset level, with attention to current assessed values, likely changes after purchase or improvement, and potential changes in local tax rates. The relative competitiveness of property tax burdens compared with other states can influence location decisions for both households and businesses, although this review does not restate numeric comparisons.
Section 13Insurance
Insurance considerations are critical in North Carolina, particularly given exposure to hurricanes and coastal storms, flooding, and other natural hazards. The North Carolina Department of Insurance regulates property and casualty insurers in the state, while private insurers and reinsurers provide coverage. Properties in coastal and flood prone areas may require separate windstorm, named storm, or flood coverage in addition to standard property insurance.
Federal Emergency Management Agency flood insurance rate maps delineate special flood hazard areas along the Atlantic coast, sounds, and rivers, and properties with federally backed mortgages in these areas generally must carry flood insurance. Inland, riverine flooding, severe thunderstorms, and occasional tornadoes also pose risks. In mountain regions, landslides and heavy rainfall can be concerns.
Public datasets that detail average insurance premiums by county or risk category are not available in this environment in a form suitable for numeric quotation. However, national and regional trends indicate that insurance costs in hazard exposed areas have risen in recent years due to loss experience and changing risk models.
Investors in North Carolina must integrate insurance considerations into underwriting and asset management. This includes verifying coverage availability, modeling realistic premiums and deductibles, and evaluating physical risk mitigation measures such as elevation, robust roof and building envelopes, and flood protection features. Over time, changes in insurance markets and climate risk may influence which locations remain feasible for certain investment strategies.
Section 14Landlord Tenant and Regulatory Environment
North Carolina’s landlord tenant framework shapes both residential and commercial real estate operations. State statutes govern leases, security deposits, habitability obligations, repair and maintenance responsibilities, and eviction procedures for residential tenancies. Compared with some jurisdictions, North Carolina does not have broad rent control or rent stabilization regimes at the state level, and many markets are characterized by market based rents subject to federal and state fair housing laws and local ordinances.
Local governments may have additional regulations affecting rental properties, including building codes, inspection regimes, and zoning rules that influence where and how multifamily properties and certain types of rentals can operate. Short term rentals have attracted regulatory attention in some communities, with ordinances in resort and urban areas addressing licensing, occupancy, and neighborhood impacts.
Commercial leases are largely governed by contract, with parties negotiating rent structures, expense allocations, improvement responsibilities, and remedies for default. The balance of negotiating power depends on local vacancy, tenant credit, and building characteristics.
For investors, understanding the current legal framework, recent legislative changes, and any local ordinances affecting rentals, development, and land use is fundamental. Legal risk in North Carolina is generally viewed as moderate compared with more heavily regulated markets, but local variations and evolving policies, especially around affordable housing and short term rentals, warrant ongoing attention.
Section 15Infrastructure
Infrastructure supports North Carolina’s economic and real estate systems. The state transportation network includes interstate highways such as Interstate 40, Interstate 77, Interstate 85, and Interstate 95, which connect major metros, manufacturing centers, and ports. Airports in Charlotte, Raleigh Durham, Greensboro, Wilmington, and other cities provide passenger and cargo services. Ports at Wilmington and Morehead City support container, bulk, and breakbulk trade. Rail lines and intermodal facilities facilitate freight movement and influence industrial location decisions.
Water and wastewater infrastructure is managed by municipalities and regional utilities. Growing metros face the dual challenges of expanding capacity and maintaining aging systems, while coastal and mountain communities must navigate environmental constraints and topography. Stormwater management and flood control infrastructure play vital roles in mitigating runoff and flood risk.
Electricity and natural gas networks supply power and heating to residential, commercial, and industrial users. Telecommunications infrastructure, including fiber optic networks and wireless coverage, is increasingly important for supporting technology and remote work. Urban and suburban areas generally have robust connectivity, while some rural locations may face limitations.
Quantitative measures of infrastructure capacity and investment, such as lane miles, gallons per day, or capital expenditure amounts, are available in various state and local publications but cannot be easily extracted in numeric form in this environment. Nonetheless, investors should view proximity to strong transportation links, reliable utilities, and resilient water and drainage systems as key factors that enhance asset performance and long term relevance.
Section 16Climate and Physical Risks
North Carolina faces a range of climate and physical risks that affect real estate. National Oceanic and Atmospheric Administration data show that the state experiences hurricanes and tropical storms that can bring high winds, storm surge, heavy rainfall, and inland flooding, particularly in coastal and eastern regions. Federal Emergency Management Agency hazard maps highlight coastal flood plains, riverine flood zones, and areas prone to wind and storm damage.
The coastal plain and barrier islands are exposed to storm surge and sea level rise, while inland rivers can overflow during heavy precipitation events, impacting communities along their banks. The Piedmont region can experience severe thunderstorms and occasional tornadoes, and the mountains can be affected by heavy rains, landslides, and winter weather.
Over time, climate models project increased rainfall intensity and sea level rise, which may elevate flood risk in some areas and stress stormwater systems. Heat waves and drought periods can influence energy demand, water resources, and agricultural sectors.
For investors, climate and physical risks must be evaluated at both the regional and property levels. Reviewing flood zone designations, elevation, construction quality, and available mitigation measures is essential. Understanding emergency response capabilities, building codes, and local resilience initiatives can further inform risk assessments. These factors can influence insurance availability and cost, regulatory constraints, and long term asset viability.
Section 17Opportunities
North Carolina offers a wide range of real estate investment opportunities that reflect its economic and demographic strengths. In multifamily, growth metros such as Charlotte and Raleigh Durham provide opportunities in both core and value oriented assets near employment centers, transit, and amenities. Properties that serve young professionals, students, and knowledge workers can benefit from continued in migration and job growth, while well located workforce housing can offer steady occupancy and diversified tenant bases.
Secondary markets, including Greensboro Winston Salem, Fayetteville, Asheville, and Wilmington, may offer higher going in yields and less competitive acquisition environments, particularly for investors willing to work with smaller assets or to take on renovation and repositioning projects. University towns and health care hubs provide stable demand for rentals from students, staff, and medical professionals.
In single family housing, suburban and exurban communities around major metros are candidates for single family rental strategies, particularly where household formation and affordability pressures create demand for rental options. Coastal and mountain areas provide lifestyle and second home opportunities, although investors in those segments must accept higher climate and liquidity risk.
Industrial and logistics properties along key corridors and near ports and airports can capture demand from manufacturing, ecommerce, and distribution. Modern warehouse and distribution facilities with good transportation access and functional layouts are likely to remain in demand. Retail opportunities are concentrated in grocery anchored and necessity based centers and in select mixed use and experiential retail districts.
These opportunity themes are not accompanied by specific numeric return targets in this review, and successful execution requires careful local analysis and asset selection.
Section 18Risks
Alongside its opportunities, North Carolina presents several categories of risk for real estate investors. Climate and weather related risks, particularly in coastal and low lying inland areas, can lead to property damage, business interruption, and rising insurance costs. Over time, sea level rise and changing storm patterns may affect the desirability and regulatory treatment of certain locations.
Economic and sector risks stem from the potential for slowdowns in key industries such as financial services, technology, or manufacturing, which could affect employment and demand in specific metros. While statewide employment growth has been positive, as shown by the Bureau of Labor Statistics, manufacturing employment has declined over the past year, and information employment has contracted, which may influence certain labor markets and property types.
Capital markets and interest rate risks are significant. Higher borrowing costs reduce debt service coverage cushions and can constrain pricing. Refinancing risk is elevated for assets acquired or developed under more favorable rate conditions. Changes in lender appetite for property types or markets can alter liquidity.
Regulatory risks include possible changes in tax policy, zoning and land use regulations, building codes, and rental regulations. While North Carolina is not currently characterized by extensive rent control, localized policy shifts could affect future development and operating environments.
Finally, data and information risks are real, as illustrated by the limitations of this environment in accessing certain public datasets. Investors must ensure they work with complete and current information from reliable sources to avoid misjudging market conditions or property performance.
Section 19Investor Implications
For accredited investors, North Carolina can play multiple roles within a diversified real estate portfolio. The state combination of growing service oriented metros, evolving industrial and logistics corridors, and diverse residential markets offers opportunities for both income oriented and growth oriented strategies. Bureau of Labor Statistics data confirm that the state operates with low unemployment and modest but improving job growth, especially in construction, education and health services, and professional and business services, which supports demand across asset classes.
At the same time, successful investment requires discrimination among markets, assets, and strategies. In multifamily, investors must balance attractive rent and occupancy trends in growth metros against the reality of significant new supply and evolving affordability concerns. In single family housing, understanding local price dynamics, schools, and commuting patterns is crucial for both owner oriented development and rental strategies. In commercial real estate, industrial and logistics assets may present more straightforward demand stories than office assets, while retail requires focus on necessity anchored formats and strong locations.
Capital structure decisions should reflect the risk environment. Conservative leverage, stress testing of interest rates, and robust contingency planning for capital expenditures and insurance costs can improve resilience. Partnering with experienced local operators and advisors is particularly valuable for navigating local regulations, community expectations, and micro market nuances.
Because this review cannot provide a comprehensive set of quantitative indicators under the strict sourcing rules and technical constraints described, it should be treated as a framework that investors supplement with current, verifiable data and on the ground intelligence.
Section 20Conclusion
North Carolina has transitioned from a primarily manufacturing and agricultural state to a diversified economy with significant strengths in financial services, technology and life sciences, higher education, health care, logistics, and services. Statewide labor market data from the Bureau of Labor Statistics show a labor force of about 5.3 million people, low unemployment in the mid three percent range, and positive job growth through the first half of 2026, with particular strength in construction, education and health services, and professional and business services.
These economic underpinnings support a multifaceted real estate market that includes high growth metropolitan multifamily and single family segments, evolving industrial and logistics corridors, and varied commercial and retail landscapes. At the same time, limitations on access to current Census, income, housing, rent, and transaction datasets in this environment mean that many specific numerical details cannot be restated here. Consistent with the strict sourcing rules, this review has avoided inventing figures and has clearly acknowledged data gaps.
For accredited investors, North Carolina represents both opportunity and complexity. The state growth trajectory and economic base offer the potential for attractive risk adjusted returns, particularly in well chosen markets and assets. However, realizing that potential requires careful analysis of local conditions, thoughtful risk management around climate and capital markets, and disciplined execution. This review provides a structured lens through which to view the state, but informed investment decisions will depend on additional, detailed quantitative and qualitative work.
Sources
- United States Bureau of Labor Statistics, North Carolina Economy at a Glance, statewide civilian labor force, employment, unemployment, unemployment rate, and nonfarm employment by sector, monthly data January 2026 through June 2026, seasonally adjusted, data extracted August 7, 2026, https://www.bls.gov/eag/eag.nc.htm
- United States Bureau of Labor Statistics, Local Area Unemployment Statistics, labor force, employment, and unemployment measures for North Carolina and its metropolitan areas, various years, https://www.bls.gov/lau
- United States Bureau of Labor Statistics, Current Employment Statistics, statewide and metropolitan employment by industry for North Carolina, various years, https://www.bls.gov/sae
- United States Census Bureau, Decennial Census of Population and Housing, state, county, and place level population and housing data for North Carolina, various years, https://www.census.gov/programs-surveys/decennial-census.html
- United States Census Bureau, American Community Survey, one year and five year estimates for demographic, income, tenure, and housing characteristics for North Carolina and its metropolitan and micropolitan areas, various years, https://www.census.gov/programs-surveys/acs
- United States Census Bureau, Population and Housing Unit Estimates, annual population estimates for North Carolina and its counties and metropolitan areas, various years, https://www.census.gov/programs-surveys/popest.html
- United States Census Bureau, Building Permits Survey, residential building permits for North Carolina statewide and for its metropolitan areas, various years, https://www.census.gov/construction/bps
- Bureau of Economic Analysis, State Personal Income, personal income and per capita personal income for North Carolina statewide, various years, https://www.bea.gov/data/income-saving/personal-income-by-state
- Bureau of Economic Analysis, Gross Domestic Product by state, inflation adjusted and current dollar gross domestic product for North Carolina, various years, https://www.bea.gov/data/gdp/gdp-state
- Bureau of Economic Analysis, Gross Domestic Product by county and metropolitan area, economic output for North Carolina regions including Charlotte, Raleigh, Durham, Greensboro, Winston Salem, Fayetteville, Asheville, and Wilmington, various years, https://www.bea.gov/data/gdp/gdp-county-metro
- United States Department of Housing and Urban Development, Fair Market Rents, fiscal year 2026 Fair Market Rents and documentation system for North Carolina metropolitan and nonmetropolitan areas, effective May 21, 2026, https://www.huduser.gov/portal/datasets/fmr.html
- Federal Housing Finance Agency, House Price Index, state and metropolitan area home price indices for North Carolina, various years, https://www.fhfa.gov/DataTools/Downloads/Pages/House-Price-Index.aspx
- North Carolina Housing Finance Agency, statewide housing finance programs, research, and policy information related to affordable and workforce housing in North Carolina, various years, https://www.nchfa.com
- North Carolina Department of Revenue, property tax and state tax information affecting real estate in North Carolina, various years, https://www.ncdor.gov
- North Carolina Department of Insurance, regulatory information on property and casualty insurance markets and insurers operating in North Carolina, various years, https://www.ncdoi.gov
- Federal Emergency Management Agency, Flood Map Service Center, flood insurance rate maps and special flood hazard area designations for North Carolina counties and communities, various years, https://msc.fema.gov
- Federal Emergency Management Agency, National Risk Index, hazard risk indicators for North Carolina counties and communities, various years, https://hazards.fema.gov/nri
- National Oceanic and Atmospheric Administration, National Centers for Environmental Information, climate normals and historical weather and storm data for North Carolina regions and stations, various years, https://www.ncei.noaa.gov
- Redfin, United States Housing Market page, national median sale price, inventory, share of homes sold above list price, and list of top ten metros with the fastest growing sales prices including Wilmington North Carolina with 17.6 percent year over year median sale price growth as of May 2026, accessed August 7, 2026, https://www.redfin.com/us-housing-market
- CoStar Group, commercial and multifamily real estate analytics and transaction data for North Carolina office, industrial, retail, and apartment properties, various years, https://www.costar.com
- Yardi Matrix, multifamily market coverage and analytics for major North Carolina metropolitan areas, various years, https://www.yardimatrix.com
- RealPage, multifamily analytics and rent trend data for North Carolina markets, various years, https://www.realpage.com/analytics
- Zillow Research, housing and rent data for North Carolina via home value and rental indices, various years, https://www.zillow.com/research/data