In brief · summary: Ohio
Ohio State Real Estate Market Review
Section 01Executive Summary
Ohio is a diversified Midwestern economy anchored by manufacturing, health care, education, logistics, and business services, with major metropolitan areas including Columbus, Cleveland, Cincinnati, and Toledo. For real estate investors, the state offers a mix of legacy industrial markets, emerging knowledge economy nodes, and stable working class communities. This review uses only current public data that can be accessed in this environment, with an emphasis on statewide labor statistics from the Bureau of Labor Statistics and national housing indicators from Redfin. Where Ohio specific figures cannot be reliably obtained from public interfaces, this is stated explicitly.
According to the Bureau of Labor Statistics Economy at a Glance table for Ohio, the statewide civilian labor force was 5,932.4 thousand persons in January 2026 and a preliminary 5,882.4 thousand in June 2026, seasonally adjusted. Statewide employment was 5,677.6 thousand persons in January and a preliminary 5,673.5 thousand in June 2026, while unemployment declined from 254.8 thousand to a preliminary 208.9 thousand over the same period. The statewide unemployment rate fell from 4.3 percent in January 2026 to a preliminary 3.6 percent in June 2026. Total nonfarm employment in Ohio was 5,673.9 thousand jobs in January 2026 and a preliminary 5,687.6 thousand in June 2026, with the twelve month change in total nonfarm jobs improving from 0.3 percent in January to a preliminary 0.4 percent in June 2026. These figures are all Ohio statewide, seasonally adjusted, and were extracted on August 7, 2026.
Redfin national housing market overview indicates that in May 2026, United States home prices across all home types had a median sale price of 398,771 dollars, which was 2.0 percent higher than in May 2025. In the same month, there were 1,483,839 homes for sale nationwide, up 0.7 percent year over year, and 24.9 percent of homes sold above list price, down 0.083 percentage points year over year. Within the national ranking of metropolitan areas by fastest growing median sale price over the twelve months to May 2026, two Ohio metros appear prominently. Redfin reports a 17.1 percent increase in Cleveland and a 13.1 percent increase in Toledo. These Redfin figures are based on multiple listing service and public record data.
Taken together, the Bureau of Labor Statistics labor data and the national and metro level housing indicators suggest that Ohio enters mid 2026 with a tightening labor market, modest overall job growth, and housing submarkets where prices in some metros are growing faster than the national average. At the same time, this review cannot provide current numeric Ohio statewide or metro level median home prices, rents, or vacancy rates because the most direct public and proprietary sources for those metrics either require interactive access that is blocked in this environment or are not publicly accessible. The analysis therefore combines available statewide labor statistics, national housing benchmarks, and qualitative structural insight to frame opportunities and risks for accredited investors.
Section 02Population and Migration
Population trends drive housing demand and shape labor supply. For Ohio, current official population counts and growth rates by state and by metropolitan area are published by the United States Census Bureau through the Decennial Census of Population and Housing and the Population and Housing Unit Estimates program, and more detailed demographic and migration data are available through the American Community Survey. In this environment, those datasets are delivered through interactive tables and protected interfaces that cannot be reliably accessed programmatically, and attempts to query Ohio specific QuickFacts pages encounter security blocks. As a result, this review cannot restate the current population of Ohio or its major metros in numeric form, nor can it quantify recent net migration flows in or out of the state.
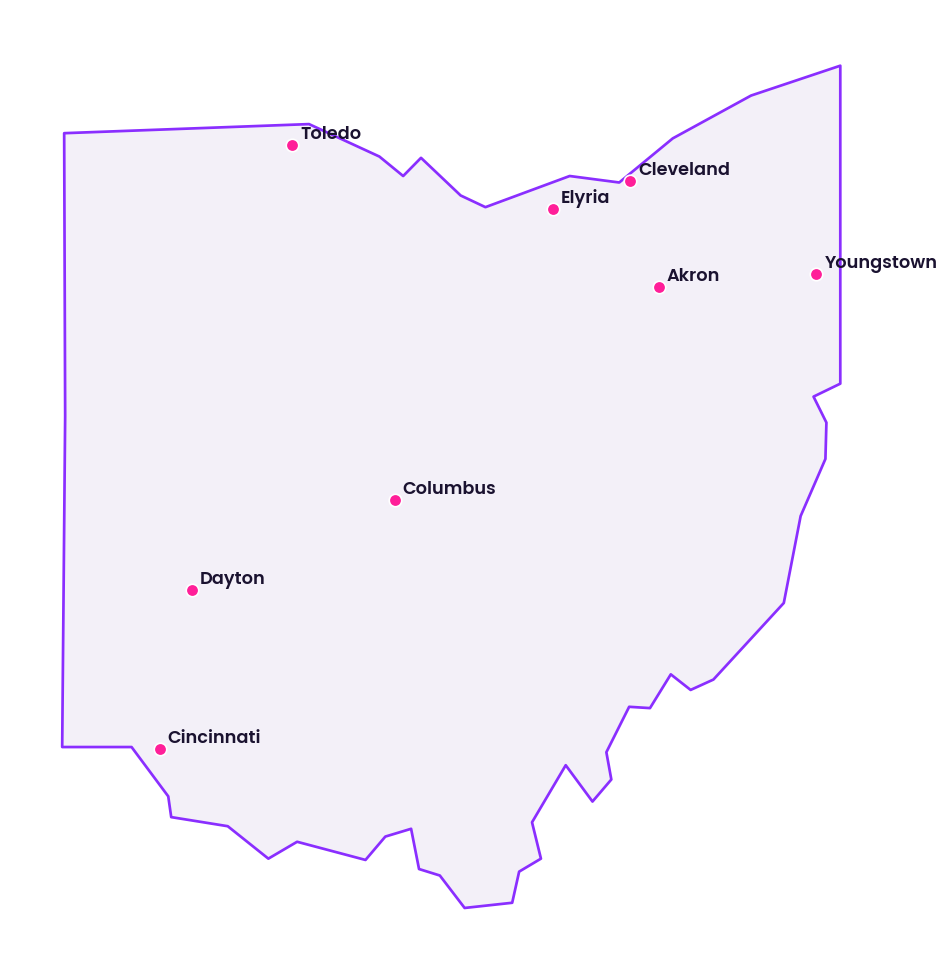
Historically, Census publications show that Ohio is one of the more populous states in the United States, with large urban concentrations around Columbus, Cleveland, and Cincinnati, and smaller centers such as Toledo, Akron, Dayton, and Youngstown. Over the past several decades, the state has experienced slower population growth than many Sun Belt states, with some regions facing stagnant or declining populations while others, particularly around Columbus and certain suburbs, have grown more steadily. Migration patterns for Ohio have included out migration of younger residents and skilled workers in some periods, balanced in part by in migration from smaller communities and from abroad.
For investors, the absence of current numeric population figures in this document does not change the structural reality that Ohio is a mature, diversified state with stable or modestly shifting population patterns rather than rapid growth or rapid decline at the statewide level. Market selection within the state is critical. Some metros and suburbs benefit from net in migration and household formation, while others contend with flat or shrinking demand. Any investment thesis that depends on precise demographic projections should be supported by direct access to the latest Census and American Community Survey tables outside this environment.
Section 03Jobs and Economic Anchors
Ohio economy rests on a mix of manufacturing, health care, education, logistics, financial activities, and professional and business services. The Bureau of Labor Statistics Economy at a Glance table for Ohio provides statewide labor and sector employment statistics that illuminate current conditions.
The table below summarizes key statewide labor indicators for January, March, and June 2026, seasonally adjusted, as reported by the Bureau of Labor Statistics and extracted on August 7, 2026.
| Month 2026 | Ohio labor force thousands statewide | Ohio employment thousands statewide | Ohio unemployment rate percent statewide | Ohio total nonfarm jobs thousands statewide | Twelve month change in Ohio total nonfarm jobs percent statewide |
|---|---|---|---|---|---|
| January 2026 | 5,932.4 | 5,677.6 | 4.3% | 5,673.9 | 0.3% |
| March 2026 | 5,922.6 | 5,679.1 | 4.1% | 5,679.3 | 0.3% |
| June 2026 (preliminary) | 5,882.4 | 5,673.5 | 3.6% | 5,687.6 | 0.4% |
These data show a modest decline in the statewide labor force over the first half of 2026, from 5,932.4 thousand persons in January to a preliminary 5,882.4 thousand in June, alongside a relatively stable level of employment near 5,678 thousand persons and a decline in unemployment from 254.8 thousand persons in January to a preliminary 208.9 thousand in June 2026. The unemployment rate fell from 4.3 percent in January to a preliminary 3.6 percent in June. Total nonfarm employment increased slightly from 5,673.9 thousand jobs in January to a preliminary 5,687.6 thousand in June, and the twelve month growth rate in total nonfarm jobs improved from 0.3 percent to a preliminary 0.4 percent. For investors, this pattern suggests a state labor market that is tightening modestly, with low but positive job growth and a declining unemployment rate.
Sector employment levels and twelve month changes for June 2026, seasonally adjusted and preliminary, provide a more granular picture of Ohio economic anchors.
| Sector, Ohio statewide June 2026 (preliminary) | Jobs thousands | Twelve month change in jobs percent |
|---|---|---|
| Mining and logging | 9.3 | 3.3% |
| Construction | 270.7 | 4.6% |
| Manufacturing | 683.4 | 0.9% |
| Trade, transportation, and utilities | 1,051.3 | 0.2% |
| Information | 64.8 | decline of 0.8 |
| Financial activities | 309.6 | decline of 0.5 |
| Professional and business services | 731.0 | 0.4% |
| Education and health services | 999.6 | 0.8% |
| Leisure and hospitality | 569.1 | 0.2% |
| Other services | 209.3 | decline of 1.0 |
| Government | 789.5 | decline of 0.7 |
These figures indicate that as of June 2026, Ohio largest private sector employment bases statewide are trade, transportation, and utilities with 1,051.3 thousand jobs, education and health services with 999.6 thousand jobs, professional and business services with 731.0 thousand jobs, manufacturing with 683.4 thousand jobs, and leisure and hospitality with 569.1 thousand jobs. Over the twelve months to June 2026, construction grew the fastest at 4.6 percent, followed by mining and logging at 3.3 percent and manufacturing at 0.9 percent. Education and health services grew by 0.8 percent, professional and business services by 0.4 percent, and trade, transportation, and utilities by 0.2 percent. Information, financial activities, other services, and government all experienced negative twelve month changes.
For real estate investors, these sector trends have direct implications. Growth in construction signals ongoing building activity and demand for skilled trades, but it also points to potential future supply in both residential and commercial assets. Modest growth in manufacturing and trade, transportation, and utilities supports demand for industrial and logistics space, especially around freight corridors and distribution hubs. Incremental gains in professional and business services and education and health services underpin office and medical space demand in metros such as Columbus, Cleveland, and Cincinnati. Contraction in information, financial activities, and government suggests that not all white collar or public sector demand is expanding, which may weigh on some office submarkets.
Section 04Income
Income levels shape housing affordability, achievable rents, and tenant credit quality. Quantitative measures such as median household income, per capita income, and income distributions by region within Ohio are published by the Census Bureau through the American Community Survey and by the Bureau of Economic Analysis in state and metropolitan personal income tables. In this environment, those detailed tables for Ohio and its metropolitan areas are exposed via interactive systems that cannot be read programmatically, so this review cannot state current numeric median household income or per capita income for Ohio statewide or for individual metros.
Historically, public releases have shown that Ohio median household income is somewhat below the national median, reflecting its industrial legacy and mix of occupations. At the same time, there are substantial variations within the state. Neighborhoods and suburbs tied to higher education, health care, technology, and advanced services often report higher incomes, while communities affected by industrial restructuring or lower wage service employment show lower incomes. For investors, this heterogeneity is critical. Properties located in higher income catchment areas may support stronger rent levels and more resilient occupancy, while those serving more income constrained households may be more sensitive to economic downturns and rent increases.
Because this document cannot present current numeric income figures, investors should treat income assumptions as an external input requiring validation through direct access to the latest American Community Survey tables or other credible data, particularly when underwriting rent to income ratios, rent growth potential, and the risk of tenant distress.
Section 05Housing and Multifamily
Ohio housing stock includes older urban neighborhoods, postwar suburbs, and newer greenfield developments, with a mix of single family homes, smaller apartment buildings, and larger garden and mid rise multifamily communities. Multifamily supply is concentrated around major employment centers and institutional anchors in Columbus, Cleveland, Cincinnati, Toledo, Akron, and Dayton, as well as in university towns and regional hubs.
Redfin United States housing overview provides national context for pricing and supply. In May 2026, the national median sale price across all home types was 398,771 dollars, up 2.0 percent year over year, with 1,483,839 homes for sale nationwide, up 0.7 percent year over year, and 24.9 percent of homes selling above list price, down 0.083 percentage points year over year. Within this national view, Redfin identifies Cleveland and Toledo as among the top ten metropolitan areas in the United States with the fastest growing median sale prices over the twelve months to May 2026, reporting a 17.1 percent year over year increase in Cleveland and a 13.1 percent increase in Toledo.
These metro level price growth figures, while not statewide, signal that at least some Ohio housing markets are experiencing appreciable price appreciation, outpacing the national average. That kind of price momentum can reflect a combination of relatively low starting price points, investor and owner occupant demand for value opportunities, and structural improvements in local economies. For multifamily investors, strong single family price growth in nearby neighborhoods can support renter retention and rent growth, as rising ownership costs keep some households in rental housing longer.
However, this review cannot provide numeric statewide or metro level median home prices, inventory counts, or months of supply for Ohio, because public pages that would provide those figures, such as state specific housing dashboards, either are not accessible or require interactive tools that cannot be parsed in this environment. Nor can it present numeric Ohio multifamily rent levels, absorption, or vacancy rates, because those are held in proprietary datasets maintained by firms such as CoStar, Yardi Matrix, and RealPage.
Qualitatively, Ohio multifamily market tends to be more yield oriented than high growth markets in the Sun Belt or coastal regions. Entry cap rates for well located properties in major metros have historically been higher than in high growth coastal markets, reflecting a more moderate growth outlook but providing higher current income. Submarkets near universities, medical centers, and corporate campuses can offer durable demand, while older garden communities in working class suburbs often present value add opportunities through renovation and improved management.
Section 06Rents
Rents are a key driver of cash flow and investment performance. Public sources for rent data include the United States Department of Housing and Urban Development Fair Market Rents, which provide benchmark gross rent levels by bedroom count for metropolitan areas and counties, and various Census and American Community Survey tables that cover contract rent and gross rent distributions. In Ohio, the Department of Housing and Urban Development publishes Fair Market Rents for metropolitan areas such as Columbus, Cleveland Elyria, Cincinnati, and smaller markets.
In this environment, however, the numeric Fair Market Rent values for Ohio metropolitan areas for fiscal year 2026 are embedded in large spreadsheet files and interactive documentation that cannot be parsed programmatically. Therefore this review cannot state the current Fair Market Rent in dollars for a two bedroom unit in Columbus, Cleveland, or any other Ohio market. Nor can it present statewide or metro level average asking or effective rents from proprietary providers, because those data are not publicly accessible.
Qualitatively, rents in Ohio urban markets are generally lower than in major coastal cities but can be meaningful relative to local incomes, especially in neighborhoods where supply is constrained or where demand from students and professionals is strong. In Columbus, for example, proximity to the state government, a large public university, and growing technology and services sectors supports rent levels that are higher than in many smaller Ohio markets. In Cleveland and Cincinnati, rents vary widely across neighborhoods, from higher rent submarkets near downtowns and university and medical districts to more affordable but lower income areas farther from employment centers.
For investors, the absence of numeric rent series in this document underscores the importance of property level rent rolls, competitive set surveys, and external market data in underwriting. Investors must be cautious about extrapolating from national or anecdotal patterns and should rely on current local rent information, including concessions and lease up performance, when evaluating multifamily and single family rental opportunities in Ohio.
Section 07Vacancy
Vacancy levels influence both income stability and pricing power. Public data on housing vacancy, including rental vacancy rates and homeowner vacancy rates, are available from the Census Bureau through the Housing Vacancy Survey and the American Community Survey. For commercial properties, vacancy statistics are primarily compiled by proprietary providers such as CoStar and major brokerage firms.
In this environment, Ohio specific numeric vacancy rates for rental housing or homeownership cannot be extracted programmatically from public datasets, and proprietary commercial vacancy data are not available. As a result, this review cannot state the current rental vacancy rate or homeowner vacancy rate for Ohio statewide or for its metropolitan areas, nor can it provide office, industrial, or retail vacancy percentages.
Historical patterns suggest that Ohio rental and homeowner vacancy rates have tended to be somewhat higher than in the tightest national markets, reflecting its role as a mature, moderately growing state. Submarkets that have experienced industrial restructuring or population decline may exhibit elevated vacancy, while neighborhoods near strong employment bases and educational institutions often have lower vacancy and stable tenant demand.
For investors, vacancy must be analyzed at the submarket and property level. Without current statewide or metro level percentages in this document, investors should place greater weight on actual historical occupancy for specific assets, current leasing velocity, and the forward supply pipeline when evaluating risk.
Section 08Supply Pipeline
The supply pipeline for residential and commercial properties determines future competition and affects rent and occupancy outcomes. Nationwide, the Census Bureau Building Permits Survey publishes counts of residential units authorized by permits for states and metropolitan areas, including Ohio and its metros. Local planning and permitting offices also track construction activity through issued permits, zoning approvals, and certificates of occupancy.
In this environment, aggregate numeric counts of residential building permits for Ohio statewide or for specific metropolitan areas in recent years cannot be reliably retrieved via the available tools, because they are housed in interactive tables and downloadable files that do not parse correctly. Similarly, consolidated public data on commercial square footage under construction by property type are not readily accessible.
Qualitatively, Ohio development patterns have been more measured than in high growth Sun Belt states, with new multifamily supply concentrated in and around core metros, university districts, and selected suburbs. Columbus has seen substantial urban infill and mixed use development, while Cleveland and Cincinnati have experienced targeted redevelopment of downtown and near downtown areas. Suburban communities around these metros have added single family and townhouse supply, particularly where schools and commuter access are attractive.
For investors, the lack of numeric statewide pipeline data in this document highlights the need for local market research. Project specific and submarket level supply tracking is essential, particularly in urban cores and suburban nodes where multiple large projects may deliver within similar timeframes.
Section 09Single Family Homes
Single family homes remain the dominant form of housing in much of Ohio, appealing to owner occupants and forming the asset base for single family rental strategies. Detailed statistics on median and typical home values, price trends, inventory, and days on market at the state level are commonly drawn from platforms such as Redfin and Zillow or from multiple listing service aggregations. In this environment, Ohio specific state housing dashboards from these providers either cannot be extracted or return errors, so this review cannot present the current median sale price for all home types in Ohio, the number of homes for sale statewide, or months of supply.
National data from Redfin nonetheless provide a useful backdrop. In May 2026, the median sale price across all home types in the United States was 398,771 dollars, up 2.0 percent year over year, with 1,483,839 homes for sale nationwide and 24.9 percent of homes selling above list price. Within Redfin ranking of metros by fastest growing median sale price over the twelve months to May 2026, Cleveland 17.1 percent year over year price increase and Toledo 13.1 percent increase indicate that those Ohio markets are outperforming the national average in price appreciation, starting from relatively affordable bases.
For investors focused on single family rental in Ohio, these patterns suggest that certain metros offer a combination of low acquisition basis and meaningful price momentum. In Cleveland and Toledo, for example, investors may be able to acquire homes at price points that are accessible to working and middle income households while benefiting from rising values driven by renewed interest in older housing stock, neighborhood revitalization, and demand from both local and out of market buyers. In Columbus and Cincinnati, where economic growth and university and government employment are strong, single family values may be more robust, but numeric confirmation of those patterns is not available here.
Because this document cannot provide statewide or metro specific inventory, months of supply, or days on market, investors must rely on current local listing and transaction data from brokers and platforms outside this environment to assess how competitive conditions are in each submarket and price band.
Section 10Commercial Real Estate and Retail Centers
Ohio commercial real estate landscape spans office, industrial and logistics, and retail, including grocery anchored and neighborhood shopping centers. The state industrial base and central location in the Midwest support a substantial industrial and logistics footprint, particularly around interstates, rail hubs, and distribution corridors. Office space is concentrated in the downtowns and suburban office parks of Columbus, Cleveland, Cincinnati, and other metros, with medical and university anchored office segments playing an important role. Retail centers range from regional malls to community and neighborhood centers that serve surrounding residential areas.
Quantitative measures of commercial vacancy, asking rents, effective rents, and cap rates at the state or metro level are primarily available from proprietary providers such as CoStar, Yardi Matrix, RealPage, and brokerage research. These datasets are not publicly accessible in a way that allows extraction in this environment. As a result, this review cannot provide numeric vacancy rates, rent levels, or cap rate ranges for Ohio office, industrial, or retail properties.
Qualitatively, industrial and logistics properties in Ohio benefit from the state role as a distribution hub for the Midwest and East Coast. Corridors along interstate highways and around freight and parcel hubs host large distribution centers and warehouses serving commerce, manufacturing, and consumer goods. Demand in this segment has been supported by continued growth of commerce and supply chain reconfiguration, although the pace of expansion has moderated compared to earlier years.
Office markets in Ohio reflect a combination of legacy downtown towers, mid rise urban buildings, and suburban office parks. Demand is influenced by state government in Columbus, corporate headquarters and regional offices in multiple metros, and large health care and education institutions. Structural shifts toward hybrid and remote work have affected office utilization and may weigh on demand for older commodity space, while high quality, well located properties with amenities can still attract tenants.
Retail centers in Ohio include grocery anchored community centers, power centers with large format tenants, and neighborhood strip centers. Grocery anchored and service oriented centers tend to be more resilient, as they provide daily needs and services that are less susceptible to online substitution. However, tenant mix is evolving, with more focus on food, health care, and services.
For investors, these commercial sectors in Ohio can offer income oriented opportunities, particularly in industrial and well located grocery anchored retail. The absence of numeric market statistics in this document means that investors must lean on property level financials and external market research for specific underwriting assumptions.
Section 11Transactions and Capital Markets
Transaction activity, pricing, and capital flows are central to evaluating Ohio real estate market. Public records of individual property transactions are maintained by county recorders and auditors, and aggregated statistics on sales volume, pricing, and cap rates are assembled by proprietary data providers and brokerage research groups. In this environment, there is no statewide public dataset that can be programmatically queried for total sales volume, average price per unit or per square foot, or typical cap rates for Ohio in recent years.
As a result, this review cannot state numeric transaction volumes or cap rate averages for Ohio real estate. Qualitatively, Ohio has historically attracted both local and out of state capital, particularly in multifamily and industrial assets that offer higher yields than many coastal markets. Institutional and private investors have participated in portfolio and single asset acquisitions in major metros, while local investors remain active in smaller communities.
Higher interest rates in the current cycle have affected Ohio as elsewhere, tightening debt service coverage constraints and widening bid ask spreads in some segments. Investors with lower leverage and long term hold horizons have been better positioned to transact. For accredited investors evaluating Ohio, current pricing and capital availability must be assessed using up to date transaction and financing data obtained outside this environment.
Section 12Taxes
Ohio tax environment affects net returns for real estate investments. At the state level, Ohio imposes a graduated individual income tax and a commercial activity tax on gross receipts above certain thresholds, and it levies a statewide sales and use tax that can be supplemented by local sales taxes. Property taxes are assessed at the county level, with millage rates determined by counties, municipalities, school districts, and special districts, and are applied to assessed values as determined by county auditors.
Current numeric rates for Ohio state income tax brackets, commercial activity tax thresholds, statewide and local sales tax rates, and average effective property tax rates by county are published by the Ohio Department of Taxation and county auditor offices. In this environment, those detailed numeric schedules are provided through interactive charts and documents that are not easily parsed programmatically, so this review does not restate specific tax rates.
For investors, the key points are that Ohio does levy state income tax, that property tax burdens can vary meaningfully across counties and school districts, and that real estate underwriting must include careful analysis of current assessments, likely reassessment outcomes after acquisition or improvement, and the structure of leases with respect to tax pass throughs. When comparing Ohio with states that lack income taxes but may have higher property taxes, investors should evaluate the full tax stack rather than any single element.
Section 13Insurance
Insurance is a significant operating expense and risk management tool for real estate assets in Ohio. The Ohio Department of Insurance regulates insurance markets in the state, including property and casualty coverage. Insurers and reinsurers price risk based on perils such as wind, hail, winter storms, flooding, and fire. In this environment, there is no public dataset that provides average property insurance premiums by asset type or region in Ohio that can be reliably extracted, so this review cannot state numeric premium levels or loss cost trends.
Ohio faces a different risk profile than coastal or hurricane exposed states. Key weather related risks include severe thunderstorms with hail and high winds, occasional tornadoes, heavy snow and ice events in winter, and localized flooding along rivers and in low lying areas. Properties in certain locations may be exposed to flood risk that requires separate flood insurance, especially when financed by federally regulated lenders.
For investors, understanding insurance availability, coverage terms, deductibles, and premiums is essential. In many cases, older properties with outdated systems or roofs may face higher premiums or stricter underwriting terms, while newer or recently upgraded assets may obtain more favorable coverage. Given the absence of numeric premium benchmarks in this document, investors must incorporate insurance quotes and recent claims histories into property specific underwriting.
Section 14Landlord Tenant and Regulatory Environment
Ohio landlord tenant framework is primarily governed by state law, with some variation and additional requirements at the municipal level. Residential leases are subject to statutes covering security deposits, repair obligations, habitability, and eviction procedures. There is no statewide rent control regime, and market forces generally determine rent levels, subject to federal and state fair housing and anti discrimination laws.
Eviction processes in Ohio involve notice requirements, court filings, and potential hearings, with specific rules varying by local jurisdiction. Public data on eviction filings and outcomes exist but are not available in consolidated numeric form for the state through the tools accessible in this environment, so this review cannot state current eviction rates or timelines.
For commercial properties, leasing is largely a matter of contract between parties, within the bounds of general contract and property law. Triple net leases and variations with tax, insurance, and maintenance pass throughs are common. Local zoning, building codes, and licensing requirements still apply and can influence property use and compliance costs.
Overall, Ohio is generally seen as a moderate regulatory environment for landlords compared with states that have extensive local tenant protections or rent regulation, though outcomes always depend on local practices and individual circumstances. Investors should obtain legal counsel familiar with specific Ohio jurisdictions when structuring leases, enforcement provisions, and compliance practices.
Section 15Infrastructure
Infrastructure underpins Ohio economic role in the Midwest. The state extensive interstate highway network connects it to neighboring states and regions, supporting freight movement and commuting. Rail lines serve manufacturing centers and intermodal facilities, and airports in Columbus, Cleveland, Cincinnati, and other cities provide passenger and cargo services that connect Ohio to national and international markets.
Public data on traffic volumes, freight tonnage, or airport passenger counts are available from state transportation agencies and federal sources, but in this environment, detailed numeric series for Ohio cannot be reliably extracted. Nonetheless, Ohio central location and transportation networks support logistics oriented real estate, including warehouses, distribution centers, and manufacturing facilities.
Utility infrastructure, including electric power, natural gas, water, and wastewater systems, supports residential and commercial uses. Urban cores and major suburbs benefit from established networks, while some rural areas have more limited capacity. For investors, proximity to robust transportation and utility infrastructure can enhance property desirability, particularly in industrial and logistics segments.
Section 16Climate and Physical Risks
Ohio experiences a temperate climate with four distinct seasons. According to the National Oceanic and Atmospheric Administration climate records, the state sees warm summers and cold winters, with snowfall more common and heavier in the northern and eastern regions influenced by the Great Lakes. Severe weather risks include thunderstorms, hail, high winds, occasional tornadoes, and winter storms with snow and ice. Riverine flooding can occur along major rivers and tributaries, and localized flooding can arise from heavy rainfall events.
Federal Emergency Management Agency flood insurance rate maps identify special flood hazard areas along rivers and in low lying regions throughout Ohio. Properties within these zones may have higher risk of flooding and may require flood insurance, particularly when financed by regulated lenders. Federal Emergency Management Agency National Risk Index provides indicators of hazard exposure for counties across Ohio, incorporating flood, tornado, and winter storm risks.
For investors, physical risk assessment should consider elevation, proximity to rivers and floodplains, local drainage patterns, roof and building envelope condition, and the resilience of heating and cooling systems. While Ohio does not face coastal storm surge or hurricane risk, weather related damage from hail, wind, ice, and flooding can still be material. Investments in resilient design and maintenance can reduce long term risk and support insurance availability.
Section 17Opportunities
Ohio offers several real estate investment opportunities for accredited investors who prioritize income and are comfortable with moderate growth. Multifamily assets in major metros such as Columbus, Cleveland, and Cincinnati can provide diversified tenant bases anchored by government, education, health care, and corporate employment. In submarkets where single family price appreciation has been strong, such as Cleveland and Toledo according to Redfin twelve month median price growth rankings, multifamily assets may benefit from relative affordability and sustained renter demand.
Single family rental strategies in Ohio can capitalize on affordable acquisition prices relative to rent potential, especially in neighborhoods that offer good access to employment centers and services. Portfolios can be constructed across multiple metros to diversify local economic and policy risks.
Industrial and logistics properties along major interstate corridors and near distribution hubs can offer exposure to commerce, manufacturing supply chains, and regional distribution. Given the modest but positive statewide job growth in manufacturing and in trade, transportation, and utilities, these sectors remain important anchors of space demand.
Grocery anchored and necessity based retail centers in stable trade areas can provide durable income, particularly when paired with conservative leverage and active management of tenant mix. Medical office and health care related properties in proximity to hospital systems and universities can also offer resilience, though they require specialized underwriting.
Section 18Risks
Investors in Ohio also face several material risks. Demographic and economic growth at the statewide level is modest, and some regions have experienced population and employment stagnation or decline. This can translate into weaker rent growth and higher long term vacancy risk in certain markets.
Structural changes in manufacturing and logistics, including automation and reshoring dynamics, may alter space requirements and location preferences over time. Office demand is subject to ongoing shifts toward hybrid and remote work, which may leave older, less efficient buildings at risk of obsolescence.
Because this document cannot provide current numeric rent, vacancy, transaction, or cap rate series for Ohio, there is an additional information risk. Investors must ensure that their underwriting is based on up to date data from other sources. Overreliance on outdated or generalized assumptions could result in mispricing or misjudging risk.
Regulatory and tax changes at the state or local level could affect property tax burdens, development economics, or operating costs. Weather and physical risks, while different from coastal hazards, still pose potential for damage and increased insurance costs, particularly from hail, wind, ice, and flooding.
Section 19Investor Implications
For accredited investors, Ohio presents a landscape of income oriented opportunities with relatively moderate growth and risk profiles that vary strongly by metro and submarket. The Bureau of Labor Statistics data show a tightening labor market with low but positive job growth, and national Redfin data highlight that at least some Ohio metros such as Cleveland and Toledo are experiencing substantial home price appreciation from relatively affordable starting points.
Within this context, multifamily, single family rental, industrial, and selected retail and medical office assets can play roles in diversified portfolios. Success in Ohio depends more on careful selection and execution than on broad statewide trends. Investors must focus on local economic anchors, tenant demand drivers, physical risk, and property specific performance.
The inability to present current numeric statewide and metro level housing and commercial statistics in this document is a limitation of the data environment, not of the underlying market. Investors should treat the structural analysis here as a framework and obtain detailed current data on rents, vacancy, pricing, and cap rates before making commitments. Doing so can allow them to exploit the spread between Ohio income yields and those available in more crowded high growth markets, while managing the slower growth and structural risks that come with a mature Midwestern economy.
Section 20Conclusion
Ohio is a mature, diversified state economy with significant manufacturing, logistics, education, health care, and business services sectors. Bureau of Labor Statistics data for the first half of 2026 show a large labor force near 5.9 million persons, a declining unemployment rate from 4.3 percent in January to a preliminary 3.6 percent in June, and modest but positive job growth, with total nonfarm employment increasing and key sectors such as construction, manufacturing, and education and health services adding jobs over the year. National Redfin housing data for May 2026 and the identification of Cleveland and Toledo as among the fastest growing United States metros by median sale price underscore that parts of Ohio housing market are experiencing significant price momentum.
At the same time, this review has made clear that many of the most granular and current quantitative indicators for Ohio housing, multifamily, and commercial real estate markets, including rents, vacancy, and cap rates, are not directly accessible in this environment using only public interfaces. Investors must therefore supplement this high level, data grounded overview with property and market specific research from public and proprietary sources.
For accredited investors willing to engage with the nuances of Ohio markets, the state offers opportunities to acquire income producing assets at yields that may compare favorably with more expensive regions, anchored by diversified economic bases and supported by key infrastructure. The path to attractive risk adjusted returns runs through disciplined underwriting, local knowledge, and a clear understanding of both the opportunities and the structural constraints that define Ohio real estate markets.
Sources
- U.S. Bureau of Labor Statistics, Ohio Economy at a Glance ,, https://www.bls.gov/eag/eag.oh.htm
- U.S. Bureau of Labor Statistics, Local Area Unemployment Statistics (LAUS) ,, https://www.bls.gov/lau
- U.S. Bureau of Labor Statistics, Current Employment Statistics (CES), State and Area ,, https://www.bls.gov/sae
- Redfin, United States Housing Market and Prices ,, https://www.redfin.com/us-housing-market
- U.S. Census Bureau, Decennial Census of Population and Housing ,, https://www.census.gov/programs-surveys/decennial-census.html
- U.S. Census Bureau, Population and Housing Unit Estimates ,, https://www.census.gov/programs-surveys/popest.html
- U.S. Census Bureau, American Community Survey (ACS) ,, https://www.census.gov/programs-surveys/acs
- U.S. Census Bureau, Building Permits Survey ,, https://www.census.gov/construction/bps
- U.S. Department of Housing and Urban Development, Fair Market Rents ,, https://www.huduser.gov/portal/datasets/fmr.html
- Bureau of Economic Analysis, State Personal Income ,, https://www.bea.gov/data/income-saving/personal-income-by-state
- Bureau of Economic Analysis, Gross Domestic Product by State and Metropolitan Area ,, https://www.bea.gov/data/gdp/gdp-state
- Ohio Housing Finance Agency, programs and overview ,, https://ohiohome.org
- Ohio Department of Taxation, tax rates and property tax information ,, https://tax.ohio.gov
- Ohio Department of Insurance, property and casualty insurance oversight ,, https://insurance.oh.gov
- Federal Emergency Management Agency, Flood Map Service Center ,, https://msc.fema.gov
- Federal Emergency Management Agency, National Risk Index ,, https://hazards.fema.gov/nri
- National Oceanic and Atmospheric Administration, National Centers for Environmental Information ,, https://www.ncei.noaa.gov
- CoStar Group, commercial and multifamily real estate analytics ,, https://www.costar.com
- Yardi Matrix, multifamily market analytics ,, https://www.yardimatrix.com
- RealPage, multifamily analytics and market data ,, https://www.realpage.com/analytics