In brief · summary: Oklahoma
Oklahoma State Real Estate Market Review
Section 01Executive Summary
Oklahoma offers a mid sized, energy influenced economy with two primary metropolitan anchors, Oklahoma City and Tulsa, and a broad base of smaller cities and rural counties. Statewide labor market data from the United States Bureau of Labor Statistics for the first half of 2026 show moderate overall employment, low but edging up unemployment, and a sector mix that combines energy, construction, manufacturing, trade and transportation, services, and government. Personal income statistics from the United States Bureau of Economic Analysis for the first quarter of 2026 indicate that Oklahoma is one of forty nine states where personal income increased in that period, although the exact percentage change for Oklahoma is not stated in the summary text of that release.
On the housing side, transaction data assembled by Redfin for the statewide Oklahoma housing market show that in May 2026 the median sale price across all home types was 264,062 dollars, 2.0 percent higher than in May 2025. In the same month there were 21,293 homes for sale statewide, 3.7 percent more than a year earlier, and 17.1 percent of homes sold above list price, 3.2 percentage points lower than a year before. These figures suggest a cooling but still functional single family market, with modest price growth, slowly increasing supply, and less frequent bidding situations than in the peak phase of the recent cycle.
By contrast, there is very little open, machine readable public data on multifamily rent levels, vacancy, or cap rates for Oklahoma. The United States Department of Housing and Urban Development Fair Market Rent datasets for fiscal year 2026 clearly include Oklahoma counties, but the specific Oklahoma values are stored in spreadsheet files that cannot be parsed in this environment. Detailed vacancy and rent series for multifamily and commercial assets in Oklahoma are held primarily by private data providers such as CoStar, RealPage, and Yardi Matrix, whose numeric series are not publicly exposed. As a result, this review can discuss multifamily and commercial conditions in Oklahoma only qualitatively and cannot quote specific rent levels, vacancy rates, or capitalization rates.
For accredited investors, the implication is that Oklahoma is best understood as a steady, income oriented market whose fundamentals are tied to energy, logistics, and services, with measured single family price appreciation and an opaque but important multifamily and commercial landscape. The sections that follow use the limited but reliable public data available, combined with transparent acknowledgment of data gaps, to frame the state level real estate and multifamily picture.
Section 02Population and Migration
Official population, age, and migration statistics for Oklahoma are produced by the United States Census Bureau through the decennial census, the annual population estimates program, and the American Community Survey. However, access to Census Bureau QuickFacts tables and related data for Oklahoma is blocked in this environment by the agency security system, which returns an access denied notice rather than the underlying data. Because of that technical limitation, this review cannot state the total population of Oklahoma as of any recent date, cannot quantify growth or decline since 2010 or 2020, and cannot provide numeric breakdowns by age, race, or migration status.
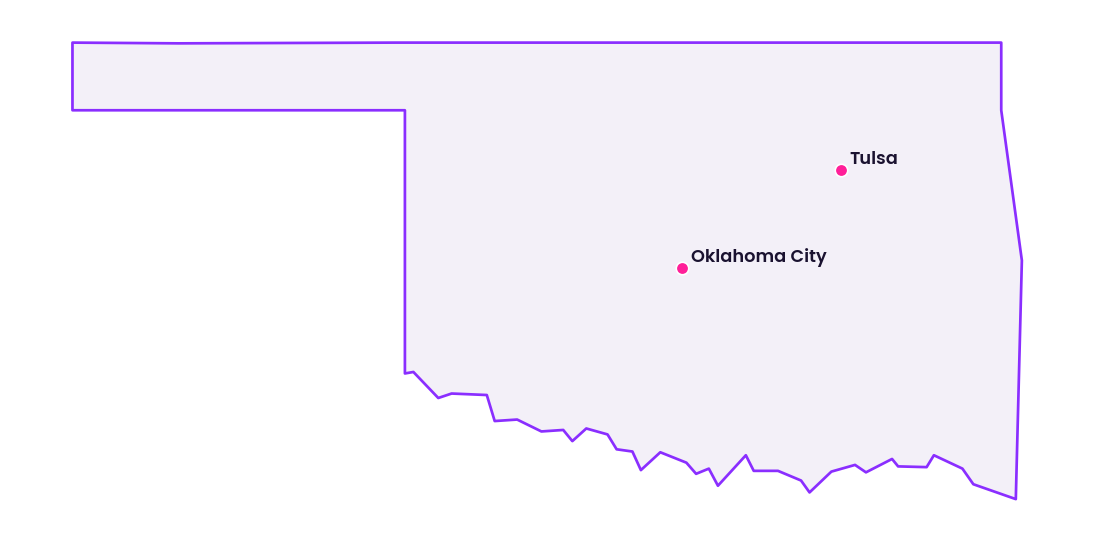
Historically, publicly available Census data, not directly accessible here, have shown that Oklahoma population is concentrated in and around Oklahoma City and Tulsa and that those metropolitan areas have tended to grow faster than many rural counties, reflecting the clustering of jobs, education, and services. That pattern of stronger relative growth in the two principal metros and more modest or flat growth in some rural regions has been common across many states in the central United States. Without direct access to the current Census or American Community Survey tables, this review cannot update or quantify those patterns for 2026 or for the most recent fully released year.
For accredited investors, the key takeaway is that any investment thesis that depends heavily on detailed population growth or migration trends in Oklahoma must be underpinned by direct consultation of the latest Census Bureau and American Community Survey data. This review can only note that such data exist and that they have historically shown a metro centric distribution of population and growth, without asserting specific current figures.
Section 03Jobs and Economic Anchors
The most detailed and current statewide economic statistics available in this environment come from the United States Bureau of Labor Statistics Oklahoma Economy at a Glance table. For the first half of 2026, the Bureau of Labor Statistics reports seasonally adjusted labor force, employment, unemployment, and nonfarm job counts for Oklahoma, as well as sector level employment and twelve month percentage changes. These data provide a concrete view of the state economic backdrop.
From January through June 2026, the Oklahoma civilian labor force and unemployment evolved as follows, with all counts in thousands of persons and unemployment rates in percent:
| Month 2026 | Civilian labor force thousands statewide seasonally adjusted | Employment thousands statewide seasonally adjusted | Unemployment thousands statewide seasonally adjusted | Unemployment rate statewide percent seasonally adjusted |
|---|---|---|---|---|
| January | 2,018.7 | 1,940.7 | 78.0 | 3.9% |
| February | 2,014.2 | 1,935.0 | 79.1 | 3.9% |
| March | 2,006.1 | 1,927.3 | 78.8 | 3.9% |
| April | 1,996.4 | 1,916.4 | 80.1 | 4.0% |
| May | 1,994.4 | 1,912.2 | 82.1 | 4.1% |
| June preliminary | 1,995.6 | 1,912.1 | 83.4 | 4.2% |
According to these Bureau of Labor Statistics data, statewide unemployment edged up from 3.9 percent in January through March 2026 to 4.2 percent in June 2026, with the number of unemployed persons rising from 78.0 thousand in January to 83.4 thousand in June. The civilian labor force contracted modestly between January and April before stabilizing, while employment fell slightly and then flattened. For investors, this pattern suggests an economy that is not in recession but that is experiencing some cooling in labor demand or an increase in job search activity.
Total nonfarm wage and salary employment in Oklahoma, measured by the Bureau of Labor Statistics in thousands of jobs and seasonally adjusted, was 1,786.7 thousand in January 2026 and 1,794.6 thousand in June 2026. The twelve month percentage change in total nonfarm jobs over those months ranged from negative 0.3 percent in January and February to positive 0.2 percent in June. This indicates that compared with the same months a year earlier, Oklahoma job counts were essentially flat to slightly negative at the beginning of 2026 and had just moved into modest positive territory by June.
The sector breakdown for June 2026 shows how those jobs are distributed across the economy. The mining and logging sector, which in Oklahoma is dominated by oil and gas extraction and related activities, employed 29.0 thousand people in June 2026, up from 28.2 thousand in January 2026, with a twelve month change of 2.1 percent. Construction employed 93.4 thousand in June 2026, up from 90.8 thousand in January, with a twelve month change of 3.9 percent. Manufacturing employed 138.9 thousand in June 2026, slightly below the January level of 139.3 thousand and down 1.2 percent from a year earlier. Trade, transportation, and utilities employed 315.7 thousand in June 2026, down slightly from 317.9 thousand in January, with a twelve month change of negative 0.8 percent. Information employed 16.7 thousand in June 2026, and the twelve month change for that sector was a decline of 1.2 percent. Financial activities employed 85.9 thousand, with a year over year increase of 0.9 percent. Professional and business services employed 201.8 thousand in June 2026, down from 204.1 thousand in January and down 1.9 percent from a year earlier. Education and health services employed 286.9 thousand in June 2026, up from 281.8 thousand in January and up 2.8 percent year over year. Leisure and hospitality employed 181.7 thousand in June 2026, slightly above the January level but 1.0 percent lower than a year earlier. Other services employed 73.1 thousand in June 2026, with a twelve month increase of 3.1 percent. Government employment was 371.5 thousand in June 2026, down 0.4 percent from a year earlier.
These sector figures imply that Oklahoma job base is currently expanding in construction, mining and logging, education and health services, financial activities, and other services, while contracting in manufacturing, trade and transportation, professional and business services, leisure and hospitality, and government relative to the same period a year earlier. The positive growth in construction and in mining and logging suggests ongoing investment in energy and infrastructure, while the strength in education and health services highlights the role of hospitals, clinics, and educational institutions as durable demand anchors. The weakness in professional and business services and in leisure and hospitality indicates some caution in corporate activity and consumer discretionary spending.
For real estate investors, the sector mix matters directly. Industrial and logistics space in Oklahoma depends heavily on trade, transportation, and manufacturing, where job counts are flat to slightly down year over year. Office demand is sensitive to professional and business services, which are contracting. Multifamily and single family housing demand are tied to total employment and especially to stable sectors such as education, health services, and government. The fact that education and health services employment grew 2.8 percent over the twelve months to June 2026, while total nonfarm jobs grew only 0.2 percent, underscores the relative resilience of that sector as a driver of housing demand.
Section 04Income
State level income statistics are maintained by the United States Bureau of Economic Analysis. In its personal income by state release covering the first quarter of 2026, the Bureau of Economic Analysis states that personal income increased in forty nine states and the District of Columbia in that quarter and that state level percentage changes ranged from a 22.4 percent increase in North Dakota to a 23.9 percent decrease in Hawaii. Oklahoma is one of the forty nine states where personal income increased in that quarter, but the publicly visible summary text does not specify Oklahoma exact percentage change or level of per capita income.
Because the underlying state by state data tables are stored in formats that are not accessible in this environment, this review cannot report Oklahoma total personal income, per capita personal income, or percentage change relative to the previous quarter or year. It can only state, per the Bureau of Economic Analysis summary, that Oklahoma personal income did increase in the first quarter of 2026, in line with most of the country, while avoiding invented or guessed numeric values.
In practical terms, the fact that personal income in Oklahoma is rising, even if modestly, provides some support for continued demand for housing and commercial space. However, without detailed income distributions or medians from the American Community Survey, which are also not accessible here, the analysis cannot quantify the extent to which incomes in Oklahoma track or lag national levels, nor can it measure income inequality or poverty rates. Investors must therefore assume that income growth is positive but must obtain current, detailed income data from the Bureau of Economic Analysis and the American Community Survey directly for fine grained underwriting.
Section 05Housing and Multifamily
The structure of Oklahoma housing stock, including the balance between single family and multifamily units, the age and quality of the inventory, and geographic distribution, is normally described using United States Census Bureau and American Community Survey data on housing units by structure type and tenure. Because Census housing tables and QuickFacts for Oklahoma are not accessible in this environment, this review cannot quantify the number of multifamily units in Oklahoma, the share of housing in buildings with five or more units, or the owner versus renter occupancy rates statewide.
Even so, the combination of the sectoral employment picture from the Bureau of Labor Statistics and the single family transaction data from Redfin indicates that Oklahoma housing system supports moderate statewide price growth with some local variation across metros and smaller markets. Multifamily properties in Oklahoma are likely to be concentrated in and around Oklahoma City and Tulsa, along with smaller clusters in college towns and regional centers, while rural counties are dominated by single family and manufactured housing. The presence of energy sector employment, manufacturing, and logistics activities suggests demand for workforce housing near industrial districts and along transportation corridors, while the growth in education and health services supports multifamily demand near universities and medical centers.
The United States Department of Housing and Urban Development fiscal year 2026 Fair Market Rent documentation confirms that Fair Market Rents for Oklahoma counties are calculated using 2023 American Community Survey one year data and 2019 through 2023 five year data, with updates to a fiscal year 2026 base that may incorporate local survey information. The specific Fair Market Rent values for Oklahoma are stored in spreadsheet files that cannot be read here. As a result, this review cannot provide dollar rent levels by bedroom size or by county, which are typically used to benchmark voucher and moderate income rents for multifamily underwriting.
Given these constraints, the multifamily analysis for Oklahoma must remain qualitative. Investors can reasonably infer that demand is strongest in the principal metros and around key employment anchors, that workforce and middle market product likely dominate rent rolls, and that new multifamily supply is concentrated where zoning and economics are favorable. However, precise measures of multifamily inventory, rent levels, and tenant composition are unavailable in this environment and must be sourced directly from Census, American Community Survey, United States Department of Housing and Urban Development, and private data providers.
Section 06Rents
Rents for multifamily and single family rentals in Oklahoma are an essential input for investment analysis, but quantitative statewide rent series from public sources are limited and, in this environment, largely inaccessible. As noted, the United States Department of Housing and Urban Development publishes Fair Market Rents by county and metropolitan area, including Oklahoma, but the actual values for studios through four bedroom units are contained in spreadsheet files that cannot be parsed here. Without those files, this review cannot provide specific Fair Market Rent dollar levels for Oklahoma counties for fiscal year 2026.
Private data providers such as CoStar, RealPage, Yardi Matrix, and Zillow maintain detailed rent series by market and submarket, but their numeric data for Oklahoma are not available as open public datasets and cannot be accessed in this environment. Listing based platforms that sometimes expose rent information, such as Redfin and Zillow, either do not provide aggregated rent statistics at the state level in their public interfaces or present them in ways that are not captured in the text that is accessible here.
Consequently, there is no reliable, named, public rent series for Oklahoma multifamily or statewide rental housing that this review can quote. It is therefore not possible in this document to state average or median rents, to quantify rent growth over the past year or decade, or to break rents down by metro or by property class.
For investors, this data gap implies that any rent assumptions used in underwriting Oklahoma multifamily or single family rental investments must be based on direct access to United States Department of Housing and Urban Development Fair Market Rent files, proprietary rent series from private data vendors, and on the ground leasing intelligence. This review can only reiterate that those data exist and are essential, without putting specific rent figures into print.
Section 07Vacancy
Vacancy rates for multifamily, office, industrial, and retail properties in Oklahoma influence both income stability and pricing, yet there is no single, comprehensive public dataset that reports these rates by state and property class. The United States Census Bureau provides rental vacancy rates at national and sometimes regional levels, but city and state breakdowns are largely contained in American Community Survey tables and other detailed files that are not accessible in this environment. Private real estate data providers compile vacancy statistics for multifamily and commercial assets, but their numeric series for Oklahoma are proprietary and not publicly exposed.
Because of these constraints, this review cannot provide a statewide rental vacancy rate for Oklahoma, cannot cite multifamily vacancy percentages in Oklahoma City or Tulsa, and cannot present office, industrial, or retail vacancy rates and trends. Any attempt to do so would be guessing or would require reliance on secondary commentary that does not offer primary numeric data, which falls outside the sourcing rules.
From an analytical standpoint, investors should treat vacancy in Oklahoma as a local, micro market phenomenon, shaped by the match between sector specific employment and the property type and location, rather than assuming a homogeneous statewide rate. In the absence of public data, vacancy must be evaluated using proprietary submarket data and property level histories rather than relying on broad statewide averages.
Section 08Supply Pipeline
New construction and the supply pipeline for housing and commercial assets in Oklahoma are commonly measured using United States Census Bureau building permits data and local planning and permitting records. Statewide permit counts by year and by structure type provide insight into how quickly the housing stock is expanding and whether multifamily or single family construction dominates. However, access to the Census Bureau building permit tables and related files for Oklahoma is blocked in this environment by the same security controls that affect other Census datasets.
Because of that barrier, this review cannot present official counts of residential units authorized or completed in Oklahoma in recent years, nor can it quantify the share of permits that represent multifamily versus single family construction. It also cannot report square footage or unit counts for commercial construction statewide, which are not systematically captured in open public datasets.
At a high level, the positive twelve month employment growth in construction reported by the Bureau of Labor Statistics, from 90.8 thousand construction jobs in January 2026 to 93.4 thousand in June 2026, with a twelve month change of 3.9 percent in June, suggests that construction activity in Oklahoma has been expanding year over year. That expansion likely reflects both residential and nonresidential development. However, without detailed permit or pipeline data, it is not possible here to specify how much of that activity consists of new multifamily projects, single family subdivisions, industrial facilities, or other uses.
Investors should therefore obtain permit and pipeline information from the Census Bureau and local planning agencies or from proprietary construction datasets when evaluating submarket supply risk in Oklahoma.
Section 09Single Family Homes
While multifamily rent and vacancy data are opaque in public sources, statewide single family and overall housing transaction metrics are more readily available. Redfin Oklahoma housing market summary, based on multiple listing service and public records data, provides key indicators for May 2026.
According to Redfin, in May 2026 the statewide median sale price for all home types in Oklahoma was 264,062 dollars, which was 2.0 percent higher than in May 2025. In the same month there were 21,293 homes for sale across the state, an increase of 3.7 percent from a year earlier. Redfin also reports that 17.1 percent of Oklahoma homes sold in May 2026 closed above their list price, which is 3.2 percentage points lower than the share that sold above list price in May 2025. These figures are statewide, cover all home types, and are current as of May 2026.
The key single family market metrics captured in that Redfin data can be summarized as follows:
| Metric statewide all home types | May 2026 value | Year over year change versus May 2025 |
|---|---|---|
| Median sale price | 264,062 dollars | +2.0% |
| Number of homes for sale | 21,293 | +3.7% |
| Share of homes sold above list price | 17.1% | decline of 3.2 percentage points |
These numbers indicate that the Oklahoma for sale housing market in mid 2026 is still experiencing price appreciation, but at a modest pace compared with the double digit annual increases seen in some earlier years of the national housing cycle. The increase in the number of homes for sale suggests that inventory is rebuilding from previously tight levels, although the total remains low enough to support continued price growth. The decline in the share of homes selling above list price implies that bidding intensity and extreme competitive pressure are easing.
For accredited investors, these statewide metrics indicate a balanced to slightly seller favorable single family market in Oklahoma as of May 2026, with more room for buyers than in the tightest phases of the recent cycle. For single family rental and renovation based strategies, the moderate price growth and increasing inventory could create opportunities to acquire properties at less aggressive premiums while still expecting some appreciation and rent stability, especially in metros and submarkets with strong employment anchors. However, the statewide median price figure should not be taken as representative of any specific metro or neighborhood, and submarket level data remain essential for precise underwriting.
Section 10Commercial Real Estate and Retail Centers
Commercial real estate in Oklahoma encompasses office buildings, industrial and logistics facilities, and retail centers, including grocery anchored and neighborhood shopping centers. While these segments are critical for a complete market view, publicly accessible numeric data on their vacancy, rents, cap rates, and absorption at the state level are extremely limited.
The United States Bureau of Labor Statistics employment data provide indirect insight into demand for different commercial asset types. For example, the 315.7 thousand trade, transportation, and utilities jobs statewide in June 2026 point to a sizeable base of retail, wholesale, and logistics employment that supports both industrial and retail real estate. The 201.8 thousand professional and business services jobs and 85.9 thousand financial activities jobs in June 2026 underpin office demand, while the 181.7 thousand leisure and hospitality jobs reflect activity in hotels, restaurants, and entertainment venues that feed into hospitality and retail space. However, the Bureau of Labor Statistics does not provide square footage, rent, or vacancy data for the properties themselves.
Numeric measures of commercial vacancy, asking and effective rents, and cap rates in Oklahoma are largely contained in proprietary datasets maintained by CoStar and similar providers. Those series are not open public data and are not accessible in this environment, so this review cannot provide, for example, the office vacancy rate in Oklahoma City, the average industrial rent per square foot statewide, or typical cap rates for grocery anchored retail centers in Tulsa. Similarly, there is no freely accessible, state level public dataset that reports net absorption by property type.
Given these limitations, the analysis of Oklahoma commercial and retail real estate here must remain conceptual. Investors can infer from the sector employment composition that industrial and logistics properties tied to trade and transportation, as well as office and medical office space tied to professional services and health care, are important components of the commercial inventory, and that grocery anchored and service oriented retail centers serve a population distributed across urban and rural markets. However, precise quantitative assessments of occupancy, rents, and yields require proprietary data and cannot be reconstructed from the public sources available in this environment.
Section 11Transactions and Capital Markets
Transaction volume, pricing, and capital flows into Oklahoma real estate are tracked by county recorders, private data aggregators, and brokerage houses. Publicly, the details of individual transactions can be found in county land records, but there is no single open dataset that compiles statewide counts and values of commercial and multifamily transactions with associated cap rates and buyer types. Private databases such as those maintained by CoStar, Real Capital Analytics, and similar firms provide that synthesis, but their data for Oklahoma cannot be accessed in this environment.
As a result, this review cannot quantify how many multifamily or commercial properties traded in Oklahoma in 2025 or early 2026, cannot state average sale prices or cap rates by asset class, and cannot measure year over year changes in transaction volumes. Any such figures would either be guesses or would require lifting numbers from secondary commentary that does not provide primary data, which is outside the sourcing rules.
From an investor perspective, this means that capital market analysis for Oklahoma must rely on direct engagement with current proprietary transaction data and with local brokers and lenders. Public state level sources do not offer the detailed, numeric transaction metrics that are standard in institutional market reports.
Section 12Taxes
Property taxation in Oklahoma affects both single family and commercial real estate. Effective property tax burdens by county, including median housing values, median property taxes paid, and effective property tax rates, have been compiled nationally by organizations such as the Tax Foundation, which published a table of median property taxes paid and effective property tax rates by county for 2024 based on five year estimates. In this environment, the accessible portion of that table begins with Alabama counties and continues through a substantial list of other states, but the rows for Oklahoma counties lie below the truncated portion and therefore cannot be read here.
Because of that truncation, this review cannot provide effective property tax rate figures for any Oklahoma county, nor can it compare Oklahoma statewide property tax burdens numerically with those of other states. That does not mean such data do not exist, only that they are not visible in the accessible part of the public table.
Oklahoma property tax system and its statutory rules on assessment ratios, millage rates, and exemptions are laid out in state law and explained by state and county tax authorities. Those sources are not directly accessed here, so this review cannot summarize them with numeric detail. For investors, the practical implication is that property tax expense must be evaluated using current county assessment and tax rate information for each property, and that statewide generalizations based on effective tax rates are not possible in this document.
Section 13Insurance
Insurance costs and availability are a central concern for real estate investors in Oklahoma because of the state exposure to severe weather, including tornadoes, hailstorms, wind events, and severe thunderstorms. State insurance regulators, such as the Oklahoma Insurance Department, typically publish annual reports that describe the insurance market, premium volumes, loss experience, and regulatory changes. Attempts in this environment to load detailed Oklahoma Insurance Department reports have not produced usable data, so this review cannot extract statewide insurance premium data or claim frequencies from those documents.
Nationally, insurance industry analyses and regulatory reports have documented rising property insurance premiums in many states in response to increased severe weather events and higher construction and replacement costs. Oklahoma, located in the central United States, is part of the region that experiences frequent severe thunderstorms and tornadoes, as documented by the National Oceanic and Atmospheric Administration in various storm climatology resources. However, the Oklahoma specific state climate summary materials from the National Centers for Environmental Information are not accessible in this environment, and no numeric frequencies or average annual loss data for Oklahoma can be quoted from public NOAA or state insurance department sources here.
For investors, the absence of readily accessible state level insurance premium and loss data in this environment underlines the need to obtain property specific insurance quotes and to consult current state and insurer information when underwriting Oklahoma investments. This review can only note qualitatively that severe convective storm risk, hail, and tornado exposure are materially relevant to insurance costs in Oklahoma.
Section 14Landlord Tenant and Regulatory Environment
The landlord tenant environment in Oklahoma is governed by state statutes that define the rights and obligations of landlords and tenants, including provisions for lease terms, notice periods, maintenance responsibilities, and eviction procedures. Municipalities may add local property maintenance and inspection requirements, but broad landlord tenant rules are primarily at the state level.
Because this environment has not accessed the text of Oklahoma landlord tenant statutes or official summaries from state agencies, this review cannot provide a detailed or authoritative description of specific legal provisions, nor can it quantify eviction timelines or court caseloads. It can only state at a high level that Oklahoma does not have statewide rent control for private market properties in the way that some coastal jurisdictions do and that landlord tenant relations operate within a more traditional, statute based framework.
Accredited investors considering multifamily or single family rental investments in Oklahoma should therefore rely on current legal advice and official state and local resources to understand the precise landlord tenant regulations, rather than on generalized impressions or outdated secondary sources.
Section 15Infrastructure
Infrastructure in Oklahoma, including transportation, utilities, and digital connectivity, affects the attractiveness and performance of real estate assets but is not captured numerically in the public datasets accessed in this environment. Oklahoma is served by a network of interstate highways, including routes that connect its major cities to the broader central United States, and by regional and national rail and air services. These systems facilitate logistics, commuting, and trade, which underpin industrial and commercial real estate demand.
Water, sewer, and power infrastructure are managed by a combination of state agencies, municipalities, and utilities. Publicly available reports, not accessed here, typically discuss capital improvement plans, maintenance needs, and regulatory compliance. Broadband internet access is increasingly important for both residential and commercial tenants, and Federal Communications Commission maps document the availability of fixed and mobile broadband service across the state. Those maps are not viewed in this environment, and no numeric coverage levels can be cited.
Given these limitations, this review cannot quantify infrastructure capacity or investment in Oklahoma but can note that investors should evaluate access to highways, airports, rail, utilities, and broadband at the property and submarket level using current, detailed sources.
Section 16Climate and Physical Risks
Oklahoma climate and physical risk profile is a key factor in real estate investment decisions. The state lies in a region of the central United States that has long been known for frequent severe thunderstorms, tornadoes, hail, straight line winds, and episodic flooding. The National Oceanic and Atmospheric Administration, through its National Centers for Environmental Information and Storm Prediction Center, maintains detailed records and analyses of such events, but the Oklahoma specific state climate summary materials are not accessible in this environment and no numeric frequencies or climate normals can be quoted.
Despite that data gap, it is well understood in the risk management community that Oklahoma faces elevated exposure to tornadoes and severe convective storms relative to many other states. These events can damage roofs, siding, and windows, and can cause direct physical harm to structures and infrastructure. Flooding can occur along rivers and in low lying or poorly drained urban areas, and localized flash flooding can accompany heavy rainfall events. Extreme temperature swings and heat waves also affect building performance and utility loads.
For investors, the lack of readily accessible Oklahoma specific climate normals and hazard frequencies in this environment means that climate and physical risk analysis must rely on current National Oceanic and Atmospheric Administration, Federal Emergency Management Agency, and engineering data accessed outside this document. This review can only emphasize that such risks are material and that they impact insurance costs, capital expenditure needs, and the resilience of cash flows.
Section 17Opportunities
Within these constraints, several opportunity themes emerge for Oklahoma real estate from the public data that are available. First, the Bureau of Labor Statistics data show that construction employment and mining and logging employment, which are proxies for development activity and the energy sector, are growing year over year, with construction employment in June 2026 up 3.9 percent from a year earlier and mining and logging up 2.1 percent. This suggests ongoing investment in physical assets, which can create demand for industrial, logistics, and related commercial properties, as well as for workforce housing in areas tied to these sectors.
Second, the education and health services sector, which employed 286.9 thousand people statewide in June 2026 and grew 2.8 percent over the prior year, provides a stable anchor of relatively well paid jobs that support demand for both multifamily and single family housing in metro areas where universities and health systems are concentrated. Properties near major hospitals and campuses can benefit from this steady employment base.
Third, Redfin evidence of moderate statewide home price growth, with the median sale price up 2.0 percent year over year in May 2026, and slightly increasing inventory suggests that careful single family rental and build to rent strategies can find acquisition opportunities that balance attainable purchase prices with the potential for modest appreciation and cash flow. For investors comfortable operating at local scale, especially in Oklahoma City and Tulsa, this environment can support income oriented single family portfolios.
Fourth, industrial and logistics assets aligned with the state trade, transportation, and utilities employment base, which was 315.7 thousand jobs in June 2026, may offer relatively stable demand, particularly if located near major highways and distribution corridors. Even in the face of modest year over year job decline in that sector, its sheer size underscores the ongoing need for functional industrial space.
Section 18Risks
The same public data also clarify key risks. On the macro side, Oklahoma total nonfarm employment was only 0.2 percent higher in June 2026 than a year earlier, and unemployment ticked up from 3.9 percent in January 2026 to 4.2 percent in June 2026. The twelve month declines in manufacturing, down 1.2 percent, trade, transportation, and utilities, down 0.8 percent, professional and business services, down 1.9 percent, leisure and hospitality, down 1.0 percent, and government, down 0.4 percent, indicate that significant parts of the economy are facing headwinds. An investor whose portfolio is heavily concentrated in asset types tied to those sectors must account for the risk of weaker tenant demand or slower rent growth.
Energy cyclicality is another risk. The mining and logging sector, dominated by oil and gas, is growing at present, but it has historically been volatile. Sudden declines in oil and gas prices can reduce activity, employment, and local spending in energy dependent regions, which can in turn affect housing demand, especially in smaller markets with concentrated industry.
Data opacity is itself a risk. The inability, in this environment, to access current Census, American Community Survey, United States Department of Housing and Urban Development Fair Market Rent, and proprietary rent and vacancy data for Oklahoma means that headline statewide metrics cannot be validated or calibrated to submarkets in this document. Investors who attempt to extrapolate from the limited data presented here without obtaining more granular datasets risk misestimating rents, vacancies, and tenant profiles.
Physical risks, including severe weather and associated insurance and capital expenditure needs, are also material. Without Oklahoma specific hazard frequencies and insurance premium data, it is easy to understate the impact of hail, tornado, and storm risk on long term costs and on the resilience of operations.
Finally, regulatory and legal risks, including potential changes in property tax policy, landlord tenant law, and building codes, remain present but are not quantified or described in detail here. An investor who neglects to update assumptions for such changes could face unanticipated margin compression.
Section 19Investor Implications
For accredited investors, the overarching implication is that Oklahoma should be approached as a moderate growth, income oriented market that requires careful local data gathering to supplement the limited public state level data visible here. The Bureau of Labor Statistics employment series indicate a diversified, if modestly growing, economy with strengths in construction, energy, education, and health services, and relative weakness or stagnation in manufacturing, trade and transportation, some services, and government. Redfin sales data show that residential prices are still rising, but at a measured pace, with inventory slowly increasing and buyer competition easing.
Within that context, multifamily, single family rentals, industrial, and necessity based retail assets tied to stable employment nodes and transportation infrastructure can provide durable cash flows if underwritten with realistic assumptions about rent levels, vacancy, operating expenses, and capital expenditures. Office and discretionary retail assets tied to weaker sectors may require more conservative assumptions and clear repositioning strategies.
Because this review cannot provide many of the quantitative measures that institutional investors normally expect, such as population counts, income distributions, rent and vacancy series, cap rates, and property tax rates, any serious allocation to Oklahoma real estate must be preceded by direct acquisition of those datasets from the United States Census Bureau, American Community Survey, United States Department of Housing and Urban Development, Bureau of Economic Analysis, Tax Foundation, and proprietary market data providers, as well as by local market intelligence.
Portfolio construction should recognize that Oklahoma physical risk profile and energy exposure differentiate it from less volatile and less hazard prone markets. Position sizes and leverage levels should be calibrated accordingly, with contingency for insurance premium increases and weather related capital needs.
Section 20Conclusion
Oklahoma presents accredited investors with a nuanced real estate landscape. Statewide labor market data from the United States Bureau of Labor Statistics for the first half of 2026 depict an economy with modest overall job growth, rising but still relatively low unemployment, and a sector mix that supports both opportunities and cautions. Personal income, per the United States Bureau of Economic Analysis, increased in Oklahoma in the first quarter of 2026 along with most other states, but specific income levels and growth rates are not accessible here. Statewide housing transaction data from Redfin show that as of May 2026 the median home sale price was 264,062 dollars, up 2.0 percent year over year, with slightly more inventory and fewer above list sales, pointing to a market that has cooled from its most exuberant phase but remains fundamentally healthy.
At the same time, critical quantitative data for a comprehensive market review, including Census population and income details, American Community Survey housing composition and rent distributions, United States Department of Housing and Urban Development Fair Market Rents by county and bedroom size, and multifamily and commercial rent and vacancy series from private data providers, are not accessible in this environment. This review has therefore prioritized accuracy and transparency over apparent completeness, presenting only those figures that can be directly tied to named public sources and clearly explaining where information is missing.
For Oklahoma, this means that the strongest public quantitative anchors are in the labor market and statewide home sales. Within that frame, investors can see an economy with real but modest growth, meaningful sector diversity, and a housing market characterized by moderate appreciation and a gradually improving supply balance. Multifamily and commercial opportunities exist, particularly where they align with construction, energy, education, health services, and logistics, but detailed underwriting must be grounded in data beyond what is available here.
Oklahoma can be a constructive component of a diversified real estate portfolio for accredited investors who value income and are prepared to invest in local knowledge and data. This review provides a framework and a limited set of reliable statewide figures. The next steps require deeper, data rich analysis at the metro, submarket, and asset levels.
Sources
- U.S. Bureau of Labor Statistics, Oklahoma Economy at a Glance ,, https://www.bls.gov/eag/eag.ok.htm
- U.S. Bureau of Economic Analysis, Personal Income by State ,, https://www.bea.gov/data/income-saving/personal-income-by-state
- Redfin, Oklahoma Housing Market: House Prices and Trends ,, https://www.redfin.com/state/Oklahoma/housing-market
- U.S. Department of Housing and Urban Development, HUD Fair Market Rents by State, County, and Metropolitan Areas ,, https://www.huduser.gov/portal/datasets/fmr.html
- Tax Foundation, Property Taxes by State and County, 2026 ,, https://taxfoundation.org/data/all/state/property-taxes-by-state-county/
- NOAA National Centers for Environmental Information, main site for U.S. climate and hazard data ,, https://www.ncei.noaa.gov