In brief · summary: Pennsylvania
Pennsylvania State Real Estate Market Review
Section 01Executive Summary
Pennsylvania is a large, diversified state economy anchored by health care, education, manufacturing, logistics, energy, and government. Labor market data from the United States Bureau of Labor Statistics for Pennsylvania, seasonally adjusted and statewide, show that the civilian labor force increased from 6,582.9 thousand people in January 2026 to a preliminary 6,642.6 thousand in June 2026. Employment rose from 6,300.8 thousand in January 2026 to a preliminary 6,371.3 thousand in June 2026, while unemployment fell from 282.1 thousand to a preliminary 271.3 thousand over the same period. The statewide unemployment rate edged down from 4.3 percent in January 2026 to a preliminary 4.1 percent in June 2026. Total nonfarm payroll employment grew from 6,197.6 thousand jobs in January 2026 to a preliminary 6,209.6 thousand in June 2026, with year over year total nonfarm growth of 0.6 percent in June 2026. These figures describe a mature labor market with modest job growth and unemployment slightly above the very lowest state readings nationally.
Sector level data indicate that Pennsylvania job base is broad. As of June 2026, seasonally adjusted, the state had a preliminary 555.9 thousand manufacturing jobs, 261.7 thousand construction jobs, 1,132.0 thousand trade, transportation, and utilities jobs, 87.3 thousand information jobs, 342.2 thousand financial activities jobs, 839.0 thousand professional and business services jobs, 1,420.7 thousand education and health services jobs, 582.7 thousand leisure and hospitality jobs, 262.0 thousand other services jobs, and 704.2 thousand government jobs. Over the twelve months to June 2026, education and health services jobs grew by 2.0 percent, leisure and hospitality by 1.9 percent, professional and business services by 0.6 percent, and financial activities by 0.4 percent, while manufacturing jobs declined by 0.2 percent and trade, transportation, and utilities jobs declined by 0.4 percent. This mix underpins demand for a wide range of residential and commercial property types.
On the ownership side, statewide housing data from Redfin for May 2026 show that Pennsylvania median sale price across all home types was 318,867 dollars, 5.6 percent higher than in May 2025. There were 43,276 homes for sale statewide in May 2026, 6.8 percent more than one year earlier, and 32.3 percent of homes sold above list price, 0.1 percentage points higher than a year before. For national context, Redfin United States housing market overview reports a nationwide median sale price of 398,771 dollars in May 2026, up 2.0 percent year over year, with 1,483,839 homes for sale, 0.7 percent more than in May 2025, and 24.9 percent of homes selling above list price, 0.083 percentage points less than a year earlier. These figures indicate that Pennsylvania home prices are below the national median but are growing faster, with more rapid inventory growth and a larger share of homes selling above list, suggesting a relatively competitive but not overheated market.
Publicly accessible datasets in this environment do not provide current statewide numeric measures for rents, vacancies, or commercial property cap rates and absorption. Fair Market Rent tables from the United States Department of Housing and Urban Development and detailed rent and vacancy series from private providers such as CoStar, Yardi Matrix, and RealPage are distributed through large spreadsheets or subscription platforms that cannot be parsed here. As a result, this review relies on labor and ownership housing statistics for quantitative anchors and provides qualitative analysis for multifamily rents, vacancies, and commercial real estate. It is designed as a structural and directional guide for accredited investors who will layer in asset level and submarket data from additional sources.
Section 02Population and Migration
Population scale and migration shape real estate demand across Pennsylvania metropolitan and rural regions. The United States Census Bureau state population estimates for 2020 to 2025 are summarized in the Vintage 2025 dataset. In this environment, the statewide Pennsylvania row in the detailed file cannot be viewed because of truncation limits when accessing the full dataset, so current official numeric population counts for Pennsylvania and annual population changes for the state cannot be quoted directly in this review.
The same Census dataset provides region level context. For the Middle Atlantic region, which comprises New York, New Jersey, and Pennsylvania, the Census Bureau reports that the estimated resident population was 42,388,314 people as of July 1, 2020 and 42,610,074 as of July 1, 2025. That represents a net increase of 221,760 residents over five years for the region as a whole. Intermediate estimates in the dataset show that the Middle Atlantic population declined in 2021 and 2022 before resuming growth in 2023, with positive net migration and modest natural increase contributing to the recovery. While this pattern does not isolate Pennsylvania trajectory, it suggests that the broader region has shifted from slight decline to slow growth.
Migration patterns at the state level can also be inferred qualitatively from national housing and labor trends. Pennsylvania relatively moderate home prices compared with high cost coastal markets, combined with a strong base of universities, health systems, and logistics infrastructure, attract households from more expensive states, while some residents move out seeking lower taxes or different climates. Publicly available Redfin migration analytics for Pennsylvania are truncated in this environment, so this review cannot state numeric net inflow or outflow of homebuyers searching to move into or out of Pennsylvania in recent months.
For investors, the key takeaway is that Pennsylvania is a large, slow growth state situated in a region that has experienced both out migration and renewed attraction in certain metropolitan areas. The absence of precise statewide population figures in this environment means that investors should consult full Census tables outside this setting for exact counts and growth rates, but the qualitative picture is of a stable to modestly growing population base that supports long term housing demand, with important differences between growing metros and slower rural areas.
Section 03Jobs and Economic Anchors
The labor market is the foundation of property demand. The Bureau of Labor Statistics Economy at a Glance table for Pennsylvania, seasonally adjusted and statewide, provides a concise view of employment dynamics in early 2026. The following table summarizes key labor indicators for January, March, and June 2026, as reported by the Bureau of Labor Statistics and extracted on August 7, 2026.
| Month 2026 statewide, seasonally adjusted | Civilian labor force thousands | Employment thousands | Unemployment thousands | Unemployment rate percent | Total nonfarm jobs thousands | Total nonfarm 12 month change percent |
|---|---|---|---|---|---|---|
| January 2026 | 6,582.9 | 6,300.8 | 282.1 | 4.3% | 6,197.6 | 0.5% |
| March 2026 | 6,592.9 | 6,316.9 | 276.0 | 4.2% | 6,188.1 | 0.4% |
| June 2026 preliminary | 6,642.6 | 6,371.3 | 271.3 | 4.1% | 6,209.6 | 0.6% |
The labor force expanded by 59.7 thousand people between January and June 2026, while employment increased by 70.5 thousand over the same period. Unemployment declined by 10.8 thousand, and the unemployment rate moved down by 0.2 percentage points. Total nonfarm employment was broadly stable, with a small dip in March 2026 and then a modest increase by June 2026, and year over year growth in total nonfarm jobs improved from 0.4 to 0.6 percent between March and June 2026. These figures describe a mature economy with incremental job gains, relatively low but nontrivial unemployment, and a labor force that is still growing slightly.
Sector level data are crucial for real estate analysis because they indicate which types of space are in demand. As of June 2026, seasonally adjusted, Pennsylvania had 21.9 thousand mining and logging jobs, 261.7 thousand construction jobs, 555.9 thousand manufacturing jobs, and 1,132.0 thousand trade, transportation, and utilities jobs. Information employment stood at 87.3 thousand jobs, financial activities at 342.2 thousand jobs, professional and business services at 839.0 thousand jobs, education and health services at 1,420.7 thousand jobs, leisure and hospitality at 582.7 thousand jobs, other services at 262.0 thousand jobs, and government at 704.2 thousand jobs.
Twelve month percent change figures show that education and health services grew by 2.0 percent over the year to June 2026, leisure and hospitality by 1.9 percent, professional and business services by 0.6 percent, construction declined by 0.6 percent, manufacturing declined by 0.2 percent, trade, transportation, and utilities declined by 0.4 percent, and information declined by 3.4 percent. Government employment declined by 0.6 percent over the year. This pattern confirms that education and health care are major growth anchors, while manufacturing and some trade oriented sectors are under mild pressure, and information remains in contraction.
For real estate investors, this sector mix translates into sustained demand for housing near universities, hospitals, distribution hubs, and regional service centers, alongside more selective opportunities tied to manufacturing and information technology. Industrial and logistics space benefits from the large trade, transportation, and utilities workforce, while office demand is supported by professional and business services and financial activities. Leisure and hospitality employment underpins hotel and entertainment properties in urban and tourist markets.
Section 04Income
Income levels determine housing affordability and support for rent and retail spending. The primary quantitative sources for state and metropolitan income are the Bureau of Economic Analysis personal income by state and the Census Bureau American Community Survey, which reports household and per capita income distributions.
In this environment, the detailed Bureau of Economic Analysis tables and American Community Survey income distributions for Pennsylvania cannot be accessed in a machine readable form. The Bureau of Economic Analysis personal income by state interface relies on interactive tools that do not yield extractable numeric tables here, and the American Community Survey tables for Pennsylvania statewide and metropolitan income distributions are similarly unavailable. As a result, this review cannot state current dollar values for Pennsylvania median household income, per capita personal income, or income quintile shares.
Qualitatively, Pennsylvania income profile reflects its economic structure. Metropolitan areas such as Philadelphia, Pittsburgh, and some suburban counties combine high earning households employed in health care, higher education, finance, technology, and professional services with lower and middle income households working in logistics, manufacturing, retail, and local services. Rural and small town areas often have lower average incomes and rely on manufacturing, agriculture, energy, and government employment. This wide dispersion in incomes across regions and neighborhoods creates varied rent and price points and supports distinct segments ranging from luxury urban apartments to workforce housing and manufactured housing communities.
For investors, the lack of explicit numeric income measures in this document underscores the need to integrate external American Community Survey and Bureau of Economic Analysis data into underwriting. Submarket level income distributions are critical for determining achievable rents, rent growth potential, and tenant credit quality in different parts of the state.
Section 05Housing and Multifamily
Multifamily housing plays a central role in Pennsylvania residential landscape, particularly in urban and university centered markets. Students, young professionals, lower and moderate income households, and many older households rely on apartments and other multifamily formats.
Statewide housing data from Redfin for May 2026 provide a useful ownership benchmark. Redfin reports that the median sale price across all home types in Pennsylvania in May 2026 was 318,867 dollars, up 5.6 percent compared with May 2025. There were 43,276 homes for sale statewide in May 2026, 6.8 percent more than one year earlier. In the same month, 32.3 percent of homes sold above list price, 0.1 percentage points higher than in May 2025.
For national comparison, Redfin United States housing overview shows that in May 2026 the nationwide median sale price across all home types was 398,771 dollars, 2.0 percent higher than in May 2025, with 1,483,839 homes for sale nationwide, 0.7 percent more than a year earlier, and 24.9 percent of homes selling above list price, 0.083 percentage points lower than the prior year. The table below summarizes these comparisons for May 2026.
| Geography and scope May 2026, all home types | Median sale price dollars | Year over year change in median sale price percent | Homes for sale count | Year over year change in homes for sale percent | Homes sold above list price percent | Year over year change in share sold above list percentage points |
|---|---|---|---|---|---|---|
| Pennsylvania statewide | 318,867 | +5.6% | 43,276 | +6.8% | 32.3% | +0.1% |
| United States nationwide | 398,771 | +2.0% | 1,483,839 | +0.7% | 24.9% | -0.083% |
These figures show that Pennsylvania home prices are substantially below the national median, which supports relative affordability, but Pennsylvania prices are rising faster than the national average. Inventory is growing more quickly in Pennsylvania than in the nation as a whole, yet a larger share of homes in Pennsylvania sell above list price, indicating active competition in many local markets.
Multifamily asset performance is closely tied to these ownership trends. In markets where homeownership remains relatively affordable, some households choose to buy earlier, which can moderate demand for higher rent apartments. At the same time, student populations, older residents, and households without sufficient savings or credit for down payments continue to drive apartment demand. In Pennsylvania, university anchored markets such as State College and smaller college towns, large metropolitan centers such as Philadelphia and Pittsburgh, and employment nodes along major transportation corridors provide distinct multifamily demand profiles.
Because this environment does not provide statewide numeric series on multifamily rents, vacancy, or absorption, investors must draw on private datasets and local brokerage research to quantify performance. The available ownership data, however, indicate that Pennsylvania is in a phase of moderate price appreciation with increased supply and still meaningful buyer competition, which tends to support multifamily demand from households who are priced out of or temporarily sidelined from ownership.
Section 06Rents
Rents are the primary driver of multifamily and single family rental cash flows. Publicly, the United States Department of Housing and Urban Development publishes annual Fair Market Rents by bedroom count for every metropolitan area and county, including those in Pennsylvania. The current Fair Market Rent documentation system for fiscal year 2026 provides complete files for the state. However, in this environment, those data are packaged in large spreadsheet and comma separated value files that cannot be parsed, so this review cannot state dollar Fair Market Rent levels for one bedroom, two bedroom, or larger units in any Pennsylvania market.
Similarly, the Census Bureau American Community Survey reports median gross rent and rent distribution statistics for Pennsylvania and its counties and metropolitan areas, but those tables are accessible only through interactive interfaces and large files that cannot be read here. Private sector series from CoStar, Yardi Matrix, and RealPage that track asking and effective rents, concessions, and renewal trends for Pennsylvania multifamily markets require subscriptions and are not available.
Given these constraints, no official public numerical information on current average or median rent levels, rent growth rates, or rent to income ratios for Pennsylvania is available in this environment. The rent discussion must therefore be qualitative. In broad terms, rents in Pennsylvania largest metropolitan areas have trended upward over the past decade, with stronger growth in walkable urban neighborhoods, near universities and hospitals, and in suburbs with good schools and transportation access. Smaller cities and rural areas tend to have lower rent levels and slower growth.
For investors, the absence of precise rental figures in this document reinforces the importance of property level rent rolls, third party rent surveys, and submarket analytics when underwriting multifamily and single family rental investments in Pennsylvania.
Section 07Vacancy
Vacancy rates determine how much of the rentable inventory is producing income at any given time. The Census Bureau Housing Vacancy Survey provides regional vacancy estimates, and the American Community Survey reports rental and homeowner vacancy rates by state. Commercial vacancy rates for office, industrial, and retail properties are primarily available in private market datasets.
In this environment, the American Community Survey tables that would show Pennsylvania current rental and homeowner vacancy rates cannot be accessed, and private commercial vacancy datasets are not available. As a result, this review cannot provide numeric statewide vacancy rates for any property type.
Qualitatively, vacancy patterns in Pennsylvania mirror the diversity of its markets. Class A multifamily properties in strong submarkets of Philadelphia and Pittsburgh have experienced periods of low vacancy, while older properties in weaker locations may see higher vacancy and more tenant turnover. Office vacancy is elevated in some central business districts that face structural pressures from remote work and changing space utilization, while medical office and specialized facilities can exhibit tight occupancy. Industrial vacancy tends to be lower in major logistics corridors and around distribution hubs, and higher in older or less well located facilities. Retail vacancy is bifurcated, with essential and grocery anchored centers tending to be stable and older, nonanchored strip centers or malls facing higher vacancy.
Investors should not infer quantitative vacancy levels from this qualitative description. Asset and submarket specific vacancy data from private providers and local brokers remain essential inputs to investment decisions.
Section 08Supply Pipeline
New construction affects future competition and rent dynamics. The Census Bureau Building Permits Survey tracks residential permits by state and metropolitan area, and local planning and permitting departments record proposed and approved projects. For Pennsylvania, these sources would show annual counts of single family and multifamily units authorized, but in this environment the detailed Building Permits Survey tables are accessible only through interactive tools and downloadable formats that cannot be parsed.
Commercial development data, including square footage under construction and planned for office, industrial, and retail properties, are maintained by private market research firms and local agencies and are not numerically available here. Consequently, this review cannot state the number of multifamily units permitted in Pennsylvania in 2024 or the amount of industrial or office space currently under construction.
Qualitatively, Pennsylvania supply pipeline has been strongest in metropolitan areas and along major transportation corridors. Multifamily development has been concentrated in and around Philadelphia and Pittsburgh, as well as in select university markets and suburban nodes. Single family construction has followed job and household growth in suburban and exurban counties. Industrial development has focused on logistics corridors serving the Mid Atlantic and Northeast, while new retail construction has been more selective, with emphasis on grocery anchored and essential service centers.
For investors, the lack of statewide numeric pipeline data here means that local permitting and construction tracking must supplement this high level view. Concentrated new supply in specific submarkets can create localized rent and occupancy pressure even when statewide figures suggest balance.
Section 09Single Family Homes
Single family homes are the dominant tenure form for owner occupants in Pennsylvania and are increasingly a vehicle for institutional and scaled single family rental strategies. The Redfin statewide housing metrics provide a snapshot of pricing, supply, and demand, even though they aggregate all home types.
As noted earlier, Redfin reports that the Pennsylvania median sale price across all home types was 318,867 dollars in May 2026, 5.6 percent higher than in May 2025. The 43,276 homes for sale statewide in May 2026 represent a 6.8 percent increase from one year earlier, and 32.3 percent of homes sold above list price in May 2026, 0.1 percentage points more than the prior year. While Redfin extracted text in this environment does not provide months of supply or median days on market for Pennsylvania, the combination of rising prices, increasing inventory, and a stable share of homes selling above list points to a market that is active but not supply constrained to the degree seen in some Sun Belt or Western states.
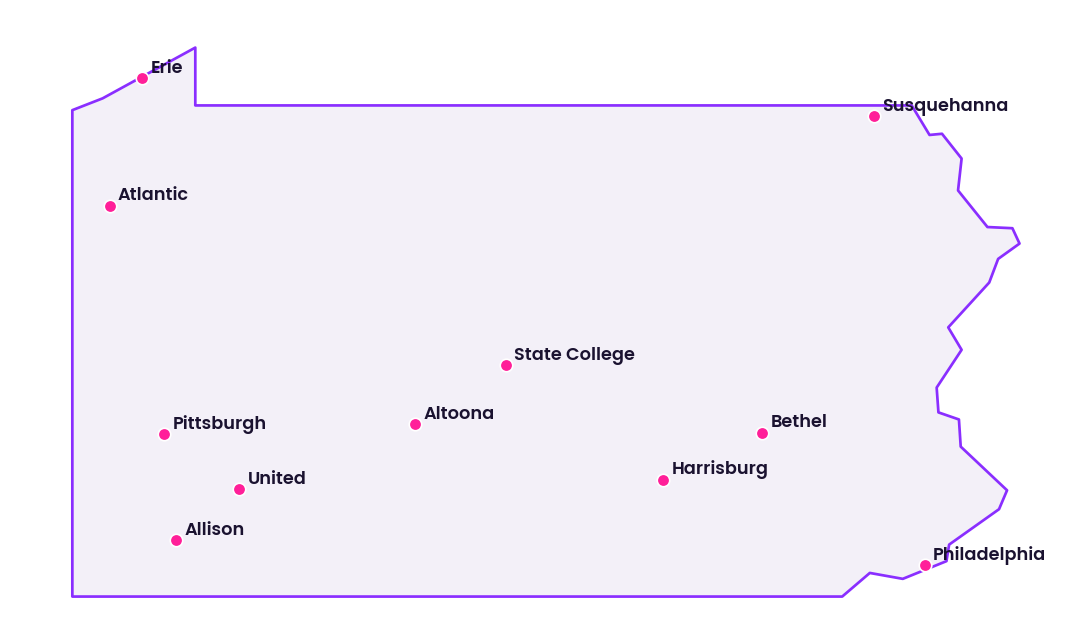
Within Pennsylvania, there is significant variation in price momentum. Redfin identifies the top ten metros in Pennsylvania with the fastest growing sales prices as of May 2026. The extracted text shows that Harrisburg recorded year over year sale price growth of 24.5 percent, Altoona 22.0 percent, Bethel Park 20.4 percent, Radnor Township 19.9 percent, Pittsburgh 17.5 percent, Monroeville 17.1 percent, Lebanon 15.4 percent, Erie 12.1 percent, Allison Park 12.0 percent, and Springfield 10.8 percent. These figures highlight that some smaller and midsize markets, as well as segments of the Pittsburgh region and certain suburbs, are experiencing much faster price growth than the statewide average.
For single family rental investors, these ownership dynamics imply a range of strategies. In markets where price growth has been very strong, acquisition yields may be compressed, but rental demand may also be robust, especially if local incomes lag price appreciation and more households are priced out of ownership. In markets with more modest price growth, there may be opportunities to acquire at lower basis while still benefiting from stable or improving local economies. Because the available data do not separate single family from other home types or provide rental specific metrics, investors must rely on targeted local data to estimate achievable rents, operating costs, and tenant demand for single family rentals.
Section 10Commercial Real Estate and Retail Centers
Commercial real estate in Pennsylvania spans office, industrial and logistics, and retail properties, including grocery anchored and neighborhood shopping centers. Detailed numeric data on commercial vacancies, asking and effective rents, absorption, and cap rates for Pennsylvania are generally available only through proprietary platforms and brokerage research and are not accessible in this environment. As a result, this section focuses on qualitative structure and drivers instead of specific percentages or rates.
Office markets in Pennsylvania major metros reflect national trends. Central business districts in Philadelphia and Pittsburgh face pressure from remote and hybrid work arrangements, with elevated vacancy in some multi tenant buildings and slower leasing velocity. Suburban office markets near transportation nodes and in mixed use environments anchored by health care and education have been relatively more resilient. The Bureau of Labor Statistics data showing 839.0 thousand professional and business services jobs and 342.2 thousand financial activities jobs statewide in June 2026, with modest positive year over year growth in these sectors, support ongoing demand for office and related space, particularly in specialized niches such as medical office, research, and high quality suburban campuses.
Industrial and logistics properties play a critical role in Pennsylvania economy due to the state central location in the eastern United States and its extensive highway and rail network. The 1,132.0 thousand trade, transportation, and utilities jobs reported by the Bureau of Labor Statistics in June 2026, even with a slight year over year decline, indicate a very large workforce in sectors closely tied to warehousing, distribution, and related activities. Modern distribution centers, cross dock facilities, and manufacturing adjacent industrial parks in eastern Pennsylvania, especially along interstate corridors, are important investment targets, with tenant demand linked to electronic commerce, consumer goods distribution, and regional supply chains.
Retail performance is mixed. Grocery anchored neighborhood centers that provide essential goods and services in stable or growing communities tend to exhibit steady occupancy and rental income. Lifestyle centers and destination retail in strong suburban and urban locations can perform well when anchored by experiential tenants and complemented by dining and entertainment. Older enclosed malls and nonanchored strip centers in weaker locations face structural challenges. The leisure and hospitality sector, with 582.7 thousand jobs statewide in June 2026 and year over year growth of 1.9 percent, contributes to demand for dining and entertainment oriented retail, especially in tourist and downtown areas.
Because this environment does not provide numeric commercial vacancy, rent, or cap rate metrics, investors must turn to private datasets and local brokerage reports for quantified insights. The sector compositions reported by the Bureau of Labor Statistics nevertheless show that Pennsylvania supports substantial demand for industrial and logistics space, selective opportunities in office, and varied outcomes in retail.
Section 11Transactions and Capital Markets
Transactions and capital flows shape pricing, yields, and liquidity. Public record systems in Pennsylvania counties track individual real estate deeds and mortgages, but statewide aggregated transaction volume and cap rate data are compiled mainly by private market research providers and are not available in this environment.
There is, therefore, no official public numerical information in this setting on total commercial or residential transaction volume in Pennsylvania in 2025 or 2026, average cap rates by property type, or typical loan to value and debt service coverage ratios for Pennsylvania properties. However, Pennsylvania is an established market for institutional, private equity, and regional investors across property types, particularly in its major metros and logistics corridors.
Debt availability and pricing for Pennsylvania assets follow national credit cycles, with lender appetite influenced by property type, tenant quality, leverage, and business plan. Higher interest rates in recent years have increased the importance of in place cash flow, modest leverage, and realistic exit assumptions. Investors should source up to date cap rate and lending data from lenders and brokerage channels when evaluating Pennsylvania investments.
Section 12Taxes
Tax policy directly affects net operating income and investor returns. Pennsylvania property tax system is largely administered at the county, municipal, and school district levels, with each jurisdiction setting its own millage rates applied to assessed values. The state also levies a personal income tax and corporate net income tax, and many localities impose additional wage and other taxes.
In this environment, numeric property tax millage rates and state and local income tax rates for Pennsylvania are not available in machine readable form, so this review cannot state specific rates or tax burden comparisons with other states. Nonetheless, investors should recognize that property tax expense can vary substantially across Pennsylvania counties and municipalities, affecting underwriting for both residential and commercial properties. School district levies, in particular, can be a material component of the overall property tax bill.
For accredited investors, careful review of existing tax bills, assessed values, and recent reassessment history is important when evaluating acquisitions. Investors should also consider how property improvements, changes in use, or reassessment cycles could alter tax burdens over an investment horizon.
Section 13Insurance
Insurance costs and availability are key components of operating expenses and risk management. The Pennsylvania Housing Finance Agency and the Pennsylvania insurance regulatory framework support a range of housing and insurance markets, but publicly accessible aggregated premium data by property type are not available in this environment.
Pennsylvania climate exposes properties to hazards including severe winter storms, ice, heavy rain events, localized flooding, and, in some areas, wind and hail. Federal Emergency Management Agency flood maps identify flood hazard areas along rivers and streams, particularly in river valleys and low lying areas. Properties in Special Flood Hazard Areas that carry federally regulated mortgages generally require flood insurance coverage. The National Flood Insurance Program and private insurers provide such coverage, with premiums influenced by elevation, construction, and mitigation measures.
Because there are no statewide numeric data on average insurance premiums for homes or commercial buildings available here, this review cannot quantify insurance cost levels or recent changes in Pennsylvania. Investors must obtain property specific quotes for hazard, liability, flood, and, where appropriate, other coverages, and should factor potential premium volatility into long term underwriting.
Section 14Landlord Tenant and Regulatory Environment
Landlord tenant law in Pennsylvania is governed primarily by state statute, including the Landlord and Tenant Act, as well as by local ordinances in some municipalities. These laws set standards for lease terms, security deposits, notice requirements, habitability, and eviction procedures. There is no statewide rent control regime in Pennsylvania, so rents for residential and commercial properties are generally set by agreement between landlords and tenants, subject to fair housing and anti discrimination laws.
Eviction procedures require appropriate notice and, when necessary, court involvement. Public data on eviction filings and outcomes in Pennsylvania are available in various court and policy research contexts but are not consolidated in a form that can be extracted here, so no numeric eviction rates are provided in this review.
For investors, Pennsylvania legal environment offers a relatively standard United States landlord tenant framework, with contract based rent setting and judicially overseen enforcement. Compliance with statutory requirements, fair housing laws, and local codes is essential. Investors should consult local counsel to understand the specifics of notice periods, security deposit limits, and remedies in the jurisdictions where they invest.
Section 15Infrastructure
Infrastructure underpins real estate performance across Pennsylvania. The state extensive highway network, rail lines, ports, and airports support commerce and commuting, particularly in the Philadelphia, Pittsburgh, and Harrisburg regions and along major interstate corridors. Public agencies publish detailed statistics on traffic volumes, bridge conditions, and public transportation ridership, but those numeric datasets are not accessible in this environment.
Qualitatively, Pennsylvania position between major population centers along the East Coast and in the Midwest, combined with its highway and rail infrastructure, supports industrial and logistics development. Urban transit systems in Philadelphia and Pittsburgh and regional rail services in southeastern Pennsylvania connect residential areas with employment centers, influencing multifamily demand along transit lines. Water, sewer, and energy infrastructure across the state vary in age and capacity, with some areas facing modernization needs that can affect development costs and timelines.
For investors, understanding infrastructure conditions and planned improvements is vital. Proximity to interstate highways, rail yards, ports, and transit hubs enhances the value of industrial, office, and multifamily properties, while areas with aging or constrained infrastructure may face higher operating or capital expenditures and greater regulatory scrutiny.
Section 16Climate and Physical Risks
Pennsylvania climate exposes real estate to a range of physical risks. Data and maps from the National Oceanic and Atmospheric Administration and the Federal Emergency Management Agency indicate that the state experiences severe winter storms, heavy rainfall, river flooding, and, in some areas, wind and hail events. Certain regions are also subject to landslide risk and, in limited areas, residual impacts from historic mining, such as subsidence.
Federal Emergency Management Agency flood maps delineate flood plains along major rivers like the Susquehanna, Delaware, and Allegheny and their tributaries. Properties in these flood zones face higher risk of flood damage and may require flood insurance. The Federal Emergency Management Agency National Risk Index aggregates multiple hazards and assigns relative risk scores to counties, highlighting where combined hazard exposure and community vulnerability are higher.
While this environment does not provide numeric probabilities or expected loss metrics for individual hazards in Pennsylvania, the qualitative profile suggests that investors should pay careful attention to flood risk in river valleys, snow and ice loads on structures in northern and higher elevation areas, and drainage and stormwater management in urban and suburban developments. Due diligence should include review of flood maps, site elevation, drainage infrastructure, and building design features that mitigate these risks.
Section 17Opportunities
Pennsylvania offers a broad set of opportunities across property types. In multifamily, urban and university centered markets with strong education and health services employment, such as parts of Philadelphia, Pittsburgh, and college towns, provide durable renter demand. Workforce housing in proximity to logistics corridors and manufacturing hubs can capture stable tenant bases tied to trade, transportation, and utilities, manufacturing, and other services.
Single family rental strategies can focus on suburban communities where home prices remain relatively affordable by national standards, yet some households prefer or require renting. The statewide median sale price of 318,867 dollars in May 2026, below the national median of 398,771 dollars, suggests that acquisition bases can be lower than in many coastal states, while the 5.6 percent year over year price growth and 32.3 percent share of homes selling above list indicate that buyer interest remains strong.
Industrial and logistics assets along Pennsylvania interstate corridors and near distribution hubs benefit from large trade, transportation, and utilities employment and the state central location in regional supply chains. Well located modern facilities with strong tenant covenants and appropriate building specifications can offer resilient cash flows.
Retail opportunities are most compelling in grocery anchored and essential service centers in stable or growing communities, where tenant sales are less sensitive to electronic commerce substitution and economic cycles. Properties in established neighborhoods and emerging mixed use districts with good transportation access can also offer balanced risk profiles.
Section 18Risks
Risks in Pennsylvania are multifaceted. Economic risks arise from sector specific headwinds, such as slow or negative job growth in manufacturing, trade, and information, as reflected in the Bureau of Labor Statistics twelve month declines in these sectors through June 2026. Macroeconomic slowdowns can dampen employment and household income growth, affecting occupancy and rent growth across property types.
Demographic risks include slow population growth or out migration in certain regions, particularly rural and former industrial areas that may face aging populations and limited new investment. While region level Census data show that the broader Middle Atlantic region has resumed modest growth after earlier declines, this does not guarantee positive trends in every part of Pennsylvania.
Capital market risks stem from interest rate volatility, credit cycles, and changes in investor risk appetite. Higher interest rates constrain leverage and can compress returns, especially in stabilized assets with modest growth prospects. Cap rates may adjust differently across property types and locations, affecting exit values.
Physical and regulatory risks include exposure to flooding and severe weather, potential changes in building codes and environmental regulations, and evolving landlord tenant rules or local housing ordinances. Insurance cost volatility related to climate and hazard risk can affect net operating income over time.
Information risk is also present. The lack of readily accessible public numeric data on rents, vacancies, and commercial property performance in this environment means that investors must take care to build complete datasets outside this setting. Underwriting based on incomplete information can misstate risk and return.
Section 19Investor Implications
For accredited investors, Pennsylvania can serve as a core and complementary allocation within a diversified United States real estate portfolio. The state large and diverse economy, extensive infrastructure, and moderate housing costs relative to coastal markets support a wide range of strategies. Multifamily and single family rental investments can target education and health care hubs, logistics corridors, and stable suburban communities. Industrial and logistics strategies can leverage the state central location and significant trade, transportation, and utilities employment base.
At the same time, investors should calibrate risk appetite to the state moderate overall job growth, sector specific challenges, and demographic variations. Underwriting should incorporate conservative assumptions for rent growth and exit pricing in slower growth regions and more optimistic but still disciplined assumptions in stronger metros and submarkets. Scenario analysis that considers economic downturns, sector specific shocks, and climate related events is prudent.
Because this review cannot provide numeric statewide rent, vacancy, or commercial property metrics, it should be seen as a framework rather than a complete dataset. Investors must supplement it with detailed property, submarket, and financing data from additional sources before making investment decisions.
Section 20Conclusion
Pennsylvania real estate markets rest on a broad, mature economic base. Bureau of Labor Statistics data show a statewide labor force of 6,642.6 thousand people and employment of 6,371.3 thousand in June 2026, with an unemployment rate of 4.1 percent and total nonfarm employment of 6,209.6 thousand jobs growing 0.6 percent year over year. Sector statistics underscore the importance of education and health services, professional and business services, trade and logistics, manufacturing, and leisure and hospitality.
Redfin housing data indicate that Pennsylvania median home sale price of 318,867 dollars in May 2026 is below the national median but is rising faster, with a 5.6 percent year over year increase and a 6.8 percent year over year increase in homes for sale. A sizable 32.3 percent of homes sold above list price, suggesting competitive conditions in many markets. These ownership dynamics, together with structural drivers from education, health care, logistics, and manufacturing, support ongoing demand for both multifamily and single family rental housing, as well as for selected office, industrial, and retail assets.
At the same time, limited population growth in parts of the state, sector specific headwinds, climate and physical risks, and capital market volatility present meaningful challenges. The absence of easily accessible statewide numeric data on rents, vacancies, and commercial performance in this environment further reinforces the need for disciplined, data driven underwriting.
For accredited investors, Pennsylvania offers both stability and differentiation. It is not a high growth, high volatility Sun Belt market, rather it is a complex set of metropolitan, suburban, and rural submarkets where careful selection, sound financing, and active asset management can yield attractive risk adjusted returns over time.
Sources
- U S Bureau of Labor Statistics, Pennsylvania Economy at a Glance,, https://www.bls.gov/eag/eag.pa.htm
- U S Bureau of Labor Statistics, Local Area Unemployment Statistics,, https://www.bls.gov/lau
- U S Bureau of Labor Statistics, Current Employment Statistics State and Area,, https://www.bls.gov/sae
- U S Census Bureau, State Population Totals and Components of Change 2020 to 2025,, https://www.census.gov/data/tables/time-series/demo/popest/2020s-state-total.html
- U S Census Bureau, Annual Population Estimates NST EST2025 ALLDATA,, https://www2.census.gov/programs-surveys/popest/datasets/2020-2025/state/totals/NST-EST2025-ALLDATA.csv
- Redfin, Pennsylvania Housing Market House Prices and Trends,, https://www.redfin.com/state/Pennsylvania/housing-market
- Redfin, United States Housing Market and Prices,, https://www.redfin.com/us-housing-market
- U S Department of Housing and Urban Development, Fair Market Rents by State, County, and Metropolitan Areas,, https://www.huduser.gov/portal/datasets/fmr.html
- Pennsylvania Housing Finance Agency, programs and housing resources,, https://www.phfa.org
- Federal Emergency Management Agency, Flood Map Service Center,, https://msc.fema.gov
- Federal Emergency Management Agency, National Risk Index,, https://hazards.fema.gov/nri
- National Oceanic and Atmospheric Administration, National Centers for Environmental Information,, https://www.ncei.noaa.gov