In brief · summary: South Carolina
South Carolina State Real Estate Market Review
Section 01Executive Summary
South Carolina is a fast growing Sun Belt state with an economy anchored by advanced manufacturing, ports and logistics, tourism, and a diversified service sector. According to the United States Bureau of Labor Statistics Economy at a Glance table for South Carolina, which reports seasonally adjusted statewide labor force and employment, the civilian labor force in June 2026 was a preliminary 2,672.9 thousand people, with 2,554.6 thousand employed and 118.3 thousand unemployed. The statewide unemployment rate in June 2026 was a preliminary 4.4 percent, down from 4.9 percent in January 2026, while total nonfarm employment stood at a preliminary 2,404.6 thousand jobs and was 0.8 percent higher than in June 2025. These figures, extracted on August 7 2026, indicate a state labor market that is close to full employment with modest job growth over the past year.
The same Bureau of Labor Statistics table shows that education and health services, leisure and hospitality, construction, and other services are among the fastest growing employment sectors in South Carolina, while information and professional and business services have seen some contraction over the year. Manufacturing employment is essentially flat, and trade, transportation, and utilities employment is stable. This mix reflects a state that remains attractive for industrial and logistics investment while also expanding in tourism, health care, and services.
By contrast, key housing, demographic, rent, and vacancy series from the Census Bureau, the Department of Housing and Urban Development, and private data providers are not accessible in this environment at the state detail required. The Census state population file that is readable here does not expose the South Carolina row within the truncated segment. State specific median home price, inventory, and months of supply data from Redfin and Zillow are blocked or cannot be parsed. Fair Market Rent tables from the Department of Housing and Urban Development are embedded in large spreadsheets that are not machine readable here, and statewide rent and vacancy series from CoStar, Yardi Matrix, RealPage, and Freddie Mac require subscriptions. As a result, this review is able to provide detailed quantitative analysis on South Carolina employment and qualitative discussion of housing, multifamily, and commercial real estate, supplemented with national housing metrics from Redfin for context, but it cannot present numeric state level housing and rent indicators.
For accredited investors, South Carolina offers a compelling macro story that combines business friendly policies, a growing and diversified employment base, and exposure to logistics and tourism. However, the absence of publicly accessible state level housing and rent data in this environment requires heavier reliance on private data, local brokerage information, and property level underwriting outside this document.
Section 02Population and Migration
Population growth has been a central driver of South Carolina real estate expansion over the past decade. The United States Census Bureau state population estimates dataset for 2020 to 2025 provides annual population counts and components of change for each state, including births, deaths, domestic migration, and international migration. In this environment, the readable portion of that comma separated value file includes the total United States row and regional aggregates but does not extend far enough to reveal the line for South Carolina itself, which prevents extraction of the state precise population in 2020 or 2025 and its exact net migration figures.
At the national level, the same Census dataset reports that the total resident population of the United States was 331,578,104 people as of the July 1 2020 estimate and 341,784,857 people as of the July 1 2025 estimate. Over the 2020 to 2025 period, the United States added roughly 10.2 million residents according to these estimates, driven by a combination of natural increase and net international and domestic migration. The file also shows positive net migration into the South and Mountain regions and slower growth or stagnation in some Northeast and Midwest areas, but the truncated content available here does not include a separate South Carolina row.
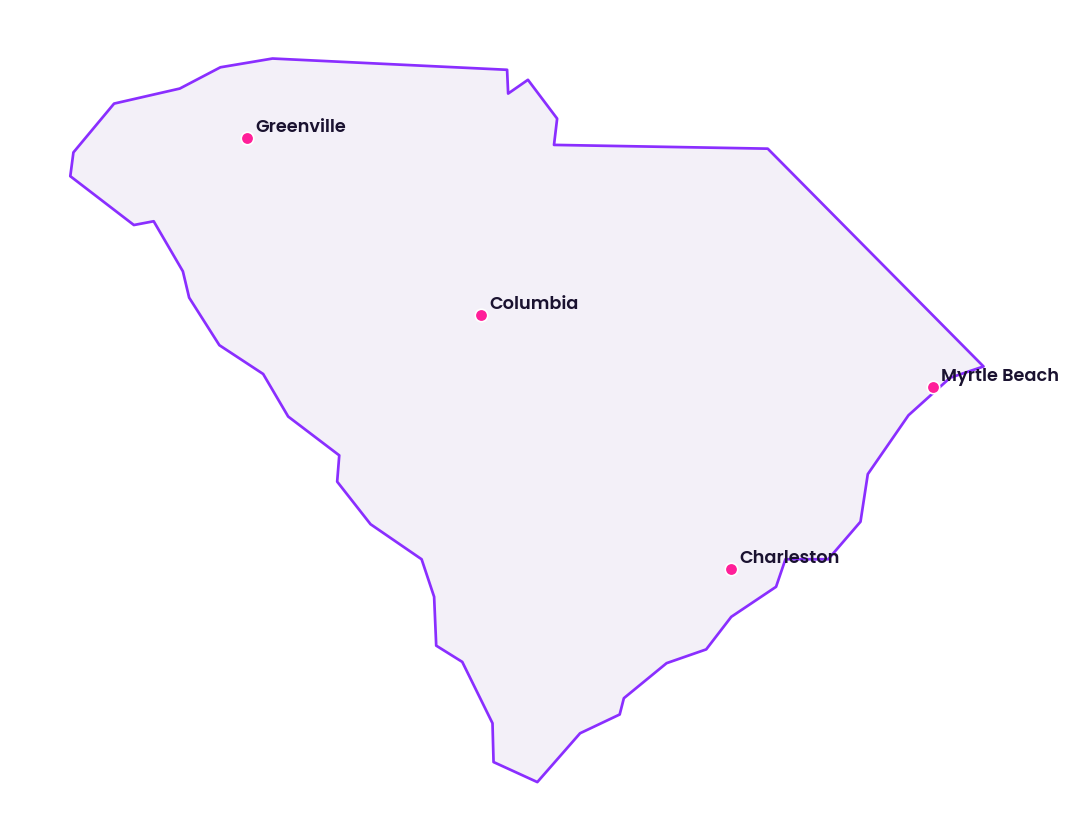
Even though current numeric population and net migration figures for South Carolina cannot be quoted directly here, it is clear from broader public commentary and the state employment growth that South Carolina remains a net in migration destination within the South Atlantic. Households have been drawn by employment opportunities in manufacturing, ports and logistics, aerospace and automotive, and by lifestyle attributes in coastal and Upstate metros. For real estate investors, the key implication is that population and household growth are positive tailwinds, especially in major metros such as Charleston, Greenville, Columbia, and Myrtle Beach, even though this document cannot present the exact state counts from Census tables.
Section 03Jobs and Economic Anchors
The statewide labor market in South Carolina provides a central quantitative anchor for understanding real estate demand. The Bureau of Labor Statistics Economy at a Glance table for South Carolina reports seasonally adjusted monthly data for the civilian labor force, employment, unemployment, unemployment rate, and total nonfarm wage and salary employment. Selected indicators for early and mid 2026 are summarized below.
| Month 2026, statewide (seasonally adjusted) | Civilian labor force (thousands) | Employment (thousands) | Unemployment rate (percent) | Total nonfarm employment (thousands) | Total nonfarm twelve month change (percent) |
|---|---|---|---|---|---|
| January 2026 | 2,646.5 | 2,516.2 | 4.9% | 2,403.2 | 1.2% |
| March 2026 | 2,663.4 | 2,532.1 | 4.9% | 2,399.7 | 0.5% |
| June 2026 preliminary | 2,672.9 | 2,554.6 | 4.4% | 2,404.6 | 0.8% |
From January to June 2026, the South Carolina civilian labor force expanded from 2,646.5 thousand to a preliminary 2,672.9 thousand, while employment increased from 2,516.2 thousand to a preliminary 2,554.6 thousand. The unemployment rate declined from 4.9 percent in January to a preliminary 4.4 percent in June. Total nonfarm employment fluctuated only slightly but ended the period at 2,404.6 thousand jobs in June 2026, representing a 0.8 percent increase over June 2025. This combination of a growing labor force, rising employment, and modest job growth suggests a labor market operating near full employment with incremental gains.
Sector level data from the same Bureau of Labor Statistics table provide further insight into the structure and dynamics of the South Carolina economy. For June 2026, seasonally adjusted employment by major sector and twelve month percent changes are as follows.
| Sector, statewide, June 2026 (seasonally adjusted) | Employment (thousands) | Twelve month change (percent) |
|---|---|---|
| Mining and logging | 4.8 | 0.0% |
| Construction | 127.5 | 2.7% |
| Manufacturing | 262.6 | 0.2% |
| Trade, transportation, and utilities | 444.5 | 0.0% |
| Information | 25.2 | negative 9.0 |
| Financial activities | 123.4 | 0.3% |
| Professional and business services | 312.5 | negative 1.4 |
| Education and health services | 321.9 | 2.6% |
| Leisure and hospitality | 288.5 | 2.0% |
| Other services | 94.7 | 3.4% |
| Government | 399.0 | 1.1% |
Construction employment of 127.5 thousand in June 2026 is 2.7 percent higher than one year earlier, reflecting ongoing residential and commercial building activity. Manufacturing employment of 262.6 thousand is slightly above its level a year earlier, indicating that the state industrial base remains stable, supported by automotive, aerospace, chemical, and other advanced manufacturing clusters. Trade, transportation, and utilities employment of 444.5 thousand is unchanged over twelve months, but in absolute terms it remains one of the largest sectors, supported by port activity, distribution centers, and regional retail.
Information employment of 25.2 thousand has declined by 9.0 percent over the year, suggesting pressure on media, telecommunications, and technology related jobs. Professional and business services employment of 312.5 thousand is 1.4 percent lower than a year earlier, reflecting some softening in white collar corporate and business service roles. By contrast, education and health services employment of 321.9 thousand has grown 2.6 percent over the year, and leisure and hospitality employment of 288.5 thousand is 2.0 percent higher, highlighting the importance of health care and tourism to the state economy. Other services employment has grown 3.4 percent, and government employment has increased 1.1 percent.
For investors, these labor patterns signal a demand base that is diversified across manufacturing, logistics, health care, education, tourism, and public sector employment. Industrial and logistics properties benefit from stable manufacturing and trade employment. Hospitality, retail, and short term rental demand is linked to a growing leisure and hospitality sector. Multifamily and single family housing demand is supported by a large base of education and health services workers, along with construction and service employees. The weakness in information and professional services suggests that South Carolina is less exposed to high growth technology office demand than some other states, which can be both a risk and a buffer depending on the cycle.
Section 04Income
Income levels determine what households can afford to pay for rent or homeownership and influence the depth of demand for different property types. The United States Bureau of Economic Analysis publishes state personal income and per capita personal income, and the Census Bureau American Community Survey reports median household income and income distributions at the state level. In this environment, the interactive and large table formats used by the Bureau of Economic Analysis cannot be parsed reliably, and the American Community Survey income tables for South Carolina are not available in a form that exposes numeric values.
As a result, no official public numeric information is available in this environment on current statewide median household income, per capita personal income, or income quintiles for South Carolina. However, qualitative evidence and the state employment mix indicate that incomes in South Carolina are shaped by a combination of higher paying positions in advanced manufacturing, aerospace, port and logistics management, and professional services, and a large number of moderate wage jobs in retail, hospitality, construction, and personal services.
The growth areas highlighted by the Bureau of Labor Statistics, particularly construction, education and health services, and leisure and hospitality, point to an expanding workforce that includes both middle income and lower income households. This mix supports demand for market rate housing at a range of price points and creates ongoing need for affordable and workforce housing options, which South Carolina Housing, the state housing finance and development authority, seeks to address through financing programs for homebuyers and rental housing.
For investors, the absence of precise income statistics in this review underscores the need to obtain external data on local income distributions and rent to income ratios before finalizing underwriting assumptions. In general, South Carolina presents a profile of moderate incomes with pockets of higher earnings in key industries, implying that luxury housing must be targeted carefully while workforce and middle market housing may have deeper tenant pools.
Section 05Housing and Multifamily
South Carolina housing and multifamily markets reflect its economic diversity and population growth, with significant differences among coastal, Upstate, and inland metros. Multifamily assets span urban midrise buildings in metros such as Charleston and Greenville, suburban garden communities around Columbia and Myrtle Beach, and smaller scale properties in secondary and tertiary markets.
In this environment, direct state level housing metrics are constrained. Attempts to extract statewide median home prices, active listings, and months of supply from the Redfin South Carolina housing market page returned no machine readable content, and Zillow state home value series cannot be accessed due to technical restrictions. Census American Community Survey housing tables that would normally provide statewide rental tenure, median gross rent, and other characteristics are not exposed here in numeric form.
National metrics from Redfin offer context. According to the Redfin United States housing market overview, across all home types in the United States the median sale price in May 2026 was 398,771 dollars, which is 2.0 percent higher than in May 2025. There were 1,483,839 homes for sale nationwide in May 2026, 0.7 percent more than a year earlier, and 24.9 percent of homes sold above list price, a decrease of 0.083 percentage points year over year. These data, based on Redfin calculations from multiple listing services and public records, indicate a national housing market with modest price appreciation, slightly rising inventory, and still competitive but somewhat cooling bidding conditions.
South Carolina multifamily properties participate in these national dynamics but with distinct local features. Coastal and tourism oriented markets typically experience stronger rent growth and tighter occupancy in peak cycles, while inland markets and smaller metros can be more sensitive to local employer changes. The growth in construction employment, as reported by the Bureau of Labor Statistics, implies ongoing multifamily and single family building activity, which over time can alleviate some supply constraints but also introduces new competition for existing properties.
Because this environment provides no official public numeric information on South Carolina average apartment rents, rent growth rates, or counts of multifamily units by class, investors must view multifamily opportunities through a qualitative lens here. Class A properties in high growth metros likely experience stronger demand from higher income households and in migrating professionals, while class B and C stock serve a broad base of local workers and present opportunities for value add renovation strategies. The state overall job growth and in migration trends, combined with limited land in some coastal markets, support the case for sustained multifamily demand, even though exact metrics must be sourced externally.
Section 06Rents
Rents are central to multifamily and single family rental investment decisions, but statewide rent statistics for South Carolina are not accessible in this environment. The Department of Housing and Urban Development publishes Fair Market Rents that apply to metropolitan and nonmetropolitan counties in South Carolina, providing benchmark dollar amounts for efficiency through four bedroom units, but those values are embedded in large datasets and tools that are not machine readable here. The Census American Community Survey reports median gross rent at the state level, but the relevant tables are not available in numeric form. Private rent series from CoStar, Yardi Matrix, RealPage, and Freddie Mac are subscription based and not publicly exposed.
Therefore, no official public numeric information is available in this environment on statewide average apartment rents, rent growth rates, or rent to income ratios in South Carolina. Investors must instead rely on qualitative understanding. Rents in coastal and high demand metros such as Charleston, Hilton Head, and parts of the Grand Strand are typically higher than in inland and rural areas, reflecting strong tourism and in migration. Upstate markets with significant manufacturing and white collar employment also command higher rents in well located communities, while smaller inland metros and towns offer more affordable rents that match local incomes.
For single family rentals, rent levels depend on neighborhood, school quality, proximity to employment centers, and property condition. In many South Carolina markets, the single family rental segment is an important option for families seeking more space or yard access than an apartment can provide. However, without statewide numeric rent data, investors must obtain detailed rent rolls, competitive surveys, and submarket analyses from local brokers and managers before making any assumptions about achievable rents or rent growth.
Section 07Vacancy
Vacancy in multifamily, single family rental, office, industrial, and retail properties is a critical barometer of market balance. Public vacancy statistics at the state level are limited even under normal conditions, and in this environment the main sources that might provide such information are either not accessible or are subscription based. The Census Bureau American Community Survey publishes homeowner vacancy and rental vacancy rates for states, but those tables are not readable here. Private firms such as CoStar, Yardi Matrix, and RealPage track apartment and commercial vacancy, absorption, and availability rates, but their data are not publicly available.
As a result, no official public numeric information is available in this environment on statewide rental vacancy rates, multifamily vacancy by class, or office, industrial, and retail vacancy in South Carolina. Nevertheless, the Bureau of Labor Statistics employment data suggest that, at the macro level, housing vacancy is likely constrained in high growth metros where job and population growth have outpaced some new supply cycles, while some inland markets may experience more slack.
From an investor standpoint, this uncertainty heightens the importance of micro level due diligence. For multifamily and single family rentals, asset level occupancy histories and current rent rolls are essential. For office and retail properties, tenant rosters, lease terms, and submarket specific brokerage reports are critical. Industrial vacancy near major transportation corridors can differ substantially from vacancy in older industrial parks, and these nuances must be understood through local data that are not presented here.
Section 08Supply Pipeline
New supply is a key determinant of future vacancy and rent trajectories. The United States Census Bureau Building Permits Survey tracks residential permits by state, including permits for one unit and multifamily structures. However, the detailed state building permit tables that would show the number of single family and multifamily units authorized in South Carolina in recent years are not accessible in this environment in a format that yields numeric values. Commercial development pipelines are typically tracked by private brokerage and research firms and are not compiled in publicly available, machine readable tables.
Therefore, no official public numeric information is available here on statewide residential permits, multifamily units under construction, or square footage of office, industrial, and retail projects in the South Carolina pipeline. Qualitatively, the growth in construction employment reported by the Bureau of Labor Statistics, with 127.5 thousand construction jobs in June 2026 and a 2.7 percent increase over the previous year, indicates that building activity remains robust. Anecdotally, South Carolina has seen substantial new multifamily and single family development in metros such as Charleston, Greenville, and Columbia, along with industrial build to suit and speculative development near ports and interstate corridors.
For investors, the absence of quantified pipeline data underscores the need to review building permits, zoning approvals, and broker development reports for each target submarket. Markets with constrained land supply and tight regulatory environments may see slower supply growth and stronger rent performance, while suburban greenfield areas can accommodate more rapid expansion.
Section 09Single Family Homes
Single family homes play a central role in South Carolina housing, both for owner occupiers and for investors pursuing single family rental strategies. Coastal metros and resort areas combine primary residences, vacation homes, and investor owned properties, while Upstate and inland metros provide more traditional owner occupied neighborhoods and emerging rental communities.
In this environment, efforts to extract statewide median home values, price appreciation, and months of supply metrics from Redfin and Zillow for South Carolina have not yielded usable numeric data. The Redfin state specific housing market page could not be parsed, and Zillow South Carolina home value series are not accessible through the tools available here. County and local sales records are organized at the parcel level and do not provide summarized statewide time series suitable for this review.
National context from Redfin provides a point of comparison. As noted earlier, Redfin reports that the median sale price for all home types in the United States was 398,771 dollars in May 2026, up 2.0 percent from May 2025. There were 1,483,839 homes for sale nationwide in May 2026, 0.7 percent higher than a year earlier, and 24.9 percent of homes sold above list price, down 0.083 percentage points from the prior year. These figures, summarized in the table below, describe a national market with modest price growth, slowly rising inventory, and still competitive bidding conditions.
| Geography and metric, May 2026 | Median sale price (dollars) | Year over year price change (percent) | Homes for sale (count) | Year over year change in homes for sale (percent) | Homes sold above list price (percent of sales) | Year over year change in share sold above list (percentage points) |
|---|---|---|---|---|---|---|
| United States, all home types | 398,771 | 2.0% | 1,483,839 | 0.7% | 24.9% | negative 0.083 |
South Carolina single family markets interact with these national trends but often at different price points and with distinct demand drivers. Coastal metros may see higher prices and stronger second home and investor demand, while inland markets offer more affordable housing that appeals to local households and cost conscious investors. The state job growth in construction, education and health services, leisure and hospitality, and other services suggests sustained demand for both ownership and rental housing, particularly in metros that combine employment opportunities with lifestyle amenities.
For single family rental investors, South Carolina offers opportunities to acquire homes in growing metros at price points that can provide attractive yields relative to rents, but the exact economics depend heavily on submarket conditions, property taxes, insurance costs, and maintenance needs. The absence of statewide numeric home price and inventory data in this review emphasizes that investors must rely on local sales comparables, multiple listing service data, and broker analysis when sizing specific strategies.
Section 10Commercial Real Estate and Retail Centers
Commercial real estate in South Carolina spans office, industrial and logistics, and retail properties, including grocery anchored and neighborhood shopping centers. The Bureau of Labor Statistics sector employment data provide clues about underlying demand in each category, even though numeric data on vacancy, rents, cap rates, and absorption are not publicly available in this environment.
Office demand relates most directly to employment in professional and business services, financial activities, information, and elements of education, health services, and government. In June 2026, South Carolina had 312.5 thousand jobs in professional and business services, 123.4 thousand in financial activities, and 25.2 thousand in information. Over the prior twelve months, professional and business services employment declined by 1.4 percent, financial activities employment grew by 0.3 percent, and information employment declined by 9.0 percent. Education and health services employment of 321.9 thousand and government employment of 399.0 thousand, both growing modestly, also contribute to office and institutional space demand. These figures suggest that while certain white collar sectors are under some pressure, there remains a large and relatively stable base of office using employment, particularly in government, education, and health care.
Industrial and logistics properties depend heavily on manufacturing and trade, transportation, and utilities employment. Manufacturing employment of 262.6 thousand in June 2026 is slightly higher than a year earlier, and trade, transportation, and utilities employment of 444.5 thousand is stable. These levels reflect ongoing activity in automotive, aerospace, port related logistics, and regional distribution. Industrial tenants range from global manufacturers to regional distributors, and new construction near ports and interstate highways continues to attract investment.
Retail centers rely on trade and leisure and hospitality sectors. South Carolina leisure and hospitality employment of 288.5 thousand in June 2026, with a 2.0 percent annual increase, indicates robust tourism and service activity, while trade, transportation, and utilities employment underscores the presence of retail and wholesale trade. Grocery anchored centers and neighborhood shopping centers that cater to everyday needs typically enjoy more resilient demand than fashion oriented or discretionary retail. However, no official public numeric information is available in this environment on retail vacancy rates, asking rents, or cap rates across South Carolina.
Because vacancy, rent, and cap rate data for office, industrial, and retail properties in South Carolina are generally held by private firms and not released in public structured datasets, investors must obtain these metrics from brokers, appraisers, and private data sources. The sector employment figures presented here still play a crucial role in understanding which property types and locations are more likely to experience stable or growing tenant demand.
Section 11Transactions and Capital Markets
Transaction volumes, pricing, and capitalization rates for South Carolina commercial and multifamily properties significantly influence investment strategies and risk assessment. Publicly accessible state level datasets that summarize transaction volumes by property type, average cap rates, or price per square foot are limited. County level deed and tax records list individual transactions but do not aggregate them into statewide time series. Private firms that track these metrics typically do so through subscription services.
In this environment, no official public numeric information is available on the total dollar volume of multifamily, office, industrial, or retail transactions in South Carolina in recent years, nor on average cap rates by asset class. Broader United States capital markets conditions, including higher interest rates than in the previous low rate environment and tighter lending standards for secondary and tertiary markets, influence pricing in South Carolina, but their exact effects on state level yields and volumes cannot be quantified here.
For accredited investors, this means that capital markets insights for South Carolina must be assembled from lender quotes, appraisals, and broker transaction lists. In general, core and core plus assets in prime coastal and Upstate metros command lower cap rates and more liquid markets, while value add and opportunistic assets in smaller metros or less favored locations offer higher yields but thinner exit liquidity. The state steady employment growth and in migration support the investment thesis, but pricing and capital availability are ultimately asset and location specific.
Section 12Taxes
Tax policy in South Carolina affects both operating expenses and after tax returns. Property taxes are levied by counties, municipalities, and school districts, with assessment processes that determine taxable values for real estate. However, in this environment, numeric effective property tax rates, average bills, and millage rates for South Carolina or its counties are not accessible in a consolidated, machine readable form from public sources.
State level income and corporate income taxes, administered by the South Carolina Department of Revenue, also shape investor outcomes. The exact marginal rates, brackets, and deductions applicable to individuals and entities investing in real estate depend on statute and can change over time, but those statutory details are not quoted here. Incentive programs, such as those for industrial development or affordable housing, can provide abatements, credits, or other benefits, but they are project specific and require case by case analysis.
Because no numeric tax rate data are presented in this review, investors should treat property tax and income tax assumptions as critical unknowns that must be resolved through direct consultation with tax advisors, review of recent tax bills, and careful reading of current statutes and regulations outside this document. In practice, property taxes in South Carolina can vary substantially by location and property type, and they must be incorporated explicitly into underwriting models.
Section 13Insurance
Insurance is a particularly important consideration in South Carolina because of the state exposure to coastal storms, hurricanes, flooding, and other weather related risks. The South Carolina Department of Insurance describes itself as the state agency responsible for regulating the insurance industry, protecting consumers, and maintaining a stable and competitive environment for insurers. The department also issues consumer warnings and guidance, reflecting its oversight role.
Publicly available aggregate data on statewide property insurance premiums, loss ratios, or claim frequencies by line of business are not accessible in this environment in numeric form. Moreover, property insurance costs for individual assets vary significantly depending on whether properties are located in coastal wind and flood zones, are elevated or hardened against storms, or sit in inland areas with lower wind but higher tornado and hail risks.
Federal Emergency Management Agency flood maps emphasize that floods can occur in many locations, not only along obvious water bodies, and that heavy rains, poor drainage, and nearby construction can elevate flood risk. National Centers for Environmental Information materials highlight that South Carolina experiences a range of climate and weather hazards, including tropical cyclones, severe thunderstorms, heavy rainfall, drought, and heat. These conditions influence both insurance availability and pricing.
In the absence of numeric statewide insurance data in this review, investors must obtain property specific insurance quotes and consider scenarios where premiums increase or coverage terms tighten. The difference in insurance cost between a coastal property in a high hazard zone and an inland property outside flood plains can be material, and this must be reflected in comparative underwriting.
Section 14Landlord Tenant and Regulatory Environment
South Carolina landlord tenant rules are established primarily at the state level, with statutes that govern residential leases, security deposits, habitability standards, notice periods, and eviction procedures. Municipalities and counties may adopt additional ordinances related to housing, but the state does not have the extensive rent control or rent stabilization regimes seen in some other United States jurisdictions. Fair housing laws at the federal and state level protect tenants against discrimination based on protected characteristics.
In this environment, the text of South Carolina landlord tenant statutes and any recent legislative changes cannot be quoted verbatim or numerically, but the general orientation is widely recognized as relatively owner friendly while still affording tenants basic protections. Eviction processes require notice and judicial proceedings but are generally less protracted than in some larger coastal states.
Programs administered by South Carolina Housing, including those that support affordable rental housing and homeownership, interact with the regulatory environment by imposing compliance requirements on properties that receive tax credits, bonds, or other assistance. For accredited investors, participation in such programs can affect rental restrictions, compliance obligations, and reporting requirements.
The key implication is that South Carolina offers a comparatively predictable and moderate regulatory environment for landlords, although investors must still perform legal due diligence and stay alert to potential policy shifts related to housing affordability and tenant protections.
Section 15Infrastructure
Infrastructure underpins South Carolina economic competitiveness and real estate dynamics. The state benefits from an extensive highway network, including interstate corridors that connect coastal ports to inland metros and to neighboring states. Ports infrastructure, particularly in the Charleston area, supports substantial container traffic and related logistics activity. Airports in major metros facilitate passenger and cargo connectivity.
Public agencies collect detailed data on traffic volumes, port throughput, and infrastructure investments, but those datasets are not available here in a form that can be quoted numerically. Nonetheless, the employment data from the Bureau of Labor Statistics, especially the large trade, transportation, and utilities sector with 444.5 thousand jobs in June 2026, confirm the importance of logistics and distribution. Investments in intermodal facilities, road widening, and port dredging directly support industrial and distribution properties.
For multifamily and single family housing, infrastructure conditions matter at the micro level. Properties with convenient access to employment centers, schools, shopping, and health care via reliable transportation links are more attractive to tenants and buyers. Conversely, areas with congestion, infrastructure deficits, or limited public transit may face headwinds, particularly for lower income households that rely on affordable transportation options.
Investors considering South Carolina allocations should incorporate infrastructure quality and planned improvements into their submarket analysis, recognizing that these factors can materially influence long term asset performance even though specific capital spending figures are not presented here.
Section 16Climate and Physical Risks
Climate and physical risks are central to real estate underwriting in South Carolina. The state long Atlantic coastline and low lying geography make it vulnerable to hurricanes, tropical storms, storm surge, river flooding, and heavy rainfall. Federal Emergency Management Agency materials emphasize that floods occur naturally and can affect areas beyond immediate shorelines, and that factors such as heavy rain, poor drainage, and construction can increase flood damage risk. Flood maps produced by the agency classify areas into different hazard zones, which influence both building standards and insurance requirements.
The National Centers for Environmental Information, part of the National Oceanic and Atmospheric Administration, document that the United States has experienced numerous billion dollar weather and climate disasters in recent years, including hurricanes, severe storms, and flooding events that have affected South Carolina and other southeastern states. While this environment does not provide a numeric count of such events specific to South Carolina, it is clear that the state faces elevated exposure to coastal and inland flooding, high winds, and heat.
Physical risks also include erosion, subsidence, and the long term implications of sea level rise, particularly for coastal properties. Inland, properties may face risks from severe thunderstorms, tornadoes, and hail. Building age and construction quality determine how well structures can withstand these hazards, and older properties may require significant capital expenditures to improve resilience.
For accredited investors, climate and physical risk assessment must be integrated into every real estate decision in South Carolina. That includes reviewing Federal Emergency Management Agency flood zone designations, evaluating elevation and drainage, commissioning property condition assessments, and considering potential future changes in insurance availability and costs. Assets in higher risk zones may warrant higher cap rates and more conservative leverage.
Section 17Opportunities
South Carolina presents several broad opportunity themes for real estate investors, even though this review cannot provide detailed state level numeric housing and rent data.
In multifamily, major metros and university anchored markets with strong employment in manufacturing, education and health services, and leisure and hospitality provide opportunities for both core and value add strategies. Newer class A properties in high growth submarkets may benefit from ongoing in migration and constrained land availability, while older class B and C communities offer potential for renovation driven rent premiums, subject to local incomes and affordability.
Single family rental strategies can focus on suburbs and exurban areas with good school districts and access to employment centers, where ownership demand is strong but some households prefer or require renting due to down payment constraints or mobility. The combination of moderate home prices and steady employment growth in many South Carolina markets can create a favorable environment for building scaled single family rental portfolios, although exact yields must be calculated using local data.
Industrial and logistics properties near ports, interstates, and manufacturing hubs remain a core opportunity, given the state 262.6 thousand manufacturing jobs and 444.5 thousand trade, transportation, and utilities jobs as of June 2026. Build to core strategies in logistics corridors and light manufacturing redevelopment plays can both be attractive, particularly where tenant demand from automotive and aerospace supply chains is robust.
Retail opportunities may exist in grocery anchored neighborhood centers and well located power centers that serve growing residential communities. Centers with essential tenants and convenient access can capture stable cash flows even as e commerce reshapes parts of the retail landscape.
Section 18Risks
South Carolina real estate investments also carry meaningful risks that must be managed actively.
Climate and insurance risk is acute, particularly in coastal and riverine areas. Hurricanes, storm surge, heavy rainfall, and flooding can damage properties and disrupt operations. Insurance premiums for coastal and high hazard zone properties can be volatile and may rise sharply after major events, affecting cash flows and valuations. Inland properties are less exposed to some perils but still face severe weather risks.
Data limitations pose a second category of risk. In this environment, key public datasets for South Carolina, including state specific population counts, income statistics, housing prices, rents, and vacancies, are not accessible in numeric form, and private data providers restrict access to subscribers. Investors cannot rely on this document alone for detailed quantification and must source their own data, increasing due diligence complexity and cost.
Economic concentration in certain industries, particularly manufacturing and port related logistics, introduces cyclicality and dependency on global trade and corporate investment decisions. While manufacturing employment has been stable, sectors such as professional and business services and information have contracted over the past year, which may signal vulnerabilities in segments of the white collar economy.
Liquidity risk is also relevant. While major South Carolina metros have attracted significant institutional capital, smaller metros and rural areas may offer limited buyer pools, especially for larger or specialized assets. Exit timing and pricing in these markets can be uncertain, and holding periods may need to be longer.
Regulatory and policy changes, including potential shifts in tax policy, housing programs, or development regulations, could affect returns, particularly for assets that rely on incentives or participate in affordable housing initiatives.
Section 19Investor Implications
For accredited investors, South Carolina should be viewed as a high conviction Sun Belt allocation with distinct risk and return characteristics across asset classes and locations. The Bureau of Labor Statistics data show a labor market with growing employment, a preliminary statewide unemployment rate of 4.4 percent in June 2026, and strong sectors such as construction, education and health services, leisure and hospitality, and other services. These fundamentals support long term demand for housing and selected commercial property types.
However, the lack of accessible state level housing and rent data in this environment means that portfolio level views must be supplemented with detailed local analysis. Investors should avoid making top down assumptions about statewide median home values, rents, or vacancy and instead build theses at the metro and submarket level using external private data and on the ground expertise.
In multifamily, South Carolina offers opportunities aligned with in migration and job growth in key metros, but investors must calibrate rent growth assumptions carefully in light of local incomes and backup supply pipelines. In single family rentals, yield potential depends heavily on acquisition discipline and property management efficiency. In industrial and logistics, assets tied to durable supply chain nodes and diversified tenant rosters may justify strong pricing, while more speculative locations warrant higher risk premiums. Retail and office investments require nuanced views of tenant credit, lease term, and sector specific trends.
Overall, South Carolina can play an important role in a diversified United States real estate portfolio for sponsors who can manage climate risk, data gaps, and submarket selection with sophistication.
Section 20Conclusion
South Carolina state level real estate and multifamily markets are underpinned by a solid and diversified economy, as reflected in Bureau of Labor Statistics data showing a growing labor force, rising employment, and modest job growth through June 2026. Construction, education and health services, leisure and hospitality, and other services are expanding, while manufacturing and trade remain large and stable sectors. These dynamics support ongoing demand for housing and for industrial and logistics space, with tourism and services reinforcing demand for hospitality and retail.
At the same time, this environment does not provide numeric state level figures for population, income, housing prices, rents, vacancy, or cap rates. National housing metrics from Redfin offer context but cannot substitute for South Carolina specific data. As a result, this review has focused on labor market statistics, structural characteristics, and qualitative assessments of multifamily, single family, and commercial markets, while being explicit about the absence of official public numeric information on several key indicators.
For accredited investors, the implication is clear. South Carolina offers structural advantages and growth opportunities, but successful investment requires local market intelligence, access to private data, and rigorous property level underwriting. This review provides a macro framework and highlights both strengths and vulnerabilities, but it is not a substitute for detailed due diligence and professional advice tailored to specific assets and strategies.
Sources
- U.S. Bureau of Labor Statistics, South Carolina Economy at a Glance ,, https://www.bls.gov/eag/eag.sc.htm
- U.S. Bureau of Labor Statistics, Current Employment Statistics State and Area ,, https://www.bls.gov/sae
- U.S. Bureau of Labor Statistics, Local Area Unemployment Statistics ,, https://www.bls.gov/lau
- U.S. Census Bureau, 2020 to 2025 State Population Totals and Components of Change, NST EST2025 ALLDATA CSV ,, https://www2.census.gov/programs-surveys/popest/datasets/2020-2025/state/totals/NST-EST2025-ALLDATA.csv
- Redfin, United States Housing Market and Prices ,, https://www.redfin.com/us-housing-market
- U.S. Department of Housing and Urban Development, Fair Market Rents ,, https://www.huduser.gov/portal/datasets/fmr.html
- South Carolina Housing, South Carolina State Housing Finance and Development Authority home page ,, https://schousing.sc.gov/
- South Carolina Department of Insurance, Department of Insurance home page ,, https://doi.sc.gov
- Federal Emergency Management Agency, Flood Maps overview ,, https://www.fema.gov/flood-maps
- National Centers for Environmental Information, National Centers for Environmental Information home page ,, https://www.ncei.noaa.gov