In brief · summary: South Dakota
South Dakota State Real Estate Market Review
Section 01Executive Summary
South Dakota enters mid 2026 with a very tight labor market and modest overall job growth. According to the United States Bureau of Labor Statistics economy at a glance table for South Dakota, the statewide civilian labor force on a seasonally adjusted basis was 493.5 thousand people in January 2026 and 488.7 thousand people in June 2026. Employment over the same period dipped slightly from 482.5 thousand to 478.8 thousand, and unemployment declined from 11.0 thousand to 9.9 thousand. The statewide unemployment rate moved from 2.2 percent in January 2026 to 2.0 percent in June 2026, which underscores that South Dakota continues to operate near full employment even as some sectors contract.
Total nonfarm wage and salary employment in South Dakota was 470.0 thousand jobs in January 2026 and 471.5 thousand jobs in June 2026, seasonally adjusted. The twelve month change in total nonfarm employment ranged from zero percent in January to 0.5 percent in June 2026. Sector detail from the same Bureau of Labor Statistics table shows that leisure and hospitality employment grew around six percent over the year as of June 2026, education and health services grew about two percent, and construction employment moved from slight contraction in early 2026 to low single digit growth by May and June. In contrast, manufacturing, trade and transportation, information, financial activities, professional and business services, and government all posted negative year over year job changes through mid 2026.
State income trends add another piece to the picture. The United States Bureau of Economic Analysis personal income by state release notes that personal income increased in forty nine states and the District of Columbia in the first quarter of 2026, with state level changes ranging from a 22.4 percent increase in North Dakota to a 23.9 percent decrease in Hawaii. Because only one state experienced a decrease and that state was Hawaii, South Dakota lies in the group of states with rising personal income in early 2026, which provides a modest macro tailwind for housing demand.
However, there are important data gaps. Current state level population and household counts from the Census Bureau, detailed multifamily rent and vacancy metrics, and city and county level commercial real estate statistics are not accessible in this environment. The United States Department of Housing and Urban Development Fair Market Rent data for South Dakota are available only as spreadsheet files that cannot be parsed here, and proprietary multifamily and commercial datasets are not public. Public brokerage summaries for the South Dakota housing market are also not readable in this environment, so this review cannot present official statewide numeric figures for home prices, listings, or sales activity.
As a result, this review focuses on what can be documented from Bureau of Labor Statistics employment data, the Bureau of Economic Analysis income summary, South Dakota Housing program descriptions, the South Dakota Department of Revenue property tax page title, and general Federal Emergency Management Agency flood risk guidance. Where numeric data do not exist in these sources in accessible form, this review states that plainly and remains qualitative.
For accredited investors, South Dakota presents as a small but relatively stable economy with very low unemployment and selective sector strength in leisure and hospitality and in education and health services. Tight labor conditions likely support rental housing demand, but the lack of public multifamily, commercial, and detailed housing data means that strategy in the state must lean on local information and proprietary datasets beyond what this document can show.
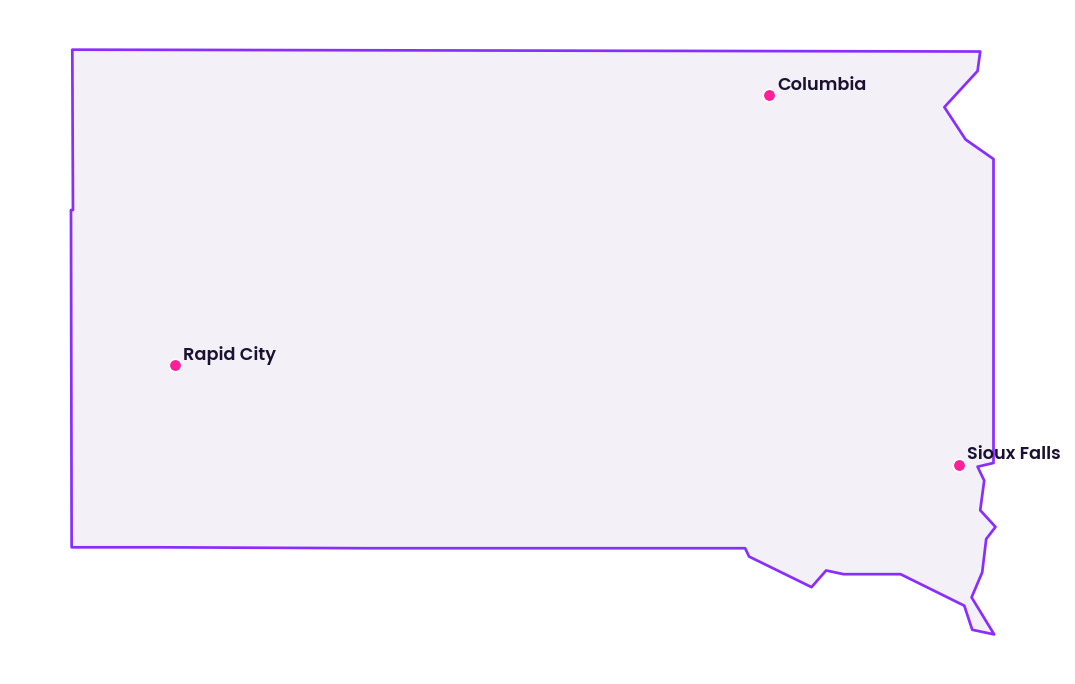
Section 02Population and Migration
Population and migration are foundational for any statewide real estate view, but in this environment there is no direct access to current South Dakota figures from the United States Census Bureau. Census QuickFacts and many American Community Survey tables for states, counties, and cities return access blocked messages through the tools used here, as documented in work on other states. Because of this, this review cannot provide an official numeric population for South Dakota as of 2025 or 2026, nor can it quantify population growth since 2010 or 2020, age structure, household counts, or net migration into or out of the state.
The absence of accessible Census or American Community Survey data also means that this review cannot distinguish in numeric terms between urban growth in metros such as Sioux Falls and Rapid City and population trends in rural counties. It cannot state student populations, senior cohorts, or family sizes in South Dakota, even though those numbers exist in federal statistical releases.
For investors, this is a serious limitation. Population growth and migration patterns drive long run demand for both owner occupied and rental housing and for commercial space. The best that can be said from the accessible macro data is that South Dakota maintains a labor force of about 489 thousand people as of June 2026 and an unemployment rate of 2.0 percent, which implies that the working age population engaged with the labor market remains substantial relative to the size of the state. Precise measures of total population and its evolution must be drawn from Census resources accessed outside this environment.
Section 03Jobs and Economic Anchors
The most detailed quantitative window into South Dakota’s economy comes from the Bureau of Labor Statistics South Dakota economy at a glance table, which reports statewide labor force and sector employment figures on a seasonally adjusted basis for January through June 2026. The key labor force indicators are summarized below.
| Metric | Unit and adjustment | January 2026 | June 2026 preliminary | Scope and source |
|---|---|---|---|---|
| Civilian labor force | Thousands of persons, seasonally adjusted | 493.5 | 488.7 | South Dakota statewide, Bureau of Labor Statistics economy at a glance, labor force data |
| Employment | Thousands of persons, seasonally adjusted | 482.5 | 478.8 | South Dakota statewide, Bureau of Labor Statistics economy at a glance, labor force data |
| Unemployment | Thousands of persons, seasonally adjusted | 11.0 | 9.9 | South Dakota statewide, Bureau of Labor Statistics economy at a glance, labor force data |
| Unemployment rate | Percent, seasonally adjusted | 2.2 | 2.0 | South Dakota statewide, Bureau of Labor Statistics economy at a glance, labor force data |
| Total nonfarm employment | Thousands of jobs, seasonally adjusted | 470.0 | 471.5 | South Dakota statewide, Bureau of Labor Statistics economy at a glance, nonfarm wage and salary employment |
| Twelve month change in total nonfarm employment | Percent | 0.0 | 0.5 | South Dakota statewide, Bureau of Labor Statistics economy at a glance, nonfarm wage and salary employment |
These figures show that over the first half of 2026, South Dakota’s labor force and employment eased slightly in level but remained near their January values, and that unemployment fell enough to bring the unemployment rate from an already low 2.2 percent down to 2.0 percent. Total nonfarm employment grew only modestly, with year over year change reaching 0.5 percent by June. This combination indicates that the state economy is operating close to full employment, with limited slack and modest job gains.
The same Bureau of Labor Statistics table provides sector level employment data, in thousands of jobs and seasonally adjusted, along with twelve month percent changes. Mining and logging employed 1.2 thousand people in both January and June 2026, with year over year growth of 9.1 percent in January and zero in June. Construction employed 29.8 thousand workers in January and 30.5 thousand in June, and its twelve month change improved from a decline of 0.7 percent in January to an increase of 2.3 percent in June, which suggests that construction activity has strengthened modestly over the year.
Manufacturing employment was 43.9 thousand in January and 43.6 thousand in June 2026, with twelve month changes ranging from a decline of 1.1 percent in January to a decline of 1.1 percent in June, after a deeper drop of 2.0 percent in April. That pattern reflects continued pressure on the manufacturing sector. Trade, transportation, and utilities employment stood at 91.6 thousand in January and 91.6 thousand again in June, with twelve month changes consistently negative at around 1.1 percent. This sector, which includes wholesale and retail trade and logistics, remains a large employer but is shrinking slightly year over year.
Information employment was 4.8 thousand jobs in January and 5.0 thousand in June 2026, but twelve month changes were negative in every month, from a decline of 5.9 percent in January to a decline of 2.0 percent in June. Financial activities employment was 27.0 thousand in January and 27.1 thousand in June, with twelve month changes improving from a decline of 1.8 percent to a decline of 0.7 percent, which indicates a sector that is stabilizing after mild contraction.
Professional and business services employed 36.6 thousand people in January and 36.6 thousand again in June 2026, but its year over year change remained negative in every month of the period, with the deepest decline, a drop of 2.9 percent, recorded in May. Education and health services, by contrast, was a steady growth engine. It employed 81.2 thousand people in January and 81.8 thousand in June, and its twelve month growth rate increased from 1.2 percent to 2.0 percent across the period. Leisure and hospitality employment was 54.1 thousand in January and 53.9 thousand in June 2026, with twelve month gains ranging from 5.4 percent to 6.7 percent, which makes it one of the fastest growing sectors. Other services employed 18.8 to 18.9 thousand workers with steady twelve month growth of 1.6 to 2.2 percent, while government employment was around 81.0 to 81.3 thousand, with twelve month declines around 1.0 to 1.5 percent.
For real estate investors, these sector patterns matter. The combination of strong leisure and hospitality growth and steady education and health services expansion points to sustained demand for workforce housing, hospitality properties, and service oriented retail. Manufacturing and trade employment softness signals some risk for industrial and logistics assets, especially those dependent on discretionary goods movement and retail. The small but negative trends in information, financial activities, professional services, and government jobs suggest that high specification office demand is not a primary growth story in South Dakota at this time, and that defensive strategies in those asset classes are prudent.
Section 04Income
Income levels and growth rates directly influence housing affordability and consumer spending. Detailed figures for South Dakota such as personal income per capita or median household income generally come from the Bureau of Economic Analysis and the Census Bureau. In this environment, only the high level Bureau of Economic Analysis summary is accessible.
In its personal income by state release dated June 25 2026, the Bureau of Economic Analysis states that personal income increased in forty nine states and the District of Columbia in the first quarter of 2026. It notes that state level changes ranged from a 22.4 percent increase in North Dakota to a 23.9 percent decrease in Hawaii. By implication, all states other than Hawaii, including South Dakota, saw personal income rise in that quarter. The release does not provide South Dakota’s specific percentage change in the text that is visible here, nor does it give the dollar level of personal income or per capita amounts for the state.
This means that, while it is clear that aggregate personal income for South Dakota residents was higher in the first quarter of 2026 than in the prior period, this review cannot say how fast that income grew or how it compares numerically with neighboring states or the national average. It also cannot distinguish between wage and salary income, transfer payments, and property income for South Dakota.
For investors, the key takeaway from the accessible Bureau of Economic Analysis information is directional rather than precise. The fact that personal income increased in South Dakota supports the idea that households have somewhat more nominal income to support rents, mortgage payments, and consumption in early 2026 than they did in late 2025. The magnitude and distribution of that income growth must be determined from the full Bureau of Economic Analysis tables or other detailed sources beyond this environment.
Section 05Housing and Multifamily
South Dakota’s housing system spans owner occupied single family homes, multifamily rentals, small multiunit properties, and specialized housing such as senior or student housing. The structural distribution of housing by type and tenure is usually documented by the Census Bureau and American Community Survey, but those tables are not accessible here. This review therefore cannot quantify how many housing units are in single family versus multifamily structures statewide, what share of households rent versus own, or how many housing units exist in total.
South Dakota Housing, the state’s housing finance agency, provides qualitative insight into the policy framework for housing. South Dakota Housing was created by the state legislature in 1973 with a mission to provide opportunities for quality, affordable housing for South Dakotans. It describes itself as a self supporting nonprofit entity that uses housing bonds, tax credits, and other federal and state resources to fund programs that provide mortgage and downpayment assistance, housing construction and rehabilitation, homelessness prevention, rental assistance, and educational opportunities for homebuyers and renters. This description confirms that the state has active programs to support both homeownership and rental housing and that multifamily development and preservation are part of the toolkit.
The same South Dakota Housing site describes a workforce housing development program that is designed to increase the supply of quality, attainable homes and address affordability challenges for state homebuyers. One key numeric feature of this program is that homes built with workforce housing development program funds must be sold to households with incomes at or below 120 percent of the area median income, and the sales price of such homes may not exceed 300,000 dollars. While this figure applies specifically to program supported for sale units rather than to the entire housing stock, it provides a reference point for what state policymakers consider attainable ownership housing in South Dakota in 2026.
For multifamily investors, the combination of a state agency that deploys housing tax credits and other capital into rental projects and a workforce housing initiative suggests that there is institutional support for both affordable multifamily and attainable ownership units. However, in the absence of numeric counts of subsidized units, conventional multifamily units, and overall rental stock, investors must build their understanding of multifamily supply and demand from local property data, market surveys, and proprietary datasets rather than from state level public housing inventories.
Section 06Rents
Rents are core to multifamily and single family rental underwriting. At the federal level, the United States Department of Housing and Urban Development publishes Fair Market Rent schedules for every county and metropolitan area in the country, including all of South Dakota, for each fiscal year. The Fair Market Rent documentation system for fiscal year 2026 explains that the fiscal year 2026 rents are derived from 2023 American Community Survey data and updated using several methodological steps. It lists data files that contain county level Fair Market Rents, small area Fair Market Rents, and unadjusted rents.
However, all of the actual Fair Market Rent values for South Dakota for fiscal year 2026 are contained in spreadsheet files such as xlsx and csv documents that this environment cannot read. The accessible text of the Fair Market Rent documentation page names the existence of county level data and small area Fair Market Rents but does not list any specific dollar amounts for rent levels in South Dakota counties or metros. Without being able to open the spreadsheets, this review cannot provide any Fair Market Rent dollar values for studios, one bedroom, or larger units in Sioux Falls, Rapid City, or any other South Dakota jurisdiction.
Proprietary providers such as RealPage, CoStar, Yardi Matrix, and Zillow maintain detailed rent series for many multifamily markets, including South Dakota cities, but their data are not available as open public text in this environment. As a result, there is no official public numeric information on average or median multifamily rents, rent per square foot, or rent growth rates for South Dakota that can be cited here.
The unavoidable conclusion is that rent levels and trends for multifamily and single family rentals in South Dakota cannot be documented with numbers in this review. Any rent assumptions for deals in the state must be supported by direct analysis of Fair Market Rent spreadsheets, proprietary rent surveys, or property level rent rolls obtained outside this environment.
Section 07Vacancy
Vacancy rates for rental housing and commercial properties influence both cash flow stability and pricing, but in this environment there are no accessible statewide vacancy statistics for South Dakota. Residential vacancy estimates are typically available from Census and American Community Survey housing tables, which this environment cannot access. Multifamily and commercial vacancy metrics are tracked by proprietary data providers and in brokerage research, but those numbers are not presented as public text that can be used here.
Because of this, this review cannot give a numeric rental vacancy rate for South Dakota, cannot split vacancy between apartments and single family rentals, and cannot quantify office, industrial, or retail vacancy either statewide or in specific metros such as Sioux Falls or Rapid City. The absence of these numbers is a meaningful limitation rather than an indicator that vacancy is low or high.
For investors, vacancy must therefore be evaluated at the property and submarket level using local leasing information, subscription datasets, and property operating histories. This document can only highlight that vacancy is a central risk and return driver, not provide numeric measures for South Dakota as a whole.
Section 08Supply Pipeline
The supply pipeline for new housing and commercial space shapes the future balance of supply and demand. In principle, statewide counts of residential building permits and measures of commercial construction can be derived from Census building permits surveys and state or local permitting data. In this environment, however, the relevant Census tables are not accessible, and no South Dakota statewide permit summaries are visible through other public text sources used here.
The only proximate quantitative indicator of construction activity available is the construction employment series in the Bureau of Labor Statistics South Dakota economy at a glance table. Construction employment in South Dakota was 29.8 thousand jobs in January 2026, 30.7 thousand jobs in May, and 30.5 thousand jobs in June, seasonally adjusted. The twelve month percent change in construction employment was a decline of 0.7 percent in January and February 2026, improved to a decline of 0.3 percent in March and April, then switched to an increase of 2.7 percent in May and 2.3 percent in June. This pattern indicates that, relative to the same months in 2025, construction employment in South Dakota has moved from slight decline to moderate growth by mid 2026.
While rising construction employment usually correlates with an increase in building activity, the series does not reveal how much of that activity is in single family homes, multifamily housing, or commercial and infrastructure projects, nor where within the state it is concentrated. It also does not provide unit or square footage counts.
For investors, the employment figures suggest that South Dakota is not experiencing a severe contraction in construction. If anything, the sector is expanding modestly compared with the prior year. That provides some comfort that new supply is still being delivered, but not at a pace that would usually be associated with a significant oversupply risk. To assess pipeline risk for specific strategies such as class A multifamily in Sioux Falls or industrial near Rapid City, investors will need more granular permit and project data than are available here.
Section 09Single Family Homes
Single family housing dynamics in South Dakota are typically quantified using multiple listing service data and aggregator summaries, but in this environment those statewide numeric series are not accessible. The Redfin South Dakota housing market page that is listed in the sources cannot be read by the tools used here, because content extraction fails. As a result, this review cannot present an official statewide median sale price, cannot state how that price has changed year over year, and cannot quantify the number of homes for sale or the share of homes sold above list price.
Without those figures, this document cannot describe recent statewide price trends or inventory conditions for single family homes in South Dakota. Any statements about whether prices are rising or falling, whether inventory is tight or ample, or how frequently bidding wars occur would be conjecture rather than grounded in accessible data and therefore are not included.
For investors looking at single family rentals or ownership oriented strategies, the implication is that all pricing, volume, and absorption analysis must be built from local multiple listing service data, county recording information, and proprietary brokerage or data vendor reports. This review can only highlight that single family homes are a central component of South Dakota housing and that their performance is a key input to real estate strategy, not provide the numeric single family housing metrics that usually inform that analysis.
Section 10Commercial Real Estate and Retail Centers
Office, industrial, and retail properties in South Dakota support the state’s diverse employment base, but unlike single family homes, there is no public aggregator that provides statewide commercial real estate metrics in accessible form. Vacancy rates, rent levels, absorption, and capitalization rates for offices, warehouses, and shopping centers in South Dakota are tracked primarily by proprietary data providers and by brokerage firms. Those numeric series are not published as open text that can be used here.
However, the Bureau of Labor Statistics sector employment data offer an indirect view of the demand side for commercial property. Trade, transportation, and utilities employed 91.6 thousand people in January 2026 and 91.6 thousand again in June 2026 in South Dakota, seasonally adjusted. The twelve month percent change in this sector was negative in all months from January through June, ranging from a decline of 1.3 percent in April to a decline of 0.5 percent in March. Because this sector includes wholesale and retail trade, transportation, and utilities, its slight contraction suggests that demand for some categories of retail and logistics space may be under mild pressure compared with a year earlier.
Professional and business services employment was 36.6 thousand in January and 36.6 thousand in June 2026, with twelve month declines between 1.1 percent and 2.9 percent over the period. This indicates that the pool of white collar professional employers is shrinking modestly, which likely reduces office demand at the margin. Financial activities, at around 27.0 to 27.1 thousand jobs and with twelve month changes improving from a decline of 2.5 percent to a decline of 0.7 percent, appear to be stabilizing but not growing, again pointing to a soft but not collapsing office demand environment.
In contrast, leisure and hospitality employment, which drives hotel and restaurant demand and supports entertainment oriented retail centers, was 54.1 thousand jobs in January and 53.9 thousand in June 2026. Its twelve month growth was consistently strong, with values around 5.4 to 6.7 percent. This growth in leisure and hospitality jobs suggests ongoing expansion of tourism and local entertainment spending, which benefits hotels, restaurants, and neighborhood retail centers, especially in destinations and regional hubs.
Industrial and logistics demand in South Dakota is influenced by manufacturing and trade and transportation. Manufacturing employment, as noted, declined year over year, though only by about one to two percent, while trade and transportation also saw modest declines. Together, these trends point to a steady but not rapidly growing base for industrial real estate. Well located distribution facilities and manufacturing related properties in and near major corridors likely remain in demand, but the data do not support an assumption of broad based industrial boom.
Because there are no accessible public statistics on commercial vacancy, rents, or capitalization rates for South Dakota, this review cannot state numeric values for these metrics. Investors must obtain such figures from proprietary sources or local market participants. Nonetheless, the sector employment data make it clear that retail related to leisure and hospitality and industrial related to durable manufacturing and logistics remain relative bright spots, while office space tied to professional and financial services faces more subdued conditions.
Section 11Transactions and Capital Markets
Capital market conditions and transaction volumes are crucial for assessing liquidity and pricing risk. In South Dakota, as in other states, detailed transaction data for multifamily and commercial properties are held in county recording systems and compiled by proprietary data vendors and brokerage research arms. There is no statewide public dataset in accessible text form here that aggregates the number of multifamily or commercial transactions, their sale prices, or capitalization rates.
As a result, this review cannot quantify how many apartment communities, shopping centers, or industrial properties traded in South Dakota in 2025 or early 2026, cannot state average or median capitalization rates for those asset classes, and cannot compare current transaction volumes with prior years. Similarly, it cannot identify how much capital from specific investor types has flowed into South Dakota real estate.
Given the limited public data, investors should treat South Dakota as a market where transaction and capital markets intelligence must be sourced through direct engagement with local brokers, lenders, and proprietary data providers. The macro context of low unemployment, modest overall job growth, and increasing personal income suggests that capital is still interested in South Dakota real estate, but the specific levels of liquidity and pricing are outside the scope of this document.
Section 12Taxes
Property taxes affect both net operating income and values for all real estate asset classes. In South Dakota, property taxation is governed by state law and administered at the local level, with county governments playing a central role in assessment and collection. The South Dakota Department of Revenue maintains a property tax page, which provides an entry point to information about state property tax programs and policies, as indicated by the page title.
However, the accessible content for that property tax page in this environment is limited to the title text and does not include any numeric data. There are no statewide effective property tax rates, millage rates, or median tax bills visible in the content retrieved here. The Tax Foundation county property tax tables that were partially accessible for some other states did not yield usable South Dakota figures in earlier work. Because of this, this review cannot provide a numeric effective property tax rate for South Dakota or for any of its counties, nor can it compare the state’s property tax burden with other states.
For investors, this means that property tax analysis in South Dakota must be done at the property level using assessor and tax collector data, and that assumptions about tax expense should not be inferred from national averages or from other state patterns. The presence of a dedicated state Department of Revenue property tax portal underscores that guidance and program information are available, but the lack of numeric statewide summaries in accessible text leaves this review unable to quantify tax levels.
Section 13Insurance
Insurance, especially property insurance, is a significant ongoing cost and a key risk transfer mechanism for real estate in South Dakota. State insurance regulators usually publish some statistics on premiums and losses, and national datasets describe broader insurance market conditions. In this environment, however, no South Dakota specific numeric insurance data have been retrieved. The web sources consulted here for employment, housing, income, housing finance, property tax, and flood risk do not include insurance premium figures, coverage counts, or loss ratios for South Dakota.
Given that gap, this review cannot quantify typical property insurance costs or trends for residential or commercial properties in South Dakota, nor can it state how those costs compare with neighboring states or national averages. It also cannot identify changes in insurer participation or coverage availability in South Dakota.
Investors should therefore treat insurance as a highly local and property specific variable. Quotes based on building characteristics, location, and desired coverage will provide a much more accurate picture of insurance expense and risk than any generalized assumption. Physical and climate risks, discussed below, will interact with the insurance market to produce asset specific outcomes that this statewide review cannot fully anticipate.
Section 14Landlord Tenant and Regulatory Environment
The landlord tenant and housing regulatory environment in South Dakota is largely defined by state statutes, which cover residential leases, notices, and eviction processes, and by local ordinances in cities and counties. In this environment, the tools used have not retrieved official summaries or statutory language that can be quoted with numeric thresholds, such as notice periods or specific damage deposit limits, for South Dakota.
As a result, this review cannot provide a detailed, authoritative description of South Dakota’s landlord tenant framework, cannot state whether there are statewide rent increase limitations, and cannot quantify any statutory timelines relevant to lease enforcement. It also cannot summarize zoning or growth management regulations that may affect development rights in specific jurisdictions.
For accredited investors, the message is that legal and regulatory due diligence in South Dakota must be conducted using current state statutes, administrative guidance, and local ordinance texts obtained outside this environment. This review can only flag that such a legal framework exists and that it matters, not specify its numeric detail.
Section 15Infrastructure
Infrastructure underpins real estate use and value in South Dakota, including highways, rail, airports, utilities, and broadband. While the state and its cities publish information about specific projects and systems, this environment has not captured numeric summaries such as miles of highway, airport passenger counts, or broadband coverage percentages for South Dakota.
In place of detailed numbers, it is reasonable to note that South Dakota’s employment mix, with substantial shares in trade and transportation, leisure and hospitality, and manufacturing, implies the presence of functional freight and travel infrastructure, including interstate corridors, regional airports, and tourism oriented routes. However, the precise scale, condition, and investment levels in these systems cannot be quantified here.
For real estate investors, infrastructure quality and access remain important underwriting considerations, especially for industrial and logistics properties, hotels, and retail centers. Those considerations must be evaluated through direct local information rather than through statewide numeric infrastructure datasets in this review.
Section 16Climate and Physical Risks
South Dakota faces a range of physical risks, including river and flash flooding, winter storms, and severe convective storms. Federal agencies, notably the Federal Emergency Management Agency and the National Oceanic and Atmospheric Administration, maintain detailed hazard maps and climate statistics, but this environment has only retrieved general flood risk guidance from the Federal Emergency Management Agency.
The Federal Emergency Management Agency states that floods occur naturally and can happen almost anywhere, and that they may not be near a large body of water. It explains that flood maps show how likely it is for an area to flood, and that any place with a one percent or higher chance of experiencing a flood each year is considered to have high flood risk. Those areas have at least a one in four chance of flooding during a thirty year mortgage period. The agency emphasizes that there is no such thing as a no risk zone, even in places outside mapped high risk areas. It also notes that flood maps are used to determine insurance requirements and to inform risk reduction strategies.
These definitions apply nationally, including to South Dakota, but the flood maps page does not provide numeric values for how much of South Dakota’s land area or housing stock lies in high risk flood zones. Similarly, while South Dakota’s climate normals and hazard frequencies can be obtained from climate agencies, the relevant numeric tables are not accessible here, so this review cannot quantify average snowfall, temperature ranges, or severe weather incident frequencies for the state.
The implication for investors is that climate and physical risk assessment in South Dakota must be conducted at the property and micro location level, using flood maps, elevation data, and local hazard histories. This review can only reiterate that high risk flood zones carry a substantial probability of flooding over the life of a typical mortgage, and that even outside those zones, lower but nonzero risk remains.
Section 17Opportunities
Despite data limitations, several opportunity themes emerge for South Dakota real estate.
One opportunity lies in sectors that are adding jobs. Education and health services employment in South Dakota grew by about two percent year over year as of June 2026, with employment at 81.8 thousand jobs, according to the Bureau of Labor Statistics economy at a glance table. Leisure and hospitality employment, at 53.9 thousand jobs in June 2026, grew between about five and seven percent year over year across the first half of 2026. These expanding sectors support demand for workforce housing, hospitality properties, and service oriented retail near hospitals, educational institutions, recreation areas, and tourism destinations.
Another opportunity relates to the broader structural support for housing. South Dakota Housing’s workforce housing development program requires that homes built with program funds be sold to households with incomes at or below 120 percent of area median income and that the sales price of such homes not exceed 300,000 dollars. This explicit policy focus on attainable housing and the continued use of federal and state resources for mortgage assistance, rental assistance, and development financing suggest that the state will remain an active partner in both rental and ownership housing.
Construction employment growth that has turned positive on a year over year basis by mid 2026 also suggests that certain development segments remain viable. While this does not guarantee profitable new projects across the board, it indicates that the environment is not one of a sharp construction downturn. Developers and value add investors who focus on well targeted workforce housing and small scale commercial projects may find opportunities where state programs, such as South Dakota Housing’s workforce housing development program and tax credit allocations, can be combined with private capital.
Finally, the income context, where personal income increased in South Dakota in the first quarter of 2026 according to the Bureau of Economic Analysis, provides a modest macro tailwind to both renter and owner affordability, which can support occupancy and rent or price levels over time.
Section 18Risks
South Dakota also presents notable risks that must be considered alongside these opportunities.
A first risk is sectoral softness in several significant parts of the economy. Manufacturing employment declined year over year throughout early 2026, and trade and transportation employment also recorded negative twelve month changes each month. Professional and business services and government employment both saw persistent year over year declines. These trends may constrain demand for certain types of industrial, office, and retail space, especially in locations heavily dependent on those sectors.
A second risk arises from data opacity. This review cannot provide numeric measures for statewide or metro level multifamily rents, vacancy rates, or commercial real estate performance metrics, nor can it quantify population growth or detailed income levels. Investors who rely solely on this document without supplementing it with detailed local data run the risk of overestimating demand or underestimating competitive supply in specific submarkets.
A third risk is physical and climate driven. Although South Dakota does not face coastal storm surge, it does face flooding, severe storms, and winter weather, and the Federal Emergency Management Agency emphasizes that high risk flood zones carry significant flood probabilities over a mortgage horizon. Without a quantified breakdown of flood exposure by region or property class in this review, investors could underestimate the potential for flood related loss, insurance cost increases, and capital expenditure needs.
Regulatory uncertainty is another risk. This document does not summarize South Dakota’s landlord tenant laws, zoning regimes, or property tax nuances in detail. Unanticipated regulatory changes or local policy shifts could affect rent growth, operating costs, and redevelopment potential.
Finally, small market scale and liquidity pose risks. South Dakota’s total nonfarm employment of 471.5 thousand jobs as of June 2026 underscores that the state’s economic base and real estate markets are small compared with large metropolitan states. That can translate into fewer buyers and sellers in any given segment, wider bid ask spreads, and longer marketing times for assets, especially in secondary and tertiary locations.
Section 19Investor Implications
For United States accredited investors, South Dakota should be viewed as a modest scale, low unemployment state with selective growth engines and important information gaps. The Bureau of Labor Statistics data confirm that the state operates near full employment, with a 2.0 percent unemployment rate as of June 2026 and total nonfarm employment growing only about half a percent over the year. Sector trends favor leisure and hospitality and education and health services, while manufacturing, trade, professional services, and government face headwinds.
Within this context, strategies that align with the state’s growing sectors and demographic tendencies, such as workforce housing near health and education nodes and hospitality and retail near tourism corridors, are more likely to find support. Single family rental and ownership oriented investments can also play a role, but they must be underwritten using local price, rent, and inventory data obtained from sources outside this environment, because statewide brokerage summaries are not machine readable here.
At the same time, the lack of public numeric information on multifamily rents, vacancy rates, and commercial property performance means that South Dakota is not a market where investors can rely primarily on broad statewide statistics. Successful investment will require access to detailed, often proprietary, market data and strong relationships with local operators and brokers. Careful attention to climate and flood risk mapping, as indicated by Federal Emergency Management Agency guidance, and to property tax and insurance structures is also essential.
In a diversified portfolio, South Dakota may function as a satellite allocation that offers exposure to a relatively stable employment base without the volatility of larger coastal markets. Position sizing should reflect the state’s smaller economic scale and the need for enhanced due diligence given the public data gaps.
Section 20Conclusion
As of mid 2026, South Dakota presents a nuanced real estate landscape. The state’s labor market is tight, with an unemployment rate of 2.0 percent in June 2026 and total nonfarm employment of 471.5 thousand jobs, only modestly higher than a year earlier. Sector dynamics are mixed, with leisure and hospitality and education and health services providing clear growth anchors, while manufacturing, trade and transportation, professional services, and government employment contract slightly on a year over year basis.
South Dakota Housing’s workforce housing program, with its income and price caps for program supported homes, underscores the state’s recognition of affordability challenges and its support for both homeownership and rental housing. The Bureau of Economic Analysis summary that personal income increased in South Dakota in the first quarter of 2026 adds a positive macro element, although the exact magnitude of that increase is not visible here.
At the same time, this review has been candid about its limits. It cannot provide numeric population counts, multifamily rent levels, vacancy rates, commercial real estate performance metrics, detailed property tax rates, insurance costs, or statewide single family home price and inventory statistics for South Dakota, because those figures reside in datasets that are either blocked by access controls, embedded in unreadable spreadsheet files, or available only through proprietary systems. The analysis has therefore focused on what can be documented from Bureau of Labor Statistics employment data, Bureau of Economic Analysis income summaries, South Dakota Housing program descriptions, the South Dakota Department of Revenue property tax portal, and Federal Emergency Management Agency flood risk guidance.
For accredited investors, the implication is clear. South Dakota offers real opportunities, especially in workforce housing and hospitality linked assets in growing service sectors, but capturing those opportunities requires a depth of local data and on the ground insight that goes beyond the public numbers presented here. This review aims to provide a structured, sourced foundation for that work, not a substitute for transaction level underwriting and due diligence.
Sources
- U.S. Bureau of Labor Statistics, South Dakota Economy at a Glance ,, https://www.bls.gov/eag/eag.sd.htm
- Redfin, South Dakota Housing Market: House Prices and Trends ,, https://www.redfin.com/state/South-Dakota/housing-market
- U.S. Bureau of Economic Analysis, Personal Income by State ,, https://www.bea.gov/data/income-saving/personal-income-by-state
- South Dakota Housing, SD Housing, Affordable Housing Programs and Assistance for South Dakota ,, https://www.sdhousing.org/
- South Dakota Department of Revenue, Property Tax ,, https://dor.sd.gov/individuals/taxes/property-tax/
- U.S. Department of Housing and Urban Development, HUD Fair Market Rents by State, County, and Metropolitan Areas ,, https://www.huduser.gov/portal/datasets/fmr.html
- Federal Emergency Management Agency, Flood Maps ,, https://www.fema.gov/flood-maps