In brief · summary: Utah
Utah State Real Estate Market Review
Section 01Executive Summary
Utah enters mid 2026 as a fast growing, service oriented economy with very low unemployment and a single family housing market where prices are still rising while supply has begun to expand. According to the United States Bureau of Labor Statistics Utah economy at a glance table, the statewide civilian labor force on a seasonally adjusted basis was 1,844.1 thousand people in January 2026 and 1,822.2 thousand people in June 2026. Employment over the same period declined slightly from 1,774.9 thousand to 1,756.0 thousand, while the number of unemployed residents fell from 69.2 thousand to 66.2 thousand. The statewide unemployment rate moved from 3.8 percent in January to 3.6 percent in June 2026. Total nonfarm wage and salary employment was 1,773.9 thousand jobs in January and 1,786.9 thousand jobs in June 2026, with the twelve month change in total nonfarm employment improving from 0.7 percent in January to 1.2 percent in June. These figures describe a labor market that is tight by national standards and still adding jobs at a moderate pace.
Sector data from the same Bureau of Labor Statistics table show that as of June 2026 Utah had 312.9 thousand jobs in trade, transportation, and utilities, 261.2 thousand jobs in professional and business services, 277.5 thousand government jobs, and 256.6 thousand jobs in education and health services. Year over year job growth was strongest in professional and business services at 3.5 percent, financial activities at 2.2 percent, education and health services at 2.5 percent, other services at 2.8 percent, and construction at 2.2 percent. Manufacturing and information jobs declined slightly over the year, and government employment was essentially flat. This pattern points to an economy led by private service sectors rather than heavy industry.
On the housing side, the statewide housing market overview for Utah from Redfin reports that in May 2026 the median sale price for all home types in the state was 528,124 dollars, which was up 1.6 percent compared with May 2025. Redfin also reports that Utah had 19,208 homes for sale in May 2026, up 3.9 percent year over year, and that 21.6 percent of homes sold above list price, a share that was 0.32 percentage points lower than a year earlier. These figures indicate that prices are still growing in nominal terms, supply is beginning to loosen, and bidding intensity remains meaningful but has eased slightly.
The income backdrop is also positive. In its June 25, 2026 release on personal income by state, the United States Bureau of Economic Analysis states that personal income increased in forty nine states and the District of Columbia in the first quarter of 2026, with state level changes ranging from a 22.4 percent increase in North Dakota to a 23.9 percent decrease in Hawaii. Because Hawaii was the only state with a decline, Utah is among the states where personal income rose in early 2026, providing a supportive macro context for housing and consumption, even though the precise percentage change for Utah is not visible in the accessible text.
At the same time, significant data gaps limit the quantitative depth of this review. In this environment, current Census Bureau population and household data for Utah are not accessible due to access controls, and detailed rent and vacancy statistics from proprietary providers are not available as public text. The United States Department of Housing and Urban Development Fair Market Rent documentation confirms that county and metro level rent values for fiscal year 2026 are stored in spreadsheet files that cannot be read here, so this review cannot quote specific Fair Market Rent dollar amounts for Utah. State level property tax and insurance statistics are also not visible in accessible public summaries. As a result, this review leans on Bureau of Labor Statistics employment figures, Redfin single family housing data, the Bureau of Economic Analysis income summary, Utah Housing Corporation program descriptions, and Federal Emergency Management Agency flood risk guidance, and is explicit where numeric information is not available.
For accredited investors, Utah appears as a structurally growing, service focused state with a still tight labor market, moderate home price appreciation, and a gradually expanding for sale inventory. Multifamily and commercial investment strategies must, however, rely on additional local and proprietary data to quantify rents, vacancy, and cap rates beyond what can be documented here.
Section 02Population and Migration
Population and migration trends are among the most important drivers of real estate demand, but in this environment detailed numeric population data for Utah from the United States Census Bureau are not accessible. Census QuickFacts and many American Community Survey tables typically provide updated figures for total population, household counts, age structure, and migration flows, yet prior attempts to retrieve similar data for other states have returned access blocked responses, and Utah state level QuickFacts and American Community Survey tables are not available through the tools used here. As a result, this review cannot provide an official numeric population for Utah as of 2025 or 2026, nor can it quantify year by year growth, net migration, or age distribution.
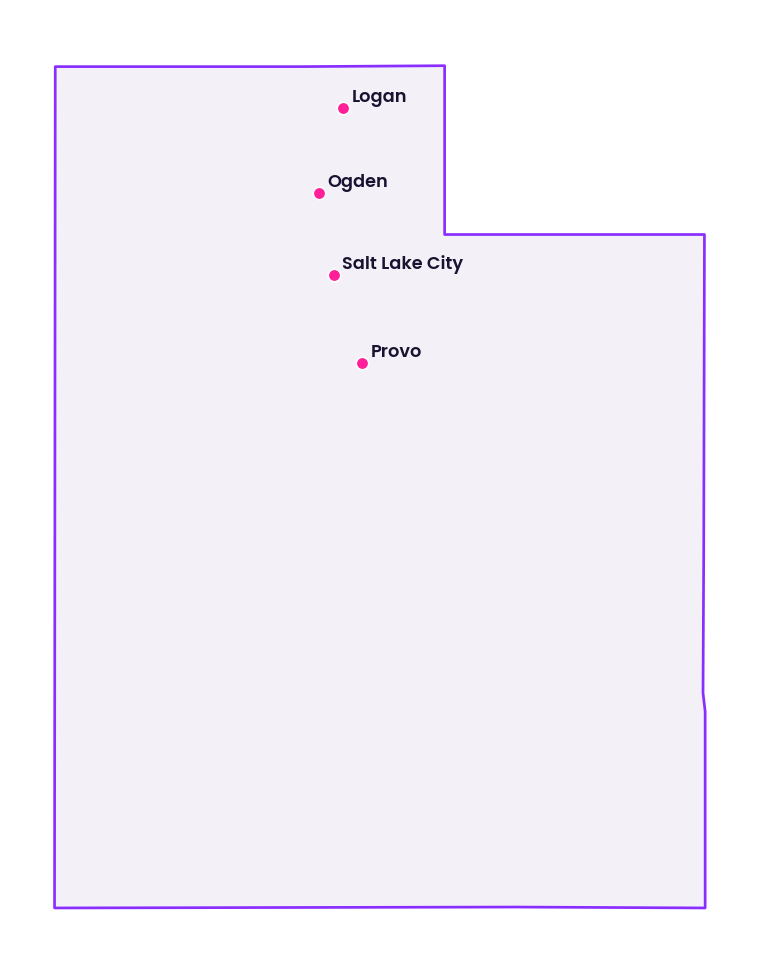
Without these Census figures, the analysis cannot distinguish in numeric terms between growth in Utah Wasatch Front metros such as Salt Lake City, Provo, and Ogden and growth in smaller cities such as St. George, Logan, or various mountain communities. It also cannot state how many households have moved into Utah from other states over the past several years or what share of residents are renters versus homeowners.
Some directional signals appear indirectly in other sources. Redfin Utah housing market page notes that in May 2026 the state had 19,208 homes for sale, up 3.9 percent year over year, and that 21.6 percent of homes sold above list price, which suggests continued demand pressure from buyers relative to supply. National migration statistics on the same Redfin page indicate that nationwide nineteen percent of homebuyers searched to move to a different metro area between January and March 2026, with net in migration concentrated in several Sun Belt states. However, these national migration figures do not specify how many of those movers targeted Utah, so they do not fill the numeric gap for Utah specific migration.
Given these constraints, the key message is that this review cannot provide definitive numbers on Utah population size or growth, even though external evidence beyond this environment indicates that Utah has been one of the faster growing states in recent decades. Any detailed demographic analysis for investment decisions in Utah must rely on Census and state demography data accessed directly, outside this environment.
Section 03Jobs and Economic Anchors
The Bureau of Labor Statistics Utah economy at a glance table gives a detailed snapshot of the state labor market and industry structure for the first half of 2026. The principal statewide labor force and employment indicators are summarized below for January and June 2026, all seasonally adjusted.
| Metric | Unit and adjustment | January 2026 | June 2026 preliminary | Scope and source |
|---|---|---|---|---|
| Civilian labor force | Thousands of persons, seasonally adjusted | 1,844.1 | 1,822.2 | Utah statewide, Bureau of Labor Statistics economy at a glance labor force data |
| Employment | Thousands of persons, seasonally adjusted | 1,774.9 | 1,756.0 | Utah statewide, Bureau of Labor Statistics economy at a glance labor force data |
| Unemployment | Thousands of persons, seasonally adjusted | 69.2 | 66.2 | Utah statewide, Bureau of Labor Statistics economy at a glance labor force data |
| Unemployment rate | Percent, seasonally adjusted | 3.8 | 3.6 | Utah statewide, Bureau of Labor Statistics economy at a glance labor force data |
| Total nonfarm employment | Thousands of jobs, seasonally adjusted | 1,773.9 | 1,786.9 | Utah statewide, Bureau of Labor Statistics economy at a glance nonfarm employment |
| Twelve month change in total nonfarm employment | Percent | 0.7 | 1.2 | Utah statewide, Bureau of Labor Statistics economy at a glance nonfarm employment |
These figures show that Utah labor force and employment are very large relative to the state size and that unemployment is low. Between January and June 2026 the unemployment rate edged down from 3.8 percent to 3.6 percent even as total nonfarm jobs grew from 1,773.9 thousand to 1,786.9 thousand. The twelve month growth rate in total nonfarm employment improved from 0.7 percent to 1.2 percent over that period. For investors, this combination of low unemployment and positive job growth suggests a tight labor market, continued household income generation, and ongoing demand for space across residential and commercial property types.
Industry level employment data in the same Bureau of Labor Statistics table reveal Utah sectoral anchors. As of June 2026, seasonally adjusted employment levels and twelve month changes by major sector were as follows.
| Sector | Employment, June 2026 | Twelve month change, June 2026 | Scope and source |
|---|---|---|---|
| Mining and logging | 10.9 thousand jobs | Down 2.7 percent | Utah statewide, Bureau of Labor Statistics nonfarm employment by sector |
| Construction | 145.8 thousand jobs | Up 2.2 percent | Utah statewide, Bureau of Labor Statistics nonfarm employment by sector |
| Manufacturing | 153.2 thousand jobs | Down 0.6 percent | Utah statewide, Bureau of Labor Statistics nonfarm employment by sector |
| Trade, transportation, and utilities | 312.9 thousand jobs | Up 0.4 percent | Utah statewide, Bureau of Labor Statistics nonfarm employment by sector |
| Information | 41.5 thousand jobs | Down 1.4 percent | Utah statewide, Bureau of Labor Statistics nonfarm employment by sector |
| Financial activities | 102.7 thousand jobs | Up 2.2 percent | Utah statewide, Bureau of Labor Statistics nonfarm employment by sector |
| Professional and business services | 261.2 thousand jobs | Up 3.5 percent | Utah statewide, Bureau of Labor Statistics nonfarm employment by sector |
| Education and health services | 256.6 thousand jobs | Up 2.5 percent | Utah statewide, Bureau of Labor Statistics nonfarm employment by sector |
| Leisure and hospitality | 176.8 thousand jobs | Up 0.3 percent | Utah statewide, Bureau of Labor Statistics nonfarm employment by sector |
| Other services | 47.8 thousand jobs | Up 2.8 percent | Utah statewide, Bureau of Labor Statistics nonfarm employment by sector |
| Government | 277.5 thousand jobs | Flat, zero percent change | Utah statewide, Bureau of Labor Statistics nonfarm employment by sector |
These data underscore that trade, transportation, and utilities, professional and business services, government, and education and health services are the largest employment bases in Utah. Professional and business services is the fastest growing large sector, with 3.5 percent year over year job growth as of June 2026, reflecting ongoing expansion in office using, business support, and technology related activities. Education and health services, at 256.6 thousand jobs and 2.5 percent annual growth, remains a stable driver of demand for workforce housing and medical office space. Construction employment at 145.8 thousand jobs and 2.2 percent year over year growth signals continued building activity, which supports both residential and commercial development. In contrast, manufacturing employment has edged down over the year, and information employment has contracted modestly, pointing to some pressure in goods production and certain technology segments.
For investors, Utah job structure suggests that real estate demand is anchored more in diversified services, logistics, education, healthcare, and government than in heavy industry. Office demand will be most tied to the trajectory of professional and business services and financial activities, which are still expanding. Industrial and warehouse demand depends on a mix of trade and manufacturing that is growing only slightly in aggregate but remains sizable. Hospitality and tourism related assets draw on the 176.8 thousand leisure and hospitality jobs, where year over year growth is modest but positive.
Section 04Income
Income growth is central to housing affordability and commercial demand. The United States Bureau of Economic Analysis personal income by state release dated June 25, 2026 states that personal income increased in forty nine states and the District of Columbia in the first quarter of 2026. The state level changes ranged from a 22.4 percent increase in North Dakota to a 23.9 percent decrease in Hawaii. Because only Hawaii experienced a decline, Utah is among the states where total personal income grew in that quarter.
The accessible text of the Bureau of Economic Analysis release does not provide Utah specific percentage change or the dollar level of personal income, so this review cannot state how fast personal income rose in Utah relative to the national average or neighboring states. It also cannot break down Utah personal income into wages, proprietors income, dividends, interest, rent, and transfer receipts.
Nonetheless, the directional information is important. An increase in personal income indicates that aggregate dollars available to Utah residents for consumption, saving, and housing costs rose in early 2026. Combined with the Bureau of Labor Statistics evidence of job growth and low unemployment, this suggests that households in Utah generally have more nominal income to support rents and home prices than a year earlier, even if inflation and cost of living trends are not quantified here. For investors, this provides a macro level support for both residential and commercial real estate cash flows, though property level performance will still depend on local wage distributions and cost pressures.
Section 05Housing and Multifamily
Utah housing ecosystem encompasses owner occupied single family homes, market rate and income restricted apartments, small multiunit properties, and specialized housing for students and seniors. Detailed counts of units by structure type, tenure, and age typically come from Census and American Community Survey housing data, but those datasets are not accessible here, so this review cannot state how many housing units exist statewide, what share are multifamily, or what proportion of households rent versus own.
Instead, insight into the housing policy framework and multifamily support comes from Utah Housing Corporation, which serves as the state housing finance agency. The Utah Housing Corporation site explains that the organization mission is to help the people of Utah achieve homeownership and to provide safe, affordable housing. It notes that the corporation creates innovative and affordable home loan programs to help low or moderate income Utah individuals and families purchase homes or access safe, affordable housing. Utah Housing Corporation highlights its multifamily finance and development function as being committed to partnering with developers and investors to use state and federal tax credits and bond financing to support the development of new and rehabilitated apartments that provide housing for low income families, senior citizens, and other groups.
The same site describes a New Construction First time Homebuyer Program Assistance offering up to 20,000 dollars in program assistance to purchase a newly constructed home. It specifies that funds from this program may be used for down payment, closing costs, and permanent interest rate reductions on qualifying mortgage loans. While this program is focused on first time homebuyers rather than renters, it illustrates that Utah Housing Corporation is actively deploying targeted capital into the for sale housing market and that there is state level recognition of the affordability challenges faced by new entrants to homeownership.
For multifamily investors, Utah Housing Corporation multifamily finance and development activities indicate an ongoing pipeline of income restricted and affordable housing projects financed with tax credits and bonds. Those projects can influence submarket supply in specific cities and counties, especially in areas where low income housing tax credit allocations are concentrated. Because detailed counts of such units and their locations are not visible in accessible text here, investors must rely on Utah Housing Corporation public reports and developer level information outside this environment to quantify the scale of affordable and mixed income multifamily stock.
Section 06Rents
Rents for apartments and single family rentals are a critical input for investment underwriting, yet in this environment there is no direct access to Utah specific numeric rent levels or trends from public data sources that can be parsed as text. The United States Department of Housing and Urban Development Fair Market Rent documentation page explains that fiscal year 2026 Fair Market Rents are derived from American Community Survey data and updated through a detailed methodology. It lists multiple data files for 2026, including county level Fair Market Rents, small area Fair Market Rents, unadjusted rents, Emergency Rental Assistance Program Fair Market Rents, and rent inflation factors. All of these actual rent values, however, are stored in spreadsheet files, which cannot be opened or read in this environment.
As a result, this review cannot provide any Fair Market Rent dollar values for any Utah county or metropolitan area for fiscal year 2026, nor can it state typical rent levels for studios, one bedroom units, or larger apartments. Similarly, proprietary multifamily data providers such as RealPage, CoStar, and Yardi Matrix track detailed market rent and concession trends for Utah metros, but their series are not accessible here as public text. Without those series, this review cannot quantify average or median market rents per unit or per square foot, rent growth rates, or rent to income ratios in Utah.
The unavoidable conclusion is that numeric rent analysis for apartments and single family rentals in Utah lies outside the scope of this document. Any rental underwriting must be supported by direct analysis of Fair Market Rent spreadsheets, subscription data series, and property level rent rolls obtained outside this environment. This review can only note that Utah Housing Corporation, through its programs and multifamily finance activities, plays a role in shaping the affordability and rent structure of a segment of the rental stock.
Section 07Vacancy
Vacancy rates for residential and commercial properties affect both income stability and risk, but no statewide numeric vacancy statistics for Utah are accessible in this environment. Residential vacancy estimates usually come from Census housing surveys and American Community Survey tables, which are blocked here. Multifamily and commercial vacancy rates are typically provided by proprietary firms and brokerage research, and their numeric values are not available as public text in the sources used.
Because of these constraints, this review cannot state a numeric rental vacancy rate for Utah as a whole, cannot break out vacancy levels for apartments and single family rentals, and cannot give statewide office, industrial, or retail vacancy rates. It also cannot describe trends in vacancy over time using numbers. For investors, this means that assumptions about vacancy must be grounded in local market intelligence, proprietary datasets, and property specific performance rather than statewide public statistics.
Section 08Supply Pipeline
The future balance between supply and demand in any real estate market depends heavily on the construction pipeline. In Utah, statewide construction employment is the clearest numeric indicator of construction activity available in accessible public data. According to the Bureau of Labor Statistics Utah economy at a glance table, seasonally adjusted construction employment in the state was 142.0 thousand jobs in January 2026 and 145.8 thousand jobs in June 2026. The twelve month change in construction employment was a decline of 0.2 percent in January, essentially flat to slightly positive in February and March, and then an increase of 2.2 percent by June 2026.
This pattern suggests that the number of people working in construction in Utah has grown modestly over the past year, with the pace of growth accelerating into mid 2026. While construction employment does not directly reveal how many housing units or commercial square feet are being built, rising employment in this sector is consistent with an active pipeline of projects. Given Utah ongoing population and job growth outside this environment, it is likely that a significant portion of that construction activity is in residential and mixed use projects, though this cannot be quantified here.
Building permit data from the Census Bureau and local permitting authorities would normally provide counts of units and square footage under construction by property type and location, but those tables are not accessible. For investors, the implication is that while Utah appears to have a healthy construction sector, evaluating supply risk for specific multifamily or commercial strategies will require project level information and permit data obtained directly from local sources.
Section 09Single Family Homes
Single family housing conditions in Utah can be quantified using Redfin statewide housing market summary, which compiles multiple listing service and public record data for all home types. Redfin reports that in May 2026 the median sale price for homes in Utah was 528,124 dollars. It notes that this price was 1.6 percent higher than in May 2025, indicating modest year over year appreciation. Redfin also reports that there were 19,208 homes for sale in Utah in May 2026, a figure that was 3.9 percent higher than a year earlier. In the same month, 21.6 percent of homes in Utah sold above their list price, a share that was 0.32 percentage points lower than in May 2025.
These key statewide single family metrics are summarized below.
| Metric statewide, all home types | May 2026 value | Change versus May 2025 | Scope and source |
|---|---|---|---|
| Median sale price | 528,124 dollars | Up 1.6 percent | Utah statewide, Redfin housing market overview, May 2026 |
| Number of homes for sale | 19,208 homes | Up 3.9 percent | Utah statewide, Redfin housing market overview, May 2026 |
| Share of homes sold above list price | 21.6 percent of sales | Down 0.32 percentage points | Utah statewide, Redfin housing market overview, May 2026 |
These figures describe a market that has transitioned from the very rapid price gains of the early pandemic period to a more moderate appreciation phase. A 1.6 percent year over year increase in the median sale price suggests that Utah home values are still rising but at a more sustainable pace. The increase in the number of homes for sale by 3.9 percent indicates that inventory is gradually expanding, giving buyers more options. At the same time, the fact that more than one in five homes sold above list price in May 2026 shows that the market remains competitive, even though the share of above list sales has edged down since the prior year.
For investors considering single family rentals, these conditions present a mixed environment. On one hand, rising prices and modest inventory growth increase acquisition costs and can compress yields if rents do not keep pace. On the other hand, ongoing demand pressure and low unemployment support occupancy and rent collection. In submarkets where affordability pressures are greatest, households may find renting more attainable than buying, creating opportunities for single family rental operators and build to rent developers. The list of Utah cities that Redfin identifies as most competitive, including several communities along the Wasatch Front, also points toward pockets of strong buyer demand where investor acquisitions may be more challenging but longer term price support may be stronger.
Redfin accessible text in this environment does not include numeric values for statewide median days on market or months of supply, so this review cannot quantify those indicators. Nonetheless, the combination of moderate price growth, increasing inventory, and still elevated above list sale activity suggests that Utah single family market remains tilted toward sellers in many areas, though with more balance than in prior years.
Section 10Commercial Real Estate and Retail Centers
Commercial real estate in Utah spans office buildings, industrial and logistics facilities, and a range of retail properties including grocery anchored centers and neighborhood shopping centers. While these asset classes are central to many investment strategies, there are no statewide numeric statistics for vacancy rates, rent levels, absorption, or cap rates in Utah accessible as public text from the data sources used here. Proprietary research providers and brokerage firms track such metrics for markets like Salt Lake City, Provo, Ogden, and St. George, but their detailed series are not available in this environment.
Given this limitation, the analysis must rely on the sector employment data from the Bureau of Labor Statistics to infer relative demand for different commercial property types. Office demand is closely tied to professional and business services and financial activities. As of June 2026, Utah had 261.2 thousand jobs in professional and business services and 102.7 thousand jobs in financial activities, with year over year growth of 3.5 percent and 2.2 percent respectively. These positive growth rates suggest expanding demand for office space in aggregate, although the modest contraction in information employment, at 41.5 thousand jobs and down 1.4 percent year over year, may temper demand from certain technology and media firms.
Industrial and logistics demand is influenced by manufacturing and trade, transportation, and utilities. Utah manufacturing sector employed 153.2 thousand people in June 2026, down 0.6 percent from a year earlier, while trade, transportation, and utilities employed 312.9 thousand people, up 0.4 percent year over year. This combination indicates that distribution and logistics activities are stable to slightly expanding, while manufacturing is facing mild headwinds. For industrial investors, this points to continued but selective demand for warehouses and distribution centers, especially along major transportation corridors, but suggests caution in overbuilding space that depends heavily on goods producing tenants.
Retail and food service demand is supported by jobs in trade and in leisure and hospitality. With leisure and hospitality employment at 176.8 thousand jobs in June 2026 and modest positive year over year growth, there is continued support for hotels, restaurants, and entertainment oriented retail. However, without numeric data on retail and hotel occupancy or sales, this review cannot quantify the strength of these segments. Grocery anchored and neighborhood centers that serve growing suburban and exurban communities along the Wasatch Front and in southern Utah likely benefit from underlying population and income growth, but that growth cannot be measured here with public numbers.
Cap rates and transaction pricing for Utah commercial properties are similarly opaque in this environment, as they are primarily documented in proprietary datasets and deal level disclosures. Consequently, investors should view Utah commercial real estate through the lens of its employment structure and single family housing dynamics described earlier, supplemented by local market reports and transaction data outside this review.
Section 11Transactions and Capital Markets
Transaction volumes and capital market conditions determine liquidity and pricing for real estate assets. In Utah, as elsewhere, detailed data on the number of multifamily and commercial property sales, total transaction values, and cap rates are compiled by proprietary firms and recorded in county land records. There is no public statewide dataset in accessible text form here that aggregates these metrics.
Because of this, this review cannot state how many apartment communities, office buildings, industrial properties, or retail centers traded in Utah in 2025 or the first half of 2026, nor can it provide average cap rates or price per square foot figures for those asset classes. It also cannot quantify the share of capital coming from local versus out of state investors, institutional versus private buyers, or debt versus equity.
Given the lack of numeric capital markets data, investors must treat Utah as a market where on the ground intelligence and proprietary transaction data are required to understand liquidity and pricing. The macro indicators of low unemployment, growing personal income, and moderate home price appreciation suggest that capital should remain interested in Utah assets, particularly in growth corridors. However, without transaction statistics, the pace of buying and selling and the precise pricing environment cannot be characterized in this document.
Section 12Taxes
Property taxes influence net operating income and investment returns across residential and commercial properties. In Utah, property tax policy is administered under state law, with the Utah State Tax Commission playing a central role, but the attempt to access the Utah State Tax Commission property tax page in this environment returned a page not found message rather than substantive content. As a result, there is no accessible statewide summary of property tax rates, millage formulas, or effective tax burdens in Utah.
Because neither the Utah State Tax Commission page retrieved here nor other accessible public datasets provide numeric property tax rates for Utah, this review cannot state an average effective property tax rate for the state or for its counties, cannot compare Utah property tax burden with other states, and cannot quantify typical tax bills for residential or commercial properties. Any such figures would need to come from state and county tax records or independent tax policy research obtained outside this environment.
For investors, this means that property tax analysis in Utah must be conducted at the jurisdiction and property level, using up to date assessor and tax commission information. Assumptions based on national averages or other states patterns may not hold, and careful attention to local property tax structures, including assessment practices and any state level tax limitations, is important.
Section 13Insurance
Insurance, particularly property and casualty coverage, is a significant ongoing operating expense and a key component of risk management. State departments of insurance often publish data on premiums and losses, but in this environment no Utah specific numeric insurance data have been retrieved. The sources used here, which focus on employment, housing, income, housing finance, and flood risk, do not include figures on average property insurance premiums, claim frequencies, or loss ratios for Utah.
Consequently, this review cannot quantify typical property insurance costs per unit or per square foot for residential or commercial assets in Utah, nor can it compare insurance cost levels with those in neighboring states. It also cannot describe recent trends in premium growth or insurer participation in Utah markets.
Given this information gap, investors should treat insurance as a localized, asset specific variable. Actual premium quotes from insurers or brokers, based on building characteristics, location, hazard exposure, and coverage requirements, will provide far more reliable input to underwriting than any generalized assumptions. Physical and climate risks discussed below, particularly flood and severe storm exposure, will interact with insurance markets in ways that this statewide review cannot capture numerically.
Section 14Landlord Tenant and Regulatory Environment
The landlord tenant and housing regulatory framework in Utah is defined by state statutes and local ordinances that govern leases, notice requirements, security deposits, habitability standards, and eviction procedures. In this environment, the tools and sources used have not retrieved Utah specific statutory summaries or regulatory guides that can be quoted with numeric thresholds, such as maximum deposit amounts, notice periods, or specific time frames for legal processes.
As a result, this review cannot provide a detailed, authoritative outline of Utah landlord tenant law, cannot state whether there are statewide limits on rent increases or eviction moratoriums, and cannot quantify regulatory timelines that affect rental housing operations. It also cannot summarize zoning codes or growth management policies that affect where and how new multifamily or commercial development can take place.
For accredited investors, the implication is that legal and regulatory due diligence is essential and must rely on current Utah statutory texts, administrative rules, and local ordinances consulted outside this environment. Legal counsel with Utah specific experience can help interpret these rules and assess their impact on leasing, redevelopment, and value add strategies.
Section 15Infrastructure
Infrastructure supports economic activity and underpins real estate values across Utah. This includes interstate highways, freight and passenger rail, airports, water and sewer systems, and broadband networks. While state and local agencies publish extensive information about transportation and utility systems, no numeric statewide infrastructure metrics for Utah have been retrieved in this environment. There are no accessible summaries here of miles of interstate highway in Utah, annual airport passenger counts, or statewide broadband coverage percentages.
Nonetheless, Utah employment mix, with substantial jobs in trade, transportation, and utilities and in leisure and hospitality, implies a well developed transportation network. Major interstate highways and regional airports serve the Wasatch Front and other parts of the state, supporting logistics, tourism, and commuting. Industrial and logistics properties benefit from proximity to these corridors, while hotels and retail centers rely on visitor flows.
For investors, the important point is that infrastructure access remains a core underwriting factor, particularly for industrial, retail, and hospitality assets. However, specific infrastructure characteristics and planned improvements must be evaluated using local sources rather than statewide quantitative summaries in this document.
Section 16Climate and Physical Risks
Utah faces a range of climate and physical risks, including flooding along rivers and streams, flash floods in desert areas, wildfires, drought, and severe storms. Detailed statistics on the frequency and severity of these events for Utah are maintained by federal and state agencies, but such numeric tables are not visible here. The accessible Federal Emergency Management Agency flood maps page provides a qualitative framework for understanding flood risk nationally, which applies to Utah as well.
The Federal Emergency Management Agency explains that floods occur naturally and can happen almost anywhere, including areas not near large bodies of water. It notes that flood maps show how likely it is for an area to flood and that any place with a one percent or higher chance of experiencing a flood in a given year is considered to have high flood risk. Areas in this category have at least a one in four chance of flooding during a thirty year mortgage. The agency emphasizes that there is no such thing as a no risk zone, even outside mapped high risk areas. It also highlights that flood maps are used by mortgage lenders to determine insurance requirements and by communities to develop strategies for reducing flood risk.
While these definitions and uses of flood maps are national, they are directly relevant to Utah riverine and flash flood exposures. However, the Federal Emergency Management Agency page does not provide numeric values for how much of Utah land area or building stock lies within high risk flood zones, nor does it break down flood risk by metro area or county. Similarly, statewide wildfire and drought statistics for Utah are not available in the accessible text used here.
For investors, this means that climate and physical risk assessment in Utah must be conducted property by property, using flood maps, elevation data, wildfire risk tools, and local knowledge. This review can reiterate that properties in high risk flood zones face a substantial probability of flooding over a mortgage horizon and often higher insurance requirements, but it cannot quantify Utah specific hazard frequencies.
Section 17Opportunities
Several opportunity themes emerge from the publicly accessible data on Utah, despite the gaps.
First, Utah labor market remains robust. Total nonfarm employment reached 1,786.9 thousand jobs in June 2026, up 1.2 percent from a year earlier, while the unemployment rate declined from 3.8 percent in January to 3.6 percent in June. Professional and business services and education and health services together account for more than half a million jobs and are growing in the low to mid single digit range year over year. This supports demand for office space in select submarkets, medical and educational facilities, and a wide range of workforce housing near job centers in the Wasatch Front and other growing regions.
Second, the single family housing market shows continued, albeit moderate, price appreciation and expanding inventory. With a statewide median sale price of 528,124 dollars in May 2026, up 1.6 percent year over year, and 19,208 homes for sale, up 3.9 percent, Utah offers both price stability and increasing purchase opportunities. The fact that 21.6 percent of homes still sold above list price indicates that, in many submarkets, demand remains strong. Investors in single family rentals and build to rent projects can find opportunities where households prefer rental flexibility or face barriers to ownership at these price levels.
Third, construction employment growth of 2.2 percent over the year to June 2026 suggests that Utah development ecosystem remains active. This creates opportunities in land acquisition and development, particularly for well located multifamily and mixed use projects that align with Utah Housing Corporation tax credit and bond programs, as well as for build to rent and infill single family communities that cater to first time buyers and renters.
Fourth, the broader income context is supportive. The Bureau of Economic Analysis confirms that personal income increased in Utah in the first quarter of 2026, as part of the national pattern of rising incomes in forty nine states and the District of Columbia. Rising personal income, even without precise percentages, underpins demand for both rental and ownership housing and for retail and service properties.
Section 18Risks
Alongside these opportunities, Utah presents several risks that investors must weigh.
One risk is sectoral imbalance. While professional and business services, financial activities, and education and health services are growing, manufacturing employment has declined slightly over the past year and information employment has contracted more noticeably, with a 1.4 percent year over year decline as of June 2026. Trade, transportation, and utilities employment growth is close to flat. These trends could limit demand for certain types of industrial space and for some categories of office space tied to specific technology or manufacturing tenants.
A second risk is the scarcity of public numeric data on key real estate variables. This review lacks statewide or metro level statistics for multifamily and commercial rents, vacancy rates, absorption, and cap rates, as well as detailed property tax and insurance cost data. Without these numbers, investors relying solely on public data could underestimate competitive supply, overestimate achievable rents, or misprice operating costs in Utah submarkets.
Third, climate and physical hazards pose a risk that is difficult to quantify here. Utah exposure to flooding, wildfires, and drought can affect insurance costs, capital expenditures, and long term asset viability. The Federal Emergency Management Agency flood risk framework emphasizes that areas in high risk zones have at least a one in four chance of flooding over a typical mortgage term, but without Utah specific area coverage figures, investors must do more work to understand their individual asset exposures.
Fourth, regulatory and tax uncertainty is a risk. The absence of accessible statewide property tax metrics and Utah specific landlord tenant summaries in this environment means that investors could misjudge operating costs or legal constraints. Changes in state or local tax policies, zoning, or housing regulations could have material impacts on investment outcomes.
Finally, as with many high growth states, affordability pressures represent both an opportunity and a risk. While state programs such as Utah Housing Corporation New Construction First time Homebuyer Assistance, which provides up to 20,000 dollars per buyer for down payment, closing costs, or interest rate reductions on newly constructed homes, aim to improve access to ownership, sustained price appreciation relative to incomes could constrain demand or draw political attention to housing costs.
Section 19Investor Implications
For United States accredited investors, Utah presents as a dynamic but data constrained market. The Bureau of Labor Statistics data confirm that the state maintains a large and growing employment base, with 1,786.9 thousand nonfarm jobs and a 3.6 percent unemployment rate as of June 2026. Growth is concentrated in professional and business services, financial activities, education and health services, and construction, all of which support demand for office, medical, and residential properties in strategic locations.
Redfin statewide housing statistics show that Utah single family market has not stalled. The median sale price of 528,124 dollars and the 1.6 percent year over year price increase in May 2026, alongside a 3.9 percent rise in homes for sale and a still elevated share of homes selling above list price, point to a market in which buyers face more choice than before but still compete aggressively in many submarkets. For investors, this suggests that acquisition strategies must be disciplined on price while recognizing that demand remains resilient.
At the same time, the absence of publicly accessible numeric data on multifamily and commercial rents and vacancy rates and on property taxes and insurance costs means that Utah is not a market where one can rely on high level public statistics alone. Robust underwriting will require proprietary data sources, local partners, and asset level analysis. Climate and hazard risks, especially flooding in certain corridors and wildfire risk in wildland urban interfaces, need to be assessed carefully using Federal Emergency Management Agency maps and other tools outside this environment.
In a diversified portfolio, Utah can play the role of a growth oriented allocation tied to a service driven economy and a still appreciating housing market. Strategies that focus on well located workforce housing, selective single family rentals, and commercial assets aligned with growing sectors may benefit from Utah fundamentals. However, position sizing and risk premiums should reflect the information gaps and the need for additional due diligence beyond the public numbers presented here.
Section 20Conclusion
As of mid 2026, Utah statewide real estate landscape is shaped by a tight labor market, sectorally diverse job growth, and a single family housing market that continues to appreciate modestly while inventory expands. The Bureau of Labor Statistics reports that total nonfarm employment stands at 1,786.9 thousand jobs and that the unemployment rate has edged down to 3.6 percent, with particularly strong growth in professional and business services, financial activities, education and health services, and construction. These sectors underpin ongoing demand for housing and commercial space, especially along the Wasatch Front and in other growth corridors.
Redfin Utah housing market data show that the median home sold for 528,124 dollars in May 2026, up 1.6 percent from a year earlier, with 19,208 homes on the market and 21.6 percent of sales closing above list price. These conditions suggest that buyer demand remains strong, even as inventory increases and competition cools slightly from previous peaks. Utah Housing Corporation role as the state housing finance agency, including its New Construction First time Homebuyer Assistance program that offers up to 20,000 dollars in assistance per eligible homebuyer, highlights the state policy focus on homeownership and affordable housing.
At the same time, this review has been clear about its limits. Due to access and format constraints, it does not include numeric figures for Utah population, multifamily and commercial rents and vacancy rates, property tax levels, or insurance premiums. It also cannot quantify climate and hazard frequencies for Utah. The analysis therefore concentrates on what can be documented from Bureau of Labor Statistics employment data, Redfin single family housing data, Bureau of Economic Analysis income summaries, Utah Housing Corporation program descriptions, United States Department of Housing and Urban Development Fair Market Rent documentation, and Federal Emergency Management Agency flood risk guidance.
For accredited investors, Utah offers both potential upside and the need for careful, data rich due diligence. The state economic and housing fundamentals suggest durable demand for well located residential and commercial assets, but capturing that opportunity requires supplementing the public statistics presented here with detailed local market information, proprietary datasets, and professional advice. This review is intended as a structured, sourced foundation for that work, not as a substitute for transaction level analysis and underwriting.
Sources
- U.S. Bureau of Labor Statistics, Utah Economy at a Glance, https://www.bls.gov/regions/mountain-plains/utah.htm
- Redfin, Utah Housing Market House Prices and Trends, https://www.redfin.com/state/Utah/housing-market
- U.S. Bureau of Economic Analysis, Personal Income by State, https://www.bea.gov/data/income-saving/personal-income-by-state
- Utah Housing Corporation, UHC Utah Housing Corp, https://utahhousingcorp.org/
- Utah State Tax Commission, Property Tax page not found message accessed, https://tax.utah.gov/property
- U.S. Department of Housing and Urban Development, HUD Fair Market Rents by State, County, and Metropolitan Areas, https://www.huduser.gov/portal/datasets/fmr.html
- Federal Emergency Management Agency, Flood Maps, https://www.fema.gov/flood-maps