In brief · summary: Vermont
Vermont State Real Estate Market Review
Section 01Executive Summary
Vermont is a small New England state with a distinctive mix of advanced manufacturing, education and health services, tourism, and government that anchors a modest but relatively stable real estate market. Labor market data from the United States Bureau of Labor Statistics show that Vermont’s statewide unemployment rate remained at 2.6 percent from February through June 2026 on a seasonally adjusted basis, with the civilian labor force edging down from 344.0 thousand people in February 2026 to 338.8 thousand people in June 2026 and total nonfarm employment slipping from 311.8 thousand jobs in January to 310.6 thousand jobs in June 2026, a twelve month change of negative 0.2 percent as of June. This combination of very low unemployment and slightly declining employment suggests a tight labor market with limited slack, but also a small scale economy that is not currently expanding rapidly.
On the housing side, Redfin reports that statewide in Vermont the median sale price across all home types in May 2026 was 442,428 dollars, an increase of 2.3 percent compared with May 2025. In the same month, there were 3,785 homes for sale across Vermont, up 17.7 percent year over year, and 23.4 percent of Vermont homes sold above list price, an increase of 0.8 percentage points from the prior year. By contrast, Redfin’s United States housing overview shows that nationally the median sale price in May 2026 was 398,771 dollars, up 2.0 percent year over year, with 1,483,839 homes for sale, up 0.7 percent, and 24.9 percent of homes selling above list price, a decrease of 0.083 percentage points. These figures place Vermont as a relatively high price, high competition state where inventory is finally rising from very tight levels but buyer demand remains intense.
On the supply side, the Vermont Housing Finance Agency reports that the statewide HousingData building permits dataset has been updated with the United States Census Bureau’s newest official release for 2025, and that 2,294 buildings were permitted statewide in 2025. Vermont Housing Finance Agency notes that this represents a slight dip in building permits compared with the previous year, after a period of steady increases since 2019. For multifamily and single family investors, this means that new supply remains limited in absolute terms, and that much of the existing stock remains older and in need of reinvestment.
At the same time, public numeric data on key fundamentals such as Vermont population, household income, statewide rents, vacancy rates, and capitalization rates are not available in this environment. The Census QuickFacts profile for Vermont is blocked behind Cloudflare, the Census state population estimate file is truncated before the Vermont row is visible, the United States Department of Housing and Urban Development fair market rent interface does not display rent amounts in the accessible extract, and statewide commercial real estate statistics are housed in proprietary sources such as CoStar and RealPage. As a result, this review grounds its quantitative analysis in Vermont Bureau of Labor Statistics data, statewide housing metrics from Redfin, statewide building permit counts from Vermont Housing Finance Agency, and national and regional context from Census, Federal Emergency Management Agency, and the National Centers for Environmental Information, while describing other dimensions qualitatively.
For accredited investors, Vermont offers a relatively small, high price residential market with tight labor conditions, significant exposure to climate and weather risks, and a limited new construction pipeline. It can serve as a defensive, low volatility allocation in a diversified portfolio, but its scale and data limitations require careful property level underwriting.
Section 02Population and Migration
Population and migration trends shape household formation and thus housing demand. In this environment there is no official numeric statewide population figure for Vermont that can be cited from the accessible Census datasets. The Census QuickFacts page that normally provides population estimates and demographic breakdowns for Vermont is blocked by a Cloudflare security page, and the Census state population estimates file for 2020 through 2025 is truncated before the Vermont state row appears. As a result, this review cannot report Vermont’s total population or population growth rate with numeric precision.
Regional and national context can still be described. The same Census state population file shows that the United States population estimate for 2025 was 341,784,857 people. The New England census division, which includes Vermont along with Connecticut, Maine, Massachusetts, New Hampshire, and Rhode Island, had an estimated population of 15,431,980 people in 2025. New England’s net migration in 2025, measured as the sum of domestic and international migration, was 45,079 people, with 1,443 people of net natural increase and a residual adjustment of 475, indicating that the region as a whole was growing modestly through a combination of migration and natural change.
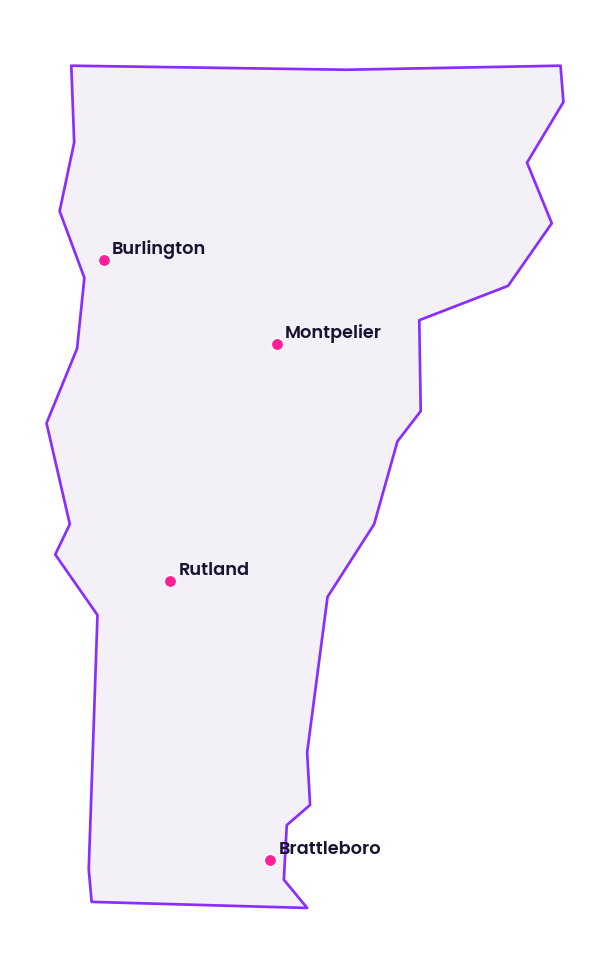
Qualitatively, Vermont’s population is concentrated in small cities and towns such as Burlington, South Burlington, Montpelier, Rutland, and Brattleboro, with many rural communities and a significant share of seasonal residents and second homes, particularly in ski and recreation areas. The state has long experienced slower population growth than the national average and often relies on in migration of students, retirees, and lifestyle driven movers to offset natural decrease or net outmigration of younger adults. For investors, the absence of precise population numbers in this environment means that demand must be inferred from labor, housing price, and permit data and validated with local knowledge rather than from a simple statewide growth rate.
Section 03Jobs and Economic Anchors
Vermont’s labor market provides the demand base for both housing and commercial real estate. Bureau of Labor Statistics Economy at a Glance data for Vermont show a small but generally stable labor force with very low unemployment and modest declines in nonfarm employment over the past year.
The table below summarizes key statewide labor metrics for the first half of 2026 on a seasonally adjusted basis.
| Month 2026 | Civilian labor force (thousands) | Employment (thousands) | Unemployment rate (percent) | Total nonfarm employment (thousands) | Twelve month change in total nonfarm employment (percent) |
|---|---|---|---|---|---|
| January | 345.4 | 336.2 | 2.7% | 311.8 | negative 0.7 |
| February | 344.0 | 334.9 | 2.6% | 311.5 | negative 0.4 |
| March | 342.5 | 333.6 | 2.6% | 311.2 | negative 0.4 |
| April | 341.1 | 332.2 | 2.6% | 310.8 | negative 0.3 |
| May | 339.9 | 331.0 | 2.6% | 310.3 | 0.0% |
| June preliminary | 338.8 | 330.0 | 2.6% | 310.6 | negative 0.2 |
All values in this table are from the United States Bureau of Labor Statistics Vermont Economy at a Glance series, with data extracted on August 7, 2026.
These data indicate that Vermont’s labor force shrank by about 6.6 thousand people between January and June 2026, while employment fell by about 6.2 thousand over the same period. The unemployment rate remained in a very narrow range between 2.6 and 2.7 percent, signaling that most people who want work are employed, but the modest negative twelve month changes in total nonfarm employment suggest that the state is not adding jobs on net. For investors, this means that housing and commercial demand is underpinned by a relatively stable employment base rather than by rapid growth, and that rent growth strategies should be calibrated accordingly.
Sector level employment data provide insight into Vermont’s economic composition and its real estate demand drivers. For June 2026, Bureau of Labor Statistics reports the following statewide seasonally adjusted employment levels and twelve month percentage changes by major industry:
- Mining and logging had 0.9 thousand jobs, with a twelve month change of 12.5 percent.
- Construction had 16.5 thousand jobs, with a twelve month change of 1.2 percent.
- Manufacturing had 27.8 thousand jobs, with a twelve month change of 1.8 percent.
- Trade, transportation, and utilities had 50.9 thousand jobs, with a twelve month change of negative 1.4 percent.
- Information had 4.3 thousand jobs, with a twelve month change of negative 2.3 percent.
- Financial activities had 11.3 thousand jobs, with a twelve month change of negative 1.7 percent.
- Professional and business services had 31.9 thousand jobs, with a twelve month change of negative 2.4 percent.
- Education and health services had 65.8 thousand jobs, with a twelve month change of 1.1 percent.
- Leisure and hospitality had 34.7 thousand jobs, with a twelve month change of negative 1.1 percent.
- Other services had 9.9 thousand jobs, with a twelve month change of negative 2.0 percent.
- Government had 56.6 thousand jobs, with a twelve month change of 0.7 percent.
These figures show that education and health services is the single largest sector in Vermont by employment, followed by government and trade, transportation, and utilities. Manufacturing and leisure and hospitality are also significant, while information and financial activities are relatively small in absolute terms. Over the past year, growth has been concentrated in mining and logging, construction, manufacturing, education and health, and government, while trade, information, finance, professional services, leisure, and other services have seen declines.
For real estate, this sector mix means that demand for medical office, hospital adjacent uses, and workforce housing tied to education and health institutions is important, particularly in and around Burlington, South Burlington, and regional centers. Government employment supports office and institutional space in the capital region and county seats. Tourism and leisure contribute to hotel and short term rental demand in ski areas and scenic towns, though the recent small decline in leisure and hospitality employment suggests some moderation. Investors should view Vermont as an economy anchored by public and quasi public sectors and by relatively stable services rather than as a high growth private sector hub.
Section 04Income
Income distribution and growth are central to assessing affordability, rent potential, and depth of homebuyer demand. In this environment, there is no accessible numeric statewide income series for Vermont. The Census QuickFacts tool that would normally report median household income and per capita income for Vermont is blocked, and the American Community Survey tabulations that contain detailed income distributions are not available in a machine readable format here. Bureau of Economic Analysis tables that provide personal income by state are delivered through interactive systems that do not yield Vermont figures in the accessible extracts.
Without these sources, this review cannot state Vermont median household income, per capita income, or the share of households in specific income brackets. Qualitatively, Vermont is widely characterized as a state with modest average incomes relative to some other New England states, combined with relatively high housing and energy costs, especially in certain markets. There is a segment of higher income households associated with education, health care, manufacturing, and remote professional work, alongside many households in agriculture, small business, and service sectors with more moderate incomes.
For investors, the absence of numeric income data underscores the need to obtain property level and local market income information outside this environment. Underwriting should be conservative on rent to income ratios and attentive to the potential for cost burdens among lower and middle income renters and homeowners, especially in high price submarkets.
Section 05Housing and Multifamily
Vermont’s housing stock is dominated by single family homes and small multifamily properties, with a modest supply of larger apartment communities, especially in Burlington and a few regional centers. Redfin’s statewide housing metrics provide a clear view of recent price and supply dynamics.
| Geography | Month and year | Median sale price (all home types, dollars) | Year over year median price change (percent) | Homes for sale (all home types) | Year over year change in homes for sale (percent) | Homes sold above list price (percent of sales) | Year over year change in share selling above list (percentage points, direction) |
|---|---|---|---|---|---|---|---|
| Vermont statewide | May 2026 | 442,428 | +2.3% | 3,785 | +17.7% | 23.4% | +0.8% |
| United States | May 2026 | 398,771 | +2.0% | 1,483,839 | +0.7% | 24.9% | -0.083% |
All values in this table are from Redfin’s Vermont state housing market and United States housing market overviews as of August 7, 2026.
These figures show that Vermont’s median sale price in May 2026 was more than ten percent higher than the national median, even though Vermont’s year over year price growth of 2.3 percent is similar in magnitude to the national 2.0 percent. The statewide number of homes for sale increased sharply, by 17.7 percent year over year, which suggests some easing of supply constraints after a period of tight inventory, while the national inventory increased only 0.7 percent. At the same time, nearly one in four Vermont homes, 23.4 percent, sold above list price in May 2026, and that share rose by 0.8 percentage points over the year, indicating that competition remains strong despite higher inventory. Nationally, 24.9 percent of homes sold above list price, but that share edged down slightly.
For multifamily, Vermont’s small scale and dispersed population mean that much of the rental stock is in smaller buildings such as duplexes, triplexes, and small apartment properties. Larger professionally managed apartment communities are concentrated in Burlington and adjacent municipalities, as well as in a few regional hubs. There are no publicly accessible statewide numeric data in this environment for the number of multifamily units, average sale price per unit, or share of total housing stock that is multifamily. Private datasets from CoStar, RealPage, and Yardi Matrix track this information, but they are not open here.
From an investment perspective, Vermont’s elevated median home price and persistent bidding pressure support the case for multifamily and rental housing as a substitute for ownership, particularly for younger households and service workers. The recent rise in homes for sale could modestly relieve pressure at the margin, but given the small absolute number of listings, the underlying scarcity remains. Multifamily investments in core markets can benefit from limited new supply and constrained home purchase options, but they also face limited scale and liquidity compared with large metropolitan areas.
Section 06Rents
Rents for apartments and single family rentals drive cash flow for residential investment, yet there is no statewide numeric rent series for Vermont available in this environment. The United States Department of Housing and Urban Development’s Fair Market Rents documentation system presents a selection interface where users first choose a state, then a county or metropolitan area, but the accessible extract does not display any fair market rent dollar amounts for Vermont counties or for the Burlington metropolitan area.
Similarly, the American Community Survey would ordinarily provide median gross rent by state and county, but those tables are not accessible here. Major rental data providers such as CoStar, RealPage, and Yardi Matrix, as well as listing platforms, track asking and effective rents in Vermont markets, but their numeric series are not publicly exposed in this context.
Given this limitation, this review cannot state Vermont median rent levels, rent change over time, or rent to income ratios. Rents in Vermont are known qualitatively to be higher in Burlington and nearby communities, in ski and resort areas, and in locations with tight housing supply and strong job or amenity demand, and lower in more rural and economically stressed areas. For investors, rent assumptions must be built from direct evidence such as in place rent rolls, recent leases, and local market surveys rather than from statewide averages.
Section 07Vacancy
Vacancy rates in multifamily properties, single family rentals, and commercial assets are key indicators of market balance, but there is no public statewide vacancy series for Vermont in this environment. The Census Bureau’s housing vacancy survey does not provide Vermont specific figures in the accessible data, and proprietary sources that track apartment occupancy and commercial vacancy by market are not open here.
In many Vermont markets, anecdotal reports and local agency commentary describe tight vacancy in rental housing, especially in Burlington and select regional centers, alongside more variable conditions in rural areas. However, without numeric vacancy percentages, this review cannot quantify these patterns or trace them over time.
Investors should therefore treat vacancy as a property and submarket specific variable. Analysis should focus on leased percentages over time, absorption history, and the competitive set in the immediate area rather than on statewide averages. Conservative assumptions about potential downtime and lease up speed are advisable, particularly for value add or new construction multifamily projects.
Section 08Supply Pipeline
New construction and rehabilitation activity determine how quickly Vermont’s housing and commercial stock can respond to demand. Statewide, the Vermont Housing Finance Agency reports that the building permits dataset for Vermont, derived from United States Census Bureau data, shows that 2,294 buildings were permitted in 2025. Vermont Housing Finance Agency states that this statewide total represents a slight dip in building permits compared with the previous year and that permit activity had been steadily increasing since 2019 before this recent moderation.
Although the Vermont Housing Finance Agency note does not separate permits by structure type or by number of units per building, the statewide total of 2,294 permitted buildings in 2025 underscores the small scale of Vermont’s construction pipeline relative to large states. In many cases, a permitted building is a single family house, a small multifamily structure, or a nonresidential building, so the number of new housing units added annually is likely only a fraction of total existing stock.
There are no public numeric data in this environment on the number of multifamily units under construction, the distribution of permits by county, or the volume of commercial development by property type. Local planning and zoning records would typically capture these details but are not summarized at the statewide level here.
For investors, the small absolute number of permits and the recent dip in activity suggest that supply driven overshoot risk is modest in most Vermont markets, especially for multifamily. At the same time, limited new construction can mean that older properties see more wear and may require higher capital expenditure to remain competitive. Understanding local development pipelines in Burlington, South Burlington, Montpelier, and other centers remains important, but the statewide backdrop is one of constrained new supply.
Section 09Single Family Homes
Single family homes are the backbone of Vermont’s housing market and a key asset class for both owner occupants and single family rental investors. Redfin’s statewide housing data for May 2026, which cover all home types but are heavily influenced by single family transactions, show that Vermont’s median sale price of 442,428 dollars is substantially higher than the national median of 398,771 dollars. The 2.3 percent year over year price increase in Vermont is slightly above the national 2.0 percent growth rate, suggesting that Vermont prices are keeping pace with or slightly outpacing national trends despite the state’s modest economic growth.
The 17.7 percent increase in the number of homes for sale, from a year earlier to 3,785 listings in May 2026, is notable. It indicates that sellers are returning to the market after a period of tight supply, perhaps in response to higher prices or changing life circumstances. However, the absolute number of listings remains small, reflecting Vermont’s small population and housing stock. The fact that 23.4 percent of Vermont homes sold above list price in May 2026, up 0.8 percentage points from the previous year, implies that multiple offer situations and bidding above asking remain common in many transactions.
For single family rental investors, these data mean that acquisition costs are relatively high, and competition from owner occupants remains strong. Yield strategies based on purchasing at a discount to replacement cost may be difficult to execute in desirable school districts and amenity rich areas. Investors may find more viable opportunities in secondary locations or in properties that require renovation, but such strategies must balance capital expenditure needs against achievable rents and long term appreciation prospects.
Section 10Commercial Real Estate and Retail Centers
Vermont’s commercial real estate stock is small and distributed across several modest urban centers and many small towns. Office, industrial, and retail properties serve local and regional demand rather than large national tenants in most cases. There is no public statewide numeric dataset in this environment that provides current commercial vacancy rates, rents per square foot, absorption, or capitalization rates by property type.
Office space is concentrated in Burlington and South Burlington, the Montpelier capital region, and a few larger towns such as Rutland. Demand drivers include state government, health care systems, higher education, financial services, and professional practices. National trends toward hybrid and remote work have affected office utilization, but in smaller markets with limited supply and locally anchored tenants, the impact may differ from that in major metropolitan areas. Without numeric data, this review cannot quantify office vacancy or rent levels, but investors should expect smaller floor plates, older buildings, and limited institutional liquidity compared with large markets.
Industrial and logistics space in Vermont includes warehouses, distribution centers, light manufacturing facilities, and service oriented industrial properties. Manufacturing employment of 27.8 thousand jobs and trade, transportation, and utilities employment of 50.9 thousand jobs in June 2026 indicate a real, if modest, base of industrial users. Many of these facilities are tied to food processing, specialty manufacturing, and regional distribution rather than to large national logistics networks.
Retail real estate is heavily focused on grocery anchored neighborhood centers, small downtown storefronts, and highway oriented strips. With leisure and hospitality employment at 34.7 thousand jobs in June 2026 and a sizable tourism and outdoor recreation sector, hospitality and restaurant uses are important components of the built environment, especially in ski towns and along travel corridors.
Because no statewide commercial rent or vacancy data are available, investors must assess each asset on its own merits, looking at tenant quality, lease terms, local competition, and building condition. Cap rates for stabilized properties in Vermont are likely to be higher than those in prime urban cores but lower than in distressed markets, reflecting a tradeoff between stability and scale. Actual cap rates must be inferred from comparable sales and lender feedback rather than from public averages.
Section 11Transactions and Capital Markets
Transaction volume and capital markets conditions determine the ease of entering and exiting Vermont investments. There is no consolidated public dataset in this environment that reports statewide transaction volumes by property type, average price per square foot, or capitalization rates for Vermont. County level deed records and property transfer tax filings record individual transactions, and brokerage research aggregates some of this information, but these sources are not summarized numerically in the accessible datasets.
Nationally, higher interest rates in 2025 and 2026 have raised borrowing costs for both residential and commercial real estate. While this review does not quote specific interest rates, the general environment is one in which leveraged buyers face higher debt service and lenders apply more stringent underwriting standards. In a small state like Vermont, where many properties are relatively low density and of modest size, loan amounts may fall below thresholds that attract larger institutional lenders, increasing reliance on local and regional banks, credit unions, and specialized lenders.
For accredited investors, this means that Vermont deals may require more equity, more bespoke financing structures, or a higher tolerance for illiquidity. Pricing may be less volatile than in large markets, but it may also be slower to adjust, and transaction processes may be more relationship driven. Without public cap rate time series, investors must be prepared to triangulate yields using property level financials and comparable sales rather than relying on statewide benchmarks.
Section 12Taxes
Taxation affects both operating cash flow and investment returns. The Vermont Department of Taxes describes its mission as serving Vermonters by administering state tax laws fairly and efficiently so that taxpayers understand and comply with their obligations. The department’s home page highlights several key areas, including property, individual, business, and other tax categories, but the accessible extract does not list specific tax rates.
The department notes that education property tax rates for the fiscal year 2027 period are posted on its website and that taxpayers seeking information about their property tax rates can consult those materials. However, the numeric education property tax rates themselves do not appear in the accessible text. There is no statewide average effective property tax rate or specific income or sales tax rate figure available in this environment.
For investors, the implication is that property taxes are a material expense and that they fund education through an education property tax system, but this review cannot quantify typical millage or effective rates. Underwriting must therefore rely on specific property tax bills, municipal rate tables, and professional tax analysis obtained outside this environment. Vermont’s tax regime should be treated as an important diligence item rather than as a known quantity from public summary data.
Section 13Insurance
Insurance regulation in Vermont is handled by the Department of Financial Regulation’s Insurance Division. The division states that its aim is to maintain the affordability and availability of insurance for Vermonters while certifying that insurers can meet their contractual obligations. It emphasizes that all insurance policies sold in Vermont are reviewed and approved by the Insurance Division to ensure they provide protections mandated by Vermont law and that the division enforces solvency laws, consumer protection laws, and health insurance laws. The Insurance Division also notes that it conducts annual and periodic audits of health insurance plans to ensure compliance with Vermont regulations.
The accessible materials do not include numeric data on insurance premiums for homeowners, commercial property, or flood insurance, nor do they present statewide average loss ratios or claim frequencies. As a result, this review cannot report typical insurance costs per unit or per square foot for Vermont properties.
Qualitatively, Vermont faces property insurance considerations related to winter weather, heavy precipitation, flooding along rivers and streams, and in some areas wind and ice. Insurers must balance these risks with regulatory requirements and market competition. For investors, this means that insurance coverage is a critical input to underwriting. Policies may need to address not only standard property and liability coverage but also flood coverage where required by lenders or indicated by Federal Emergency Management Agency flood maps. In the absence of statewide premium data, accurate insurance cost projections require quotes specific to each property and coverage mix.
Section 14Landlord Tenant and Regulatory Environment
Vermont’s landlord tenant environment is shaped by state statutes that govern residential and commercial leasing, fairness in treatment of tenants, and related matters. The accessible state level materials in this environment do not provide a consolidated description of Vermont’s landlord tenant law or any numeric measures such as typical eviction timelines or the number of landlord tenant cases. However, general legal context suggests that Vermont balances tenant protections with landlord rights and that leases must comply with state level requirements around habitability, notice, and due process.
There is no statewide rent control or rent stabilization scheme described in the accessible sources. As of the information visible here, Vermont has not adopted a uniform cap on rent increases across the private housing stock. Local initiatives in certain jurisdictions may introduce specific rules or preferences for affordable housing, but no numeric policy parameters are evident in the available documents.
For investors, this environment implies that market rent properties can generally be operated with flexibility on rent setting, subject to fair housing and consumer protection laws. Nonetheless, detailed legal review is essential for each jurisdiction and property type, and investors should ensure that lease forms, security deposit handling, and notice procedures are compliant and consistent with evolving regulatory and political conditions.
Section 15Infrastructure
Infrastructure underpins real estate performance in Vermont, particularly given the state’s challenging winter conditions and rural character. Roads, bridges, water and sewer systems, and energy infrastructure must serve dispersed communities and withstand freeze thaw cycles, snow, and ice. There are no statewide numeric infrastructure condition scores or capital spending figures accessible in this environment, so this review cannot quantify Vermont’s infrastructure investment or backlog.
From a qualitative perspective, Vermont relies heavily on state highways and local roads, regional airports, and utility networks that are critical to both residential and commercial uses. In smaller towns, limited infrastructure can constrain development capacity, while in urban centers such as Burlington and South Burlington, existing networks support denser residential and commercial districts.
Investors should pay close attention to the specific infrastructure context of each asset, including road access and maintenance, water and sewer reliability and capacity, and the presence of any special assessments or utility district charges. In some cases, infrastructure constraints may cap future density or require substantial offsite improvements for new development.
Section 16Climate and Physical Risks
Vermont’s climate and physical risk profile is distinct from that of many Sun Belt markets but still material for real estate. Federal Emergency Management Agency flood map guidance emphasizes that floods can occur almost anywhere, that flood maps identify areas with the highest risk, and that any location with at least a one percent annual chance of flooding is considered high risk. Properties in such zones have at least a one in four chance of flooding during a thirty year mortgage. Vermont’s river valleys and low lying communities are exposed to riverine flooding and flash floods driven by heavy rainfall and snowmelt.
The National Centers for Environmental Information maintains an extensive archive of atmospheric and hydrologic data and notes that it archives over 229 terabytes of environmental data each month from more than 130 observing platforms. This archive includes records of storms, precipitation, and temperature patterns that illustrate Vermont’s exposure to heavy snow, ice storms, and intense rainfall events. Recent years have seen high profile flood events affecting Vermont communities, though this review does not present event specific numeric damage estimates.
Physical risks to Vermont properties include flooding from rivers and streams, erosion and slope instability in hilly areas, damage from snow and ice loads on roofs and structures, and disruptions from power outages during storms. Climate change may increase the intensity and frequency of heavy precipitation events, affecting flood risk, while warmer winters and changing snowpack patterns can alter dynamics in ski and recreation areas.
Investors should incorporate climate and physical risk assessment into due diligence, including reviewing Federal Emergency Management Agency flood maps for specific sites, understanding elevation and drainage, and evaluating building resilience features such as roof design, insulation, drainage systems, and backup power options.
Section 17Opportunities
Several opportunity themes stand out in Vermont’s statewide real estate market.
First, Vermont’s low unemployment and stable employment base in education and health services, government, and manufacturing provide a foundation for long term housing demand, even in the absence of rapid job growth. With 65.8 thousand jobs in education and health services and 56.6 thousand government jobs as of June 2026, there is a large and relatively stable pool of workers who need housing and services in key centers.
Second, the statewide housing metrics indicate that Vermont commands a price premium over the national market. A median sale price of 442,428 dollars and a nearly one quarter share of homes selling above list price suggest that Vermont is perceived as a desirable place to live, with constrained supply and strong demand. Investors who can acquire or develop well located single family or multifamily assets may benefit from this pricing power, particularly in submarkets with limited land availability and appealing amenities.
Third, the statewide building permit total of 2,294 buildings in 2025, combined with a slight dip from the prior year, points to a constrained new supply pipeline. In markets where demand remains strong, this can support rent and price stability for existing properties and reduce the risk of oversupply.
Fourth, Vermont’s tourism and outdoor recreation assets create opportunities in hospitality, short term rentals, and mixed use properties in ski and resort areas. While these segments are more cyclical and sensitive to weather and travel patterns, they can offer attractive returns when managed prudently.
Section 18Risks
Investing in Vermont also entails several risks.
The first is scale and liquidity. Vermont is a small state with a limited number of large properties and a relatively small pool of institutional grade assets. This can make it harder to assemble or exit large portfolios and can lead to pricing that is driven by a few active buyers and sellers rather than by deep markets.
Second, the absence of public numeric data on key fundamentals such as population, income, rents, vacancy, and cap rates in this environment complicates analysis. Investors must rely heavily on property level data, local expertise, and proprietary research. Those who assume that Vermont behaves like larger markets without evidence may misjudge risk and return.
Third, climate and physical risks are significant. Flooding in river valleys, heavy snow and ice, and aging infrastructure can damage properties and disrupt operations. Insurance costs and coverage terms may evolve as these risks are reassessed by insurers, and the need for resilience investments may grow over time.
Fourth, Vermont’s relatively high housing prices compared with national medians, combined with modest job growth, can strain affordability for lower and middle income households. This can increase political and community pressure for affordable housing measures, zoning changes, or other interventions that affect development feasibility and rent growth, even if no numeric policy parameters are evident now.
Finally, the broader capital markets environment of higher interest rates and tighter credit standards affects Vermont as it does other markets. Leverage assumptions that were viable in a lower rate environment may no longer apply, and return expectations must account for higher debt service and potentially slower appreciation.
Section 19Investor Implications
For accredited investors, Vermont presents a niche but meaningful opportunity within a diversified real estate portfolio. The state offers a combination of relatively high housing prices, low unemployment, stable public and service sector employment, and a constrained new construction pipeline. These factors support long term occupancy and price resilience for well located residential and mixed use assets.
At the same time, Vermont’s small scale, limited liquidity, and data gaps require a more bespoke, research intensive approach. Multifamily and single family rental investments should be underwritten using conservative assumptions about rent growth, with careful attention to property condition, energy efficiency, and insurance and tax costs. Commercial investments should focus on assets with strong tenant credit and durable demand, such as medical office near hospitals, essential retail in established trade areas, and industrial properties serving local and regional supply chains.
Portfolio construction might treat Vermont as a stabilizing allocation that balances exposure to faster growing but more volatile markets. The state’s tourism and recreational assets add a potential upside component, but they should be balanced by more stable residential and essential services exposures.
Section 20Conclusion
Vermont’s statewide real estate and multifamily market reflects the characteristics of a small, high cost, and stable New England state. Labor market data show low unemployment and a modestly declining job base, with education and health services, government, and manufacturing as key employers. Housing data from Redfin indicate that Vermont’s median home price of 442,428 dollars and significant share of homes selling above list price place it among higher cost states, even as inventory finally begins to rise from very tight levels. Building permits totaling 2,294 buildings statewide in 2025 underscore the limited scale of new supply.
At the same time, the lack of accessible numeric statewide data on population, income, rents, vacancy, and capitalization rates means that this review cannot provide some of the usual quantitative benchmarks. Instead, it relies on Bureau of Labor Statistics labor data, Redfin housing metrics, Vermont Housing Finance Agency permit counts, and national context from Census, Federal Emergency Management Agency, and the National Centers for Environmental Information.
For investors, Vermont can serve as a smaller, relatively defensive market with specific opportunities in multifamily, single family rentals, and essential commercial assets, particularly in and around Burlington and other regional centers. Realizing those opportunities requires granular due diligence, realistic expectations about scale and liquidity, and careful management of climate and insurance risks. This review provides a structured starting point, but it should be complemented by property level data and professional advice before any investment decisions are made.
Sources
- United States Bureau of Labor Statistics, Vermont Economy at a Glance ,, https://www.bls.gov/eag/eag.vt.htm
- United States Bureau of Labor Statistics, Current Employment Statistics State and Area ,, https://www.bls.gov/sae
- United States Census Bureau, State Population Totals and Components of Change 2020 to 2025, NST EST2025 ALLDATA CSV, Vermont state row not visible in truncated extract ,, https://www2.census.gov/programs-surveys/popest/datasets/2020-2025/state/totals/NST-EST2025-ALLDATA.csv
- United States Census Bureau, QuickFacts Vermont, access attempted, blocked by Cloudflare ,, https://www.census.gov/quickfacts/VT
- Redfin, Vermont Housing Market, House Prices and Trends ,, https://www.redfin.com/state/Vermont/housing-market
- Redfin, United States Housing Market and Prices ,, https://www.redfin.com/us-housing-market
- Vermont Housing Finance Agency, VHFA News, building permits dataset update and 2025 statewide permits ,, https://vhfa.org
- Vermont Department of Taxes, home page and property tax information notices ,, https://tax.vermont.gov
- Vermont Department of Financial Regulation, Insurance Division overview ,, https://dfr.vermont.gov/insurance
- United States Department of Housing and Urban Development, Fair Market Rents Documentation System interface ,, https://www.huduser.gov/portal/datasets/fmr/fmrs/FY2024_code/select_Geography.odn
- Federal Emergency Management Agency, Flood Maps ,, https://www.fema.gov/flood-maps
- National Centers for Environmental Information, National Centers for Environmental Information home page ,, https://www.ncei.noaa.gov